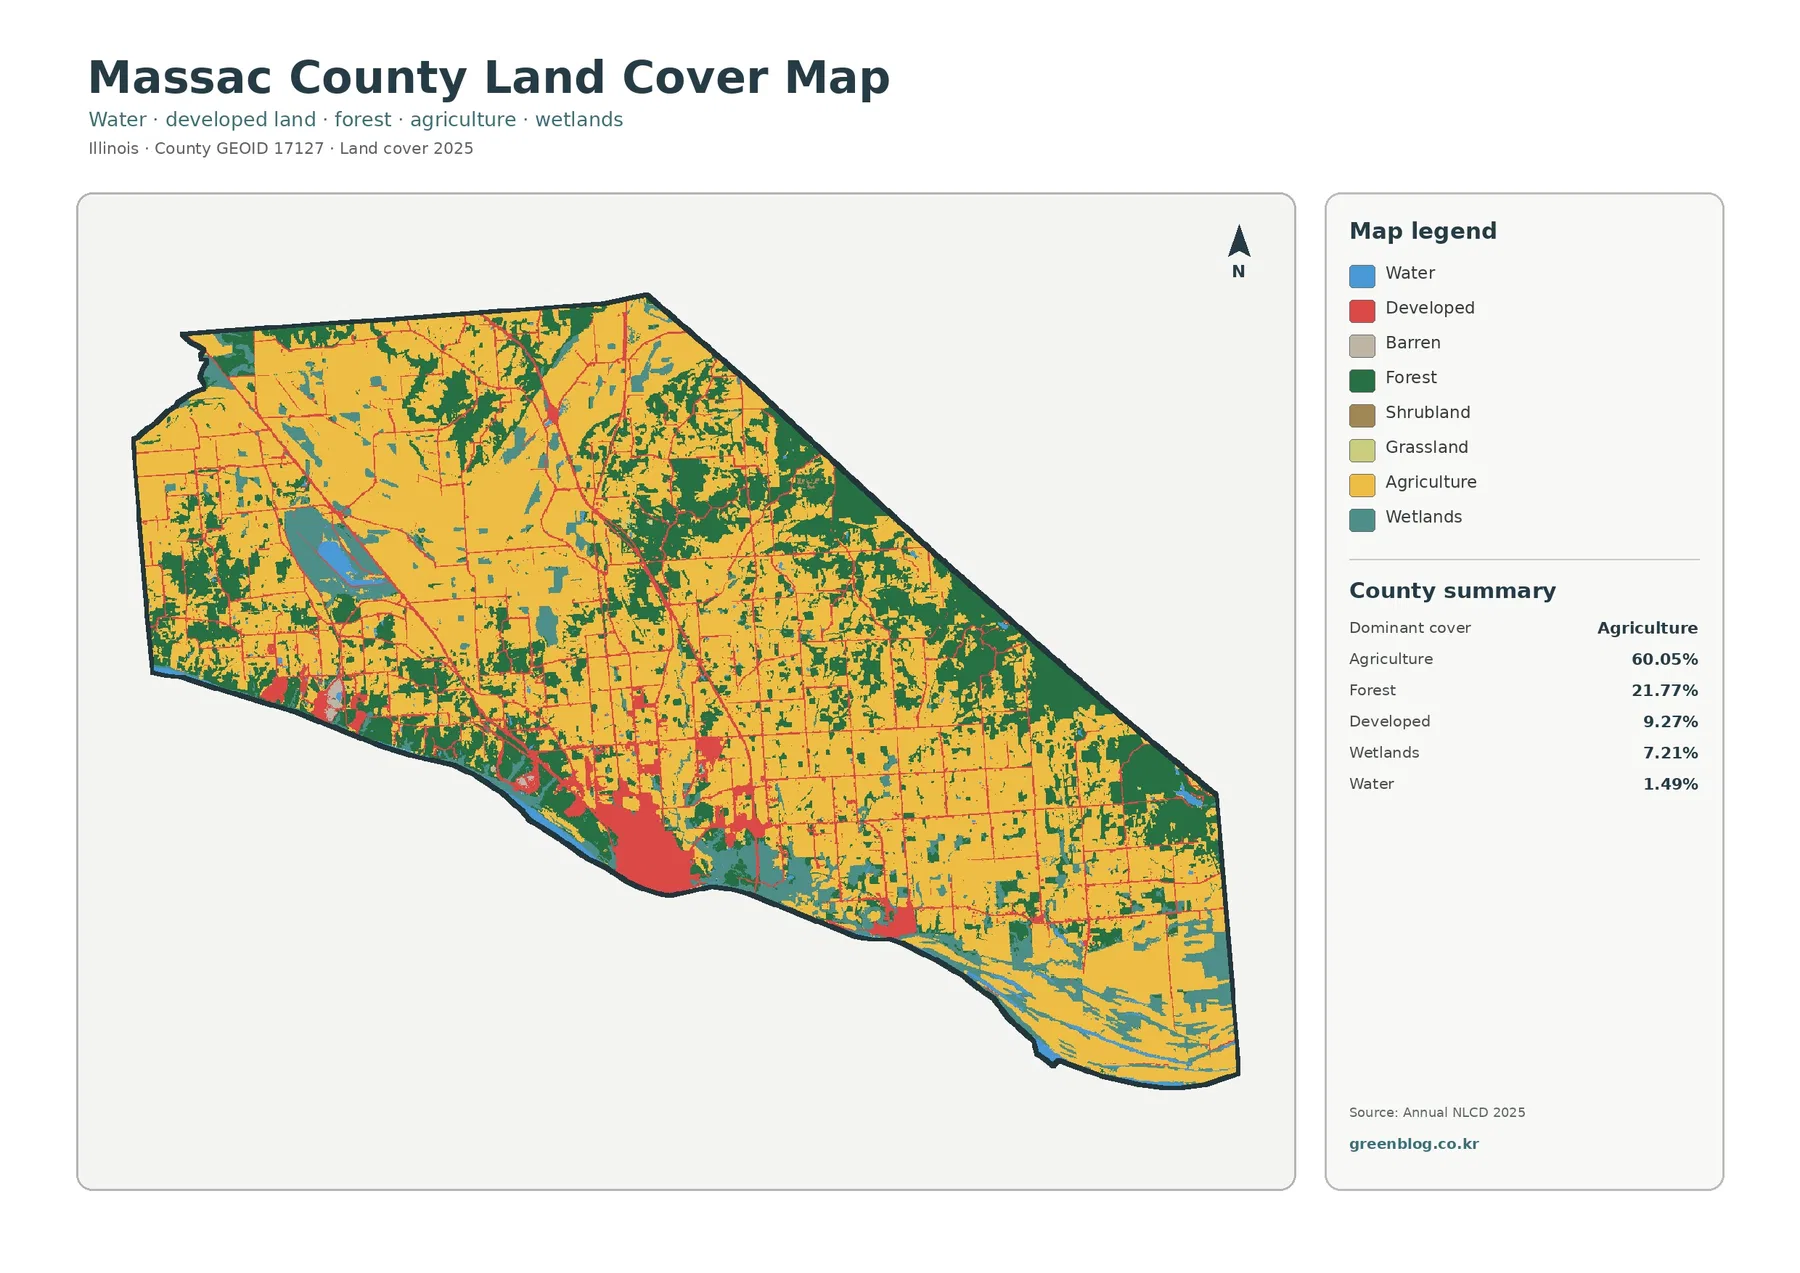
Massac County’s 2025 land-cover map is dominated by agriculture, but the county does not read as one continuous farm landscape. Agriculture accounts for 60.05% of the mapped area, while a broad forested zone stands out along the eastern side and developed land is concentrated much more strongly near the southern edge. Wetlands and smaller water areas break up the farm interior in several places. The four maps on this page separate those patterns into general land cover, forest and farmland, impervious surface, and the 1985–2025 class comparison.
The WebP versions can be viewed on the page, and the four original JPG maps are available together in one ZIP. Use the general map when you need the full mix of current cover classes, the forest-and-farmland version when the rural pattern is the main subject, and the impervious map when hard surfaces such as pavement and rooftops matter. The change map has a different purpose: it marks cells whose representative class differs between 1985 and 2025 rather than simply repeating the 2025 cover percentages.
Table of Contents
An eastern forest belt and a southern built-up edge reshape a county that is 60.05% agricultural
The strongest nonagricultural feature is the wooded eastern side. Dark green forms a large, connected area from the northeast toward the southeast, with irregular edges that meet broad agricultural blocks farther west. Smaller forest patches also occur through the center and north, so the county’s 21.77% forest share is not confined to one isolated corner. Looking only at the 60.05% agriculture figure would miss how strongly the eastern woodland changes the visual balance of the county.
Development has almost the opposite distribution. Red developed cover is most prominent along the southern margin, especially in a large southwestern-to-south-central cluster with smaller developed areas continuing eastward. Farther north, developed pixels appear mainly as thin lines and smaller pockets within agriculture. That concentration helps explain why the 9.27% developed share is visually conspicuous even though it covers far less area than agriculture or forest.
Wetlands account for 7.21%, a notable share compared with the 1.49% mapped as open water. Teal wetland cells occur around the larger western water feature, along parts of the southern margin, and in scattered patches within the farmed interior and southeast. Water and wetlands should not be combined automatically: the map treats them as different classes. Likewise, none of these classes identifies ownership, zoning, parcel boundaries, or whether a site can legally be developed. They describe surface cover, not legal land use.
Simplifying the view reveals how farmland meets 21.77% forest rather than forming one uniform block
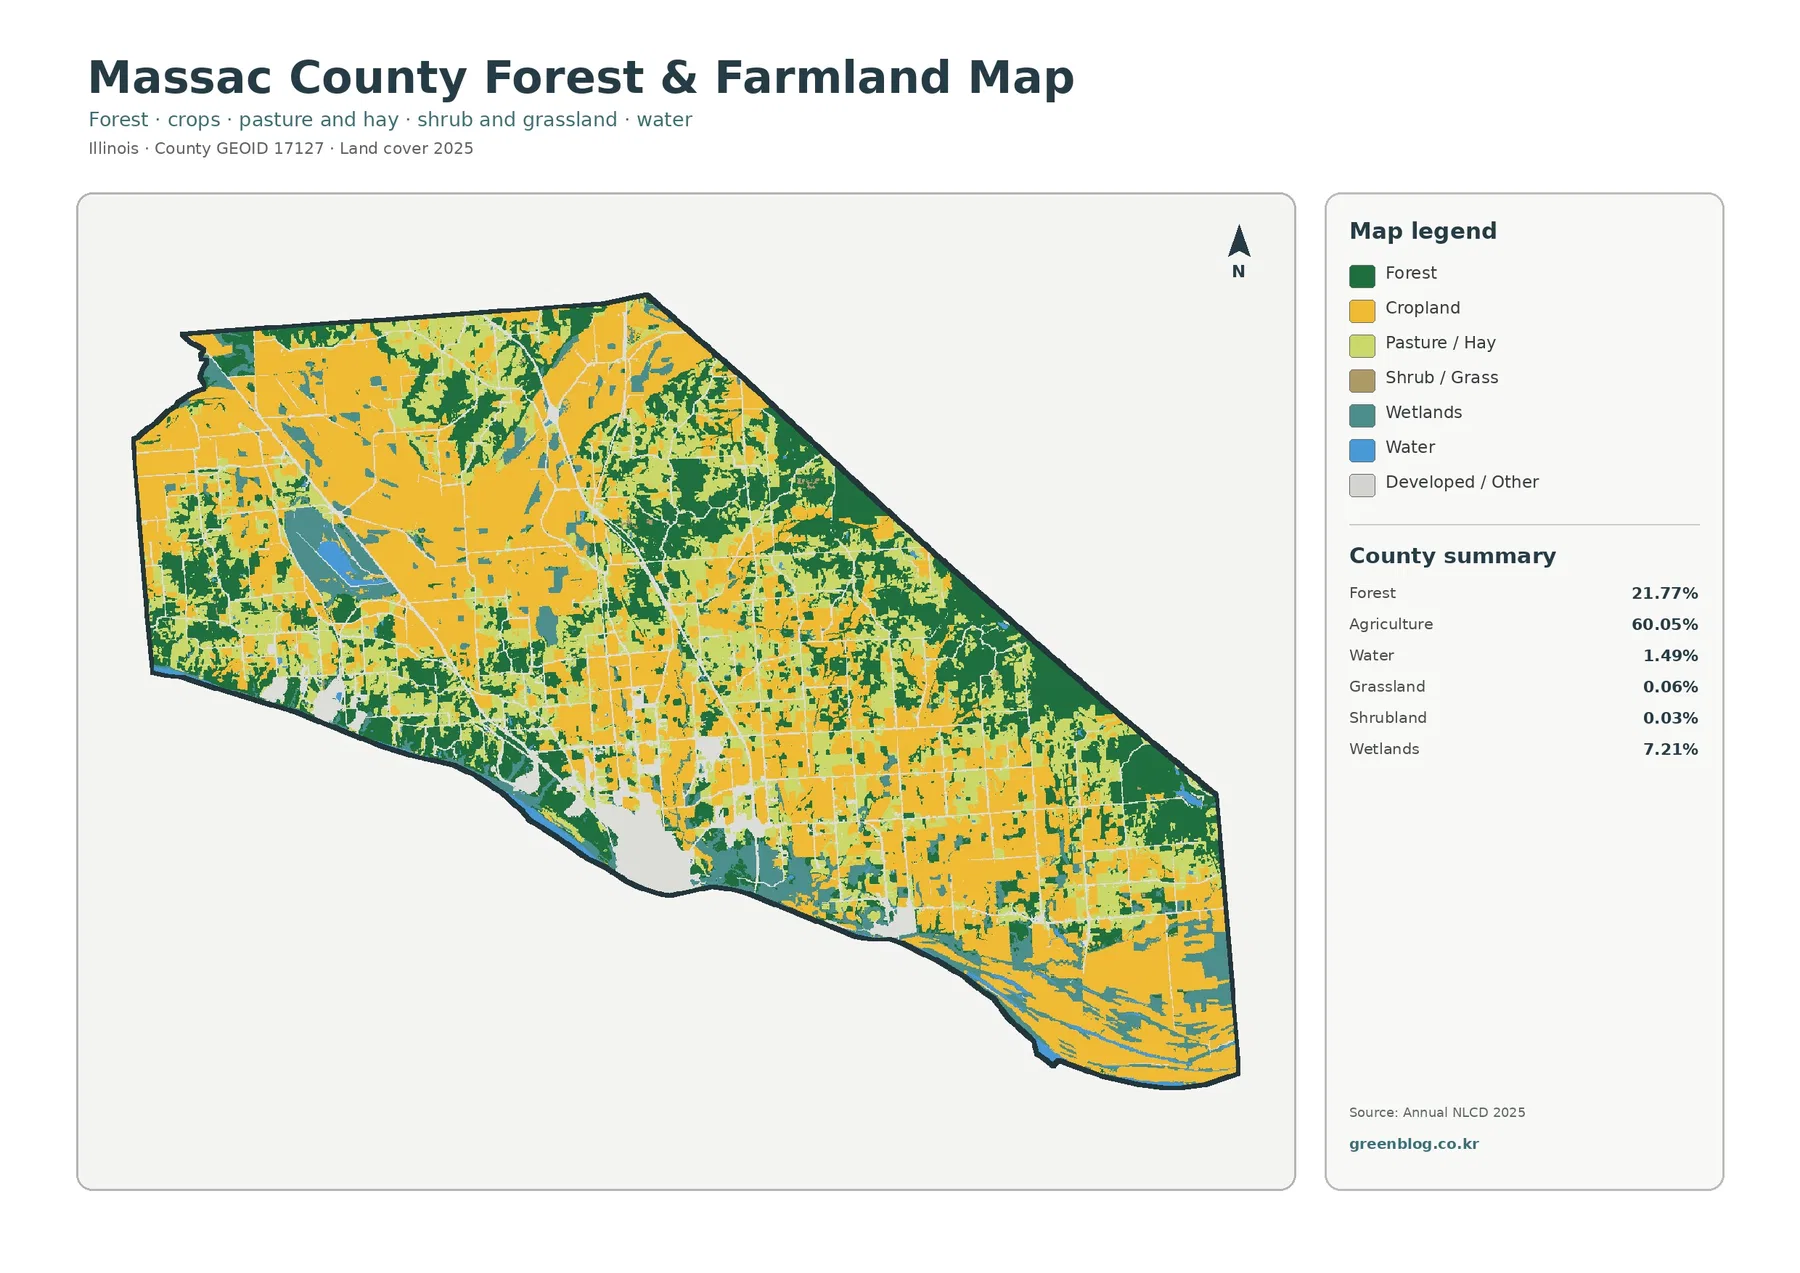
The forest-and-farmland map removes much of the visual competition from developed and other minor classes. With that simplification, the relationship between the yellow farm interior and the green woodland becomes easier to follow. Agriculture forms broad blocks across much of the center, north, and southeast, while the eastern forest remains the largest continuous wooded area. The boundary between those two covers is uneven, with woodland extending westward in several places instead of ending at one straight line.
Smaller forest patches matter as well. North-central and central sections contain distinct green blocks surrounded by agriculture, and additional woodland fragments appear near wetlands in the west and south. Those patches make the 21.77% forest share feel more distributed than a single edge forest would suggest. For classroom comparison or habitat-oriented discussion, this version is useful because it lets a reader distinguish large connected woodland from smaller patches without the developed class dominating the page.
The simplified legend also keeps wetlands and water visible. Agriculture remains 60.05%, forest 21.77%, wetlands 7.21%, and water 1.49%, while grassland is only 0.06% and shrubland 0.03% in the county summary. Those very small percentages do not mean that every grassy or shrubby spot is absent on the ground. Raster classification assigns a representative class to cells, so small surfaces and mixed locations can be generalized into the category that best represents the cell at the mapped scale.
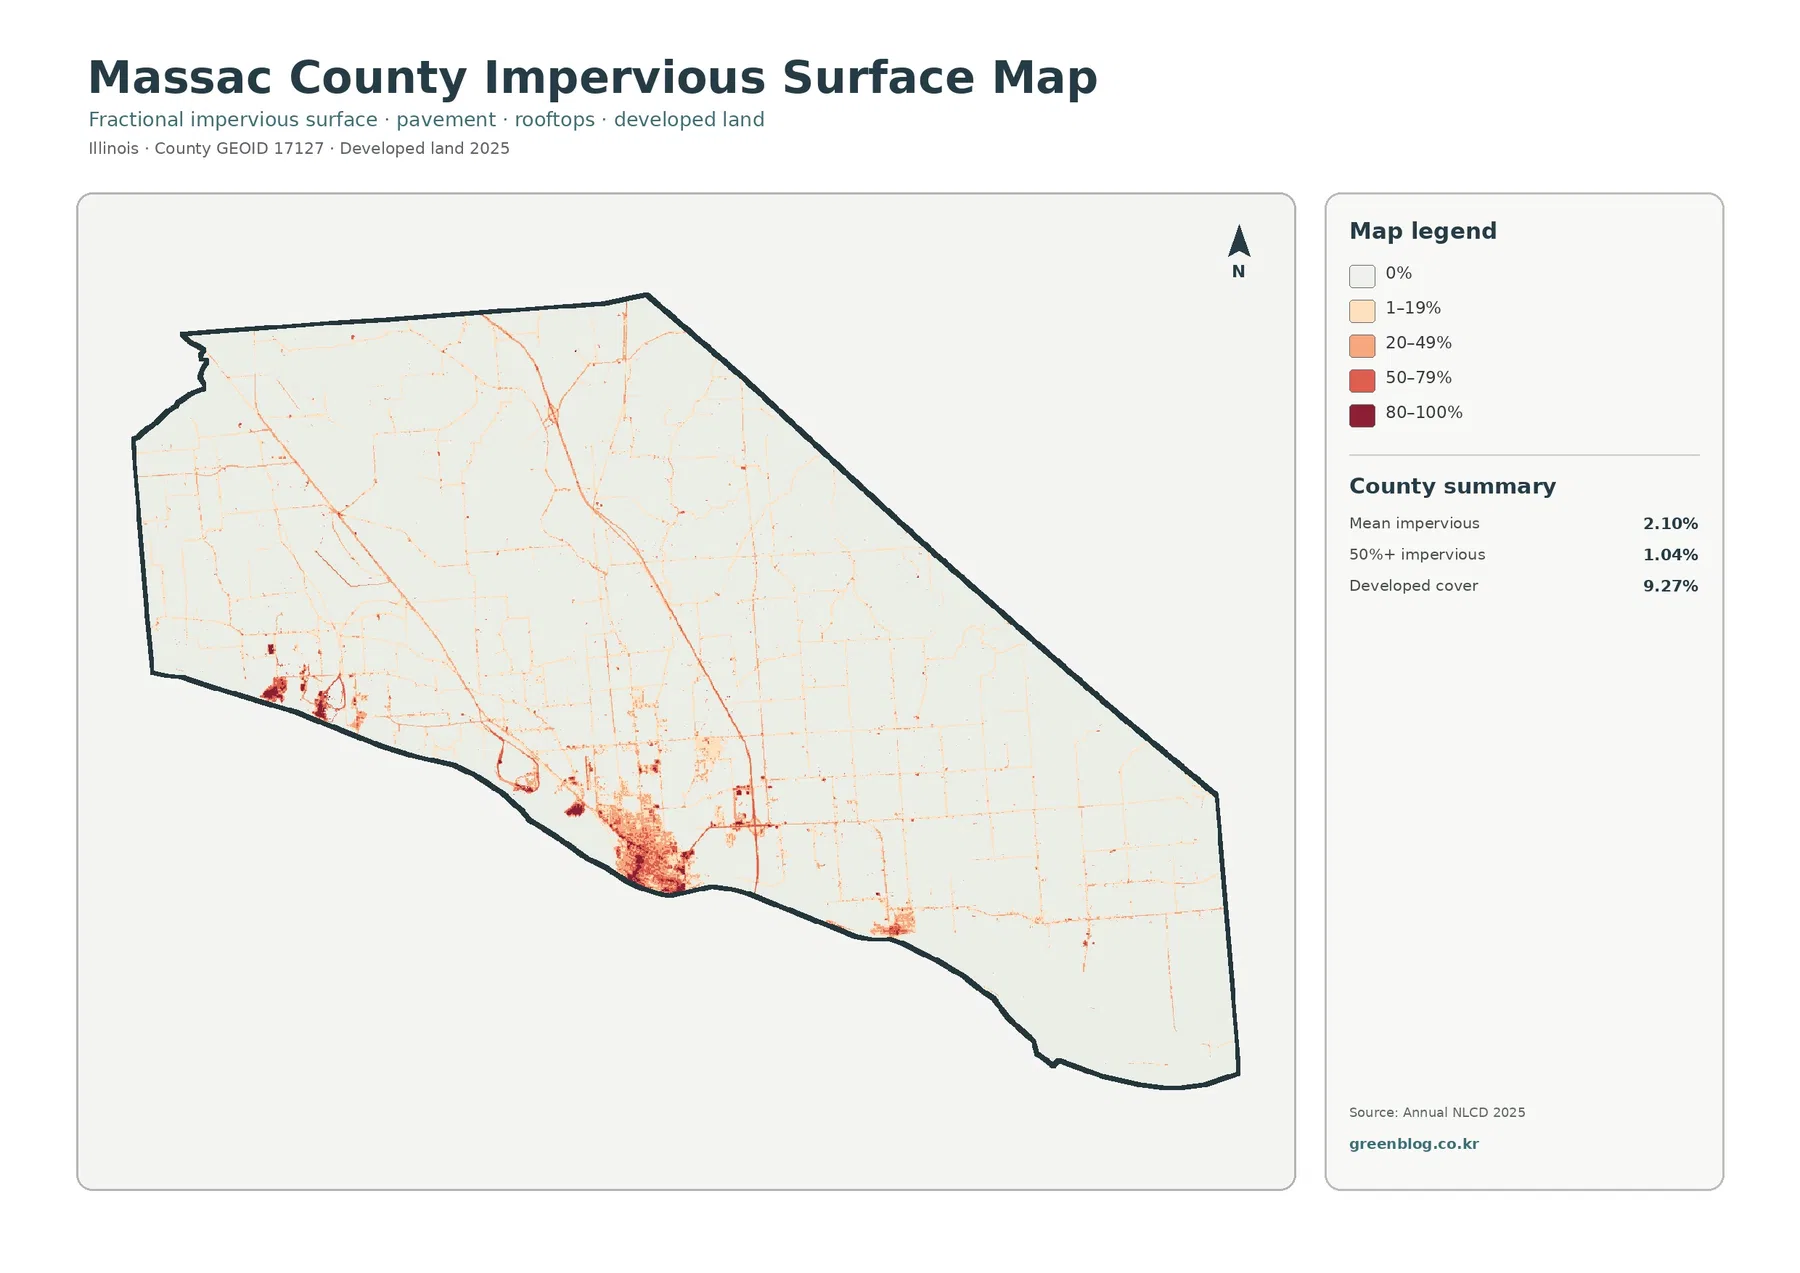
Hard surfaces are concentrated: mean impervious cover is 2.10% even though developed land is 9.27%
Impervious surface means material that sheds water rather than allowing it to soak into the ground, such as rooftops, paved roads, and parking areas. Massac County’s countywide mean is 2.10%, and areas above 50% impervious account for 1.04% of the summary. Those figures are much lower than the 9.27% developed-cover share because developed land can include lawns, trees, bare soil, and other permeable surfaces along with buildings and pavement.
The darkest impervious values are not spread evenly through the county. They gather most strongly in the southwestern and south-central developed clusters seen on the general map. Medium values surround those cores, while thin orange and red lines extend through the agricultural interior in a network-like pattern. Large parts of the north and east remain very light, particularly where agriculture and forest dominate. This makes the distinction between a broad developed class and concentrated hard-surface intensity easy to see.
For a broad stormwater or runoff discussion, this map can help identify where hard surfaces are relatively concentrated before more detailed local data are consulted. It cannot show individual drainage pipes, building footprints, road names, lot grading, or site-specific flood exposure. A cell with a moderate impervious percentage may contain several surface types, and a narrow paved feature can be generalized by the raster grid. Site design or hazard decisions therefore require finer-scale topographic, drainage, and field information.
The 14.76% endpoint difference combines several kinds of change and should not be read as one conversion rate
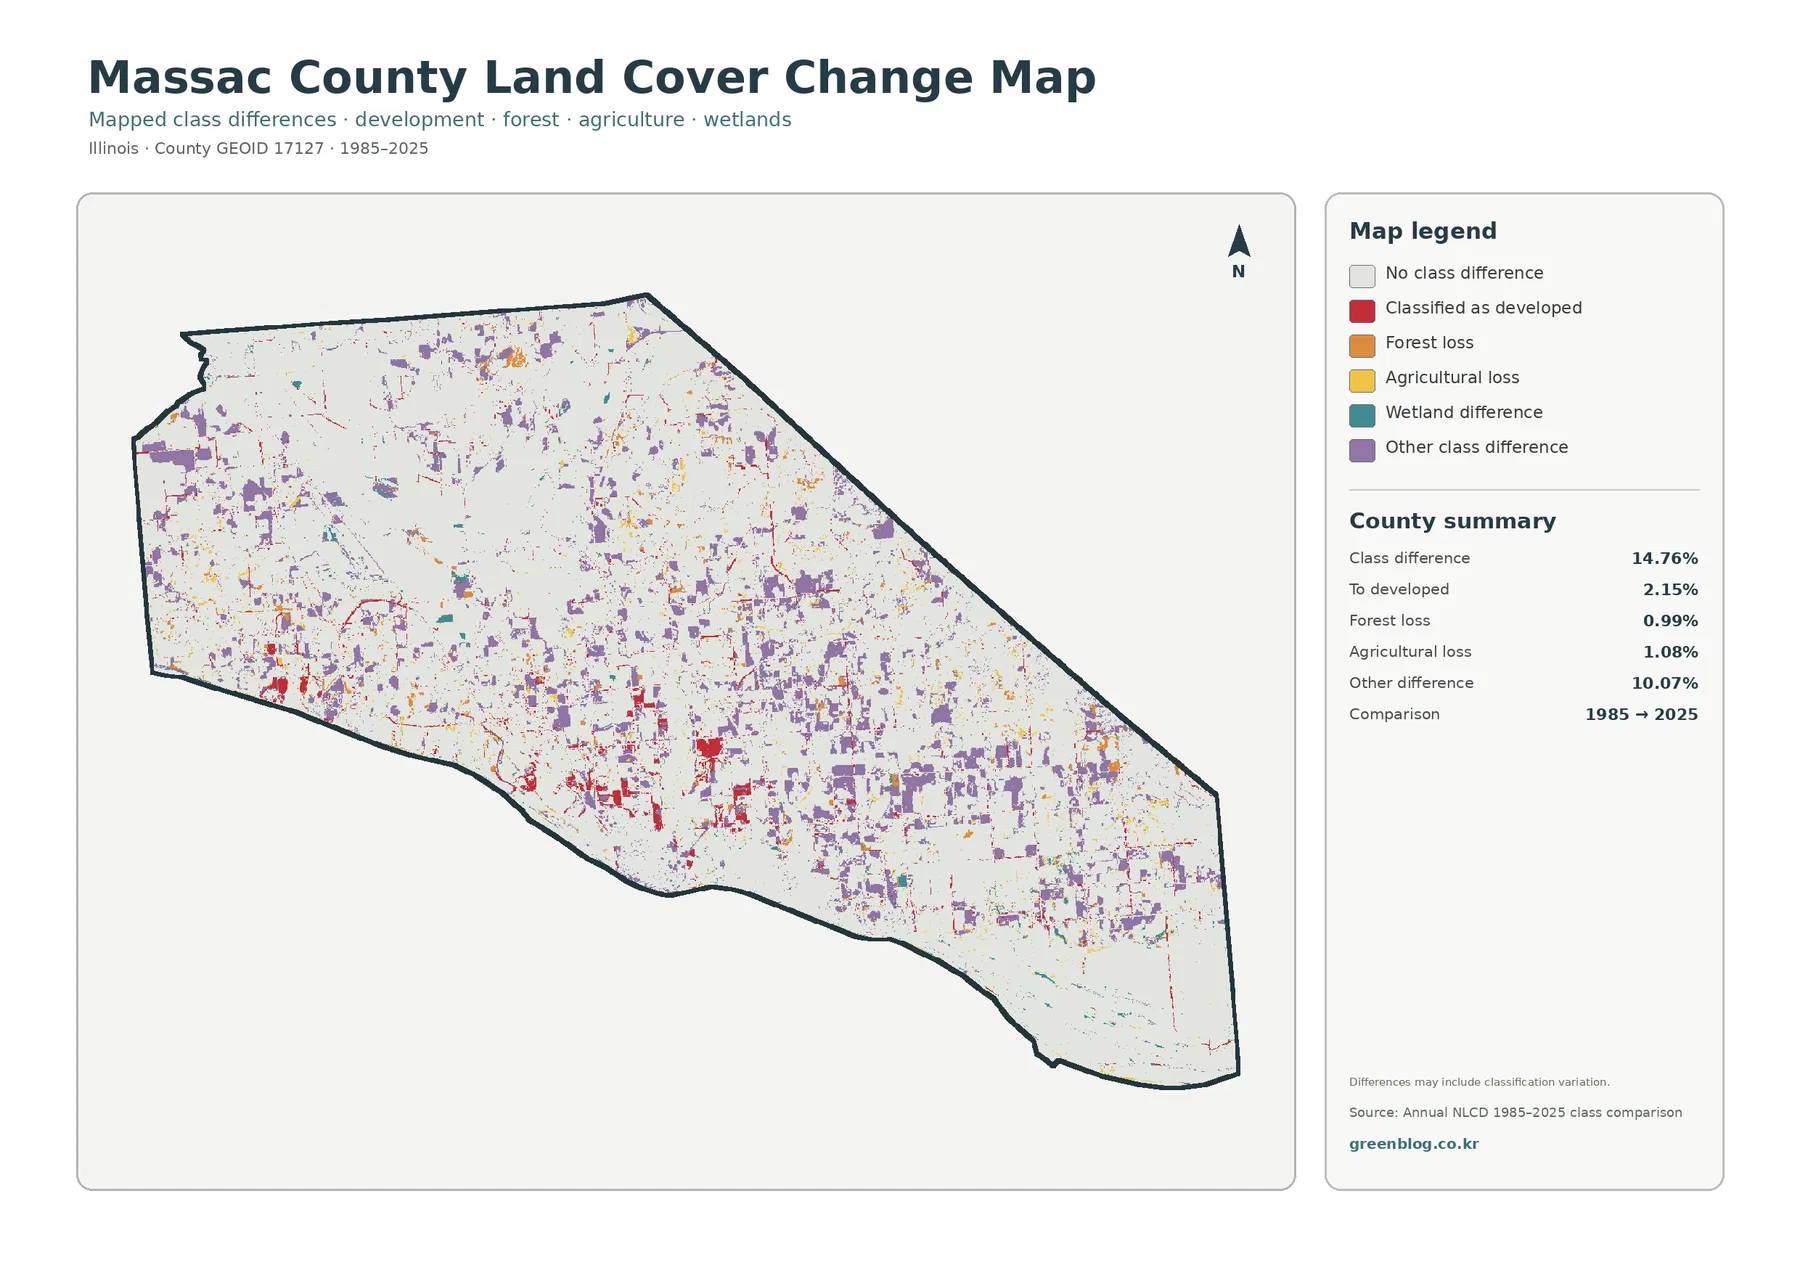
The change map compares representative land-cover classes in 1985 and 2025. Its county summary reports a total class difference of 14.76%. Within that total, 2.15% is categorized as change to developed, 0.99% as forest loss, 1.08% as agricultural loss, and 10.07% as other class difference. Wetland difference also has its own legend category. Because several categories are combined, the 14.76% figure is not a single measure of urban growth, forest clearing, or farmland conversion.
Colored cells occur throughout Massac County, but their mix varies by location. Red change-to-developed cells are more noticeable in parts of the southern developed zone. Purple other-difference cells are widespread through the agricultural interior and along boundaries between major current classes. Smaller yellow, orange, and teal marks are scattered in multiple parts of the county. The map therefore supports a location-by-location comparison better than a simple statement that one type of change dominated everywhere.
The map itself warns that class differences may include classification variation. That is important near boundaries where forest, agriculture, wetlands, water, or developed surfaces meet within the same raster neighborhood. A change in the representative class can reflect a real surface transition, a mixed cell being assigned differently, or other classification effects. The endpoint comparison also cannot reveal every change that occurred between 1985 and 2025 if a location later returned to a similar class. Intermediate imagery and local records are needed to determine timing and cause.
Use the same three reference areas to understand what each map adds
The eastern side is a useful first reference area. On the general map it appears as a broad forested region mixed with some agriculture and wetlands. The forest-and-farmland map makes the woodland continuity and its irregular western edge much easier to see. On the impervious map, most of that same area fades to very low values because the question has shifted from vegetation to hard surfaces. The change map then removes the idea of current cover altogether and highlights only cells whose endpoint classes differ.
The southern developed zone works in the opposite direction. General land cover identifies the full developed class, including places that may still contain permeable ground. The impervious map narrows attention to where rooftops, pavement, and other hard surfaces make up a larger share of a cell. The 1985–2025 view does not color every present-day developed cell red; it marks only locations categorized as a class difference to developed between the two endpoints. That distinction prevents current development from being mistaken for documented historical conversion.
A western water-and-wetland area provides a third comparison. Blue water and teal wetlands are distinct on the present-day maps, while nearby agriculture and forest show how those natural covers meet the rural interior. On the impervious map, the water setting itself is no longer the subject, and only nearby hard-surface intensity remains relevant. On the change map, any colored cell needs to be read against the legend before a conclusion is made. A visible difference near water does not by itself prove wetland loss, shoreline movement, or a particular cause.
The maps are useful for comparison and communication, but they remain generalized land-cover products
For teaching or presentations, the general map gives the clearest opening view because all major classes share one legend. A second slide can use the forest-and-farmland map to focus on the contrast between the eastern woodland and the farmed interior. Environmental comparisons can use the 7.21% wetland share and 21.77% forest share as countywide context while still pointing to where those covers occur. The impervious map is particularly useful for explaining why developed land and hard-surface percentage are related but not interchangeable measurements.
The change map is best used as a screening and comparison layer rather than proof of a specific land-use event. It identifies where the two supplied endpoint classifications differ, not why they differ. If a project needs to document the history of one location, the next step should be intermediate-year imagery, aerial photographs, planning documents, or other site records. Legal wetland status, parcel ownership, zoning, permits, and property boundaries also require the appropriate official records rather than a land-cover raster.
Scale is another limitation to keep visible. Raster cells summarize the surface within a grid, so narrow features and mixed landscapes can be simplified. A field edge, small woodland strip, wet depression, road, and developed yard may all occur close together even when one class represents the cell. The maps are strong for countywide pattern recognition because every location is classified consistently, but they are not substitutes for a parcel survey or field inspection.
Keep the four original JPGs together, then select the one that matches the question
For a single overview image, the general JPG is the most complete choice because it places agriculture, forest, developed land, wetlands, and water in the same frame. Choose the forest-and-farmland JPG when the rural landscape is the subject, the impervious JPG when hard-surface concentration matters, and the 1985–2025 image when the topic is endpoint class difference. Keeping the files together also makes it easier to compare the same part of the county without confusing one map’s legend with another.
The asset manifest lists each original JPG at 2480×1754 pixels. The package does not mark these files as meeting its A3 high-resolution reference, so large-format printing should be tested before the images are used for final display work. For on-screen comparison, ordinary print reference, classroom use, and presentations, retain each legend and date label. Those elements are essential because the first three maps describe 2025 conditions while the fourth compares 1985 with 2025.
Frequently Asked Questions
Why does the eastern side look heavily wooded if agriculture covers 60.05% of Massac County?
Agriculture is the largest countywide class, but it is not evenly distributed. Broad farm blocks occupy much of the center and north, while a large connected forest zone covers much of the eastern side. Forest is 21.77% countywide, so its share is smaller than agriculture, yet its concentration in one broad area makes it visually prominent. Countywide percentage and spatial concentration need to be read together.
Why is developed cover 9.27% while mean impervious surface is only 2.10%?
They measure different things. Developed land is a land-cover class that can include buildings, pavement, lawns, trees, soil, and other surfaces within a developed setting. Impervious surface estimates the fraction of a cell covered by hard material such as rooftops and pavement. Because developed areas can contain substantial permeable ground, the developed-cover percentage can be much higher than the countywide mean impervious value.
Does the 14.76% 1985–2025 class difference equal the amount of land that was permanently converted?
No. The 14.76% total combines change to developed, forest loss, agricultural loss, wetland difference, and other class difference. The map also notes that classification variation may contribute to some differences. It does not provide the exact timing, permanence, or cause of each change. Those questions require intermediate imagery, aerial photographs, local records, or other site-specific evidence.
Sources and Reference Data
The 2025 land-cover percentages, impervious summary, and 1985–2025 class-difference values discussed here come from the supplied Massac County maps and legends. The official resources below provide background on Annual NLCD data, land-cover classification, and U.S. county boundary data. Because each source has its own purpose and definitions, use them as complementary references rather than combining unrelated measurements into one statistic.
- MRLC Annual NLCD Data – official Annual NLCD data access and product information
- USGS Annual NLCD Land Cover Classification – definitions and guidance for land-cover classes
- U.S. Census Bureau TIGER/Line Shapefiles – official geographic boundary data and documentation
Map File Information
The ZIP contains four original JPG maps for Massac County, Illinois: general land cover, forest and farmland, impervious surface and developed land, and the 1985–2025 land-cover class comparison.
- Included Versions: Land cover / forest and farmland / impervious and developed land / land-cover change
- File Type: ZIP containing four JPG maps
Related Maps
- Adams County Illinois Land Cover Map
- Alexander County Illinois Land Cover Map
- Bond County Illinois Land Cover Map
Green Map creates custom-edited map images using open geographic data sources such as geoBoundaries, Natural Earth, OpenStreetMap, and government open data. These maps are edited visual materials, not raw data files, and are provided for education, documents, presentations, and graphic reference.