Mason County looks like a farm county at first glance, and the 2025 summary confirms that impression: agriculture covers 75.00% of the mapped area. The picture changes sharply near the western edge, where broad water, wetlands, and woodland follow the Illinois River side of the county. Four map views on this page separate those patterns into present land cover, forest and farmland, impervious surface, and a 1985–2025 class comparison.
The four original JPG maps are available together in one download, while the WebP versions below make it easy to compare them on screen. For the full 2025 mix, start with the general map; the forest-and-farmland view is cleaner for rural comparison, the impervious layer isolates hard-surface intensity, and the change map is reserved for the two supplied dates. Land cover describes what is physically covering the ground; it does not establish zoning, ownership, parcel boundaries, permitted use, or development rights.
Table of Contents
One county, two strong visual settings: farm interior and river margin
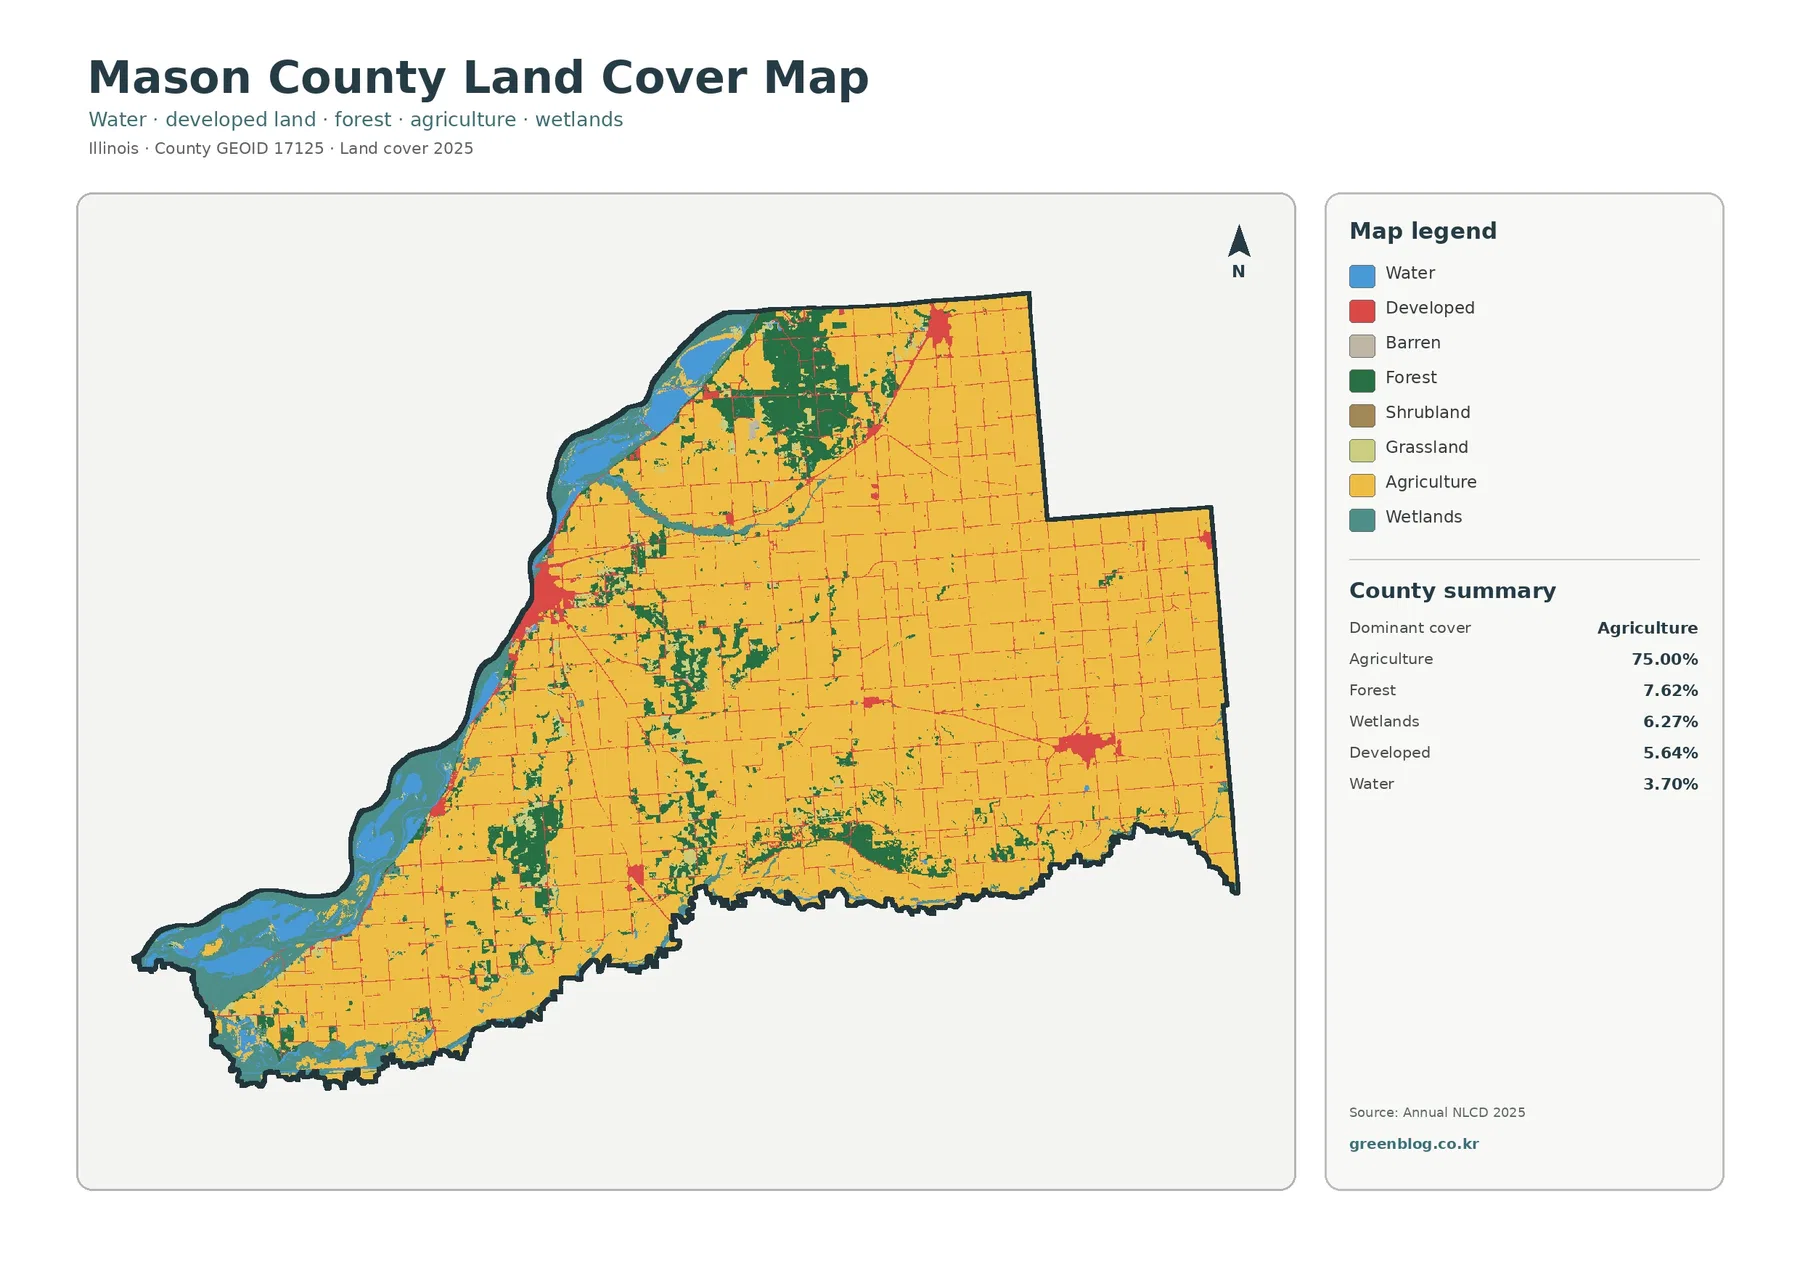
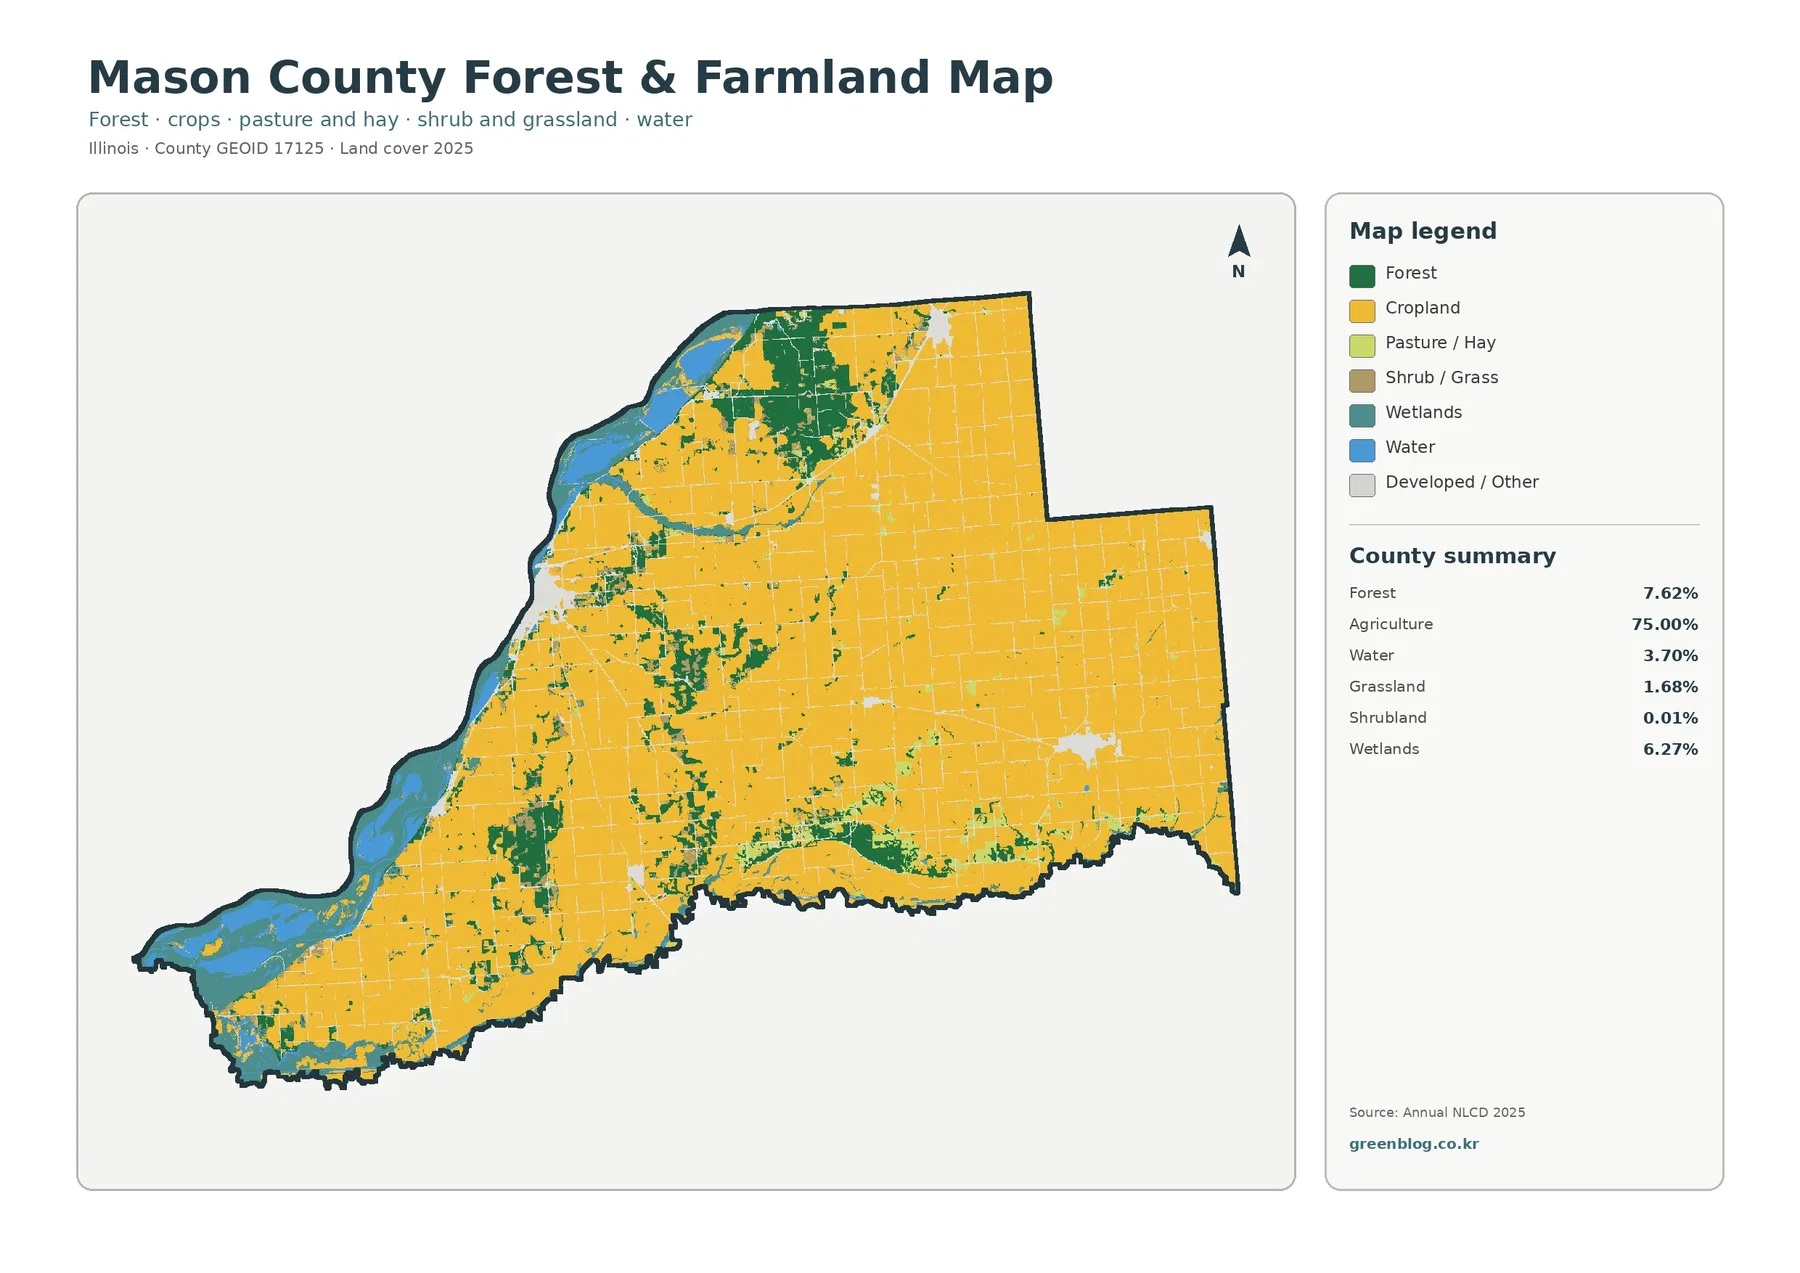
Agriculture dominates the county summary at 75.00%, followed by forest at 7.62%, wetlands at 6.27%, developed land at 5.64%, and water at 3.70%. Those percentages do not spread evenly across the outline. Large agricultural blocks cover most of the center and east, producing a broad yellow field pattern. Along the west, blue water opens into much larger shapes and is bordered by teal wetlands and dark-green forest. The contrast is especially clear in the northwest and southwest, where natural cover occupies a much wider band than it does across the interior.
Woodland also breaks up the agricultural background away from the main river edge. A large forest concentration sits in the northwestern part of the county, while smaller green patches and branching strips appear through the center and south. Wetland cover is not confined to one isolated patch either; much of it lies near the western water system, with additional narrow pieces elsewhere. This arrangement is why a county that is three-quarters agricultural can still show a visually prominent river-and-wetland landscape.
The developed class behaves differently from the natural cover. It appears as compact clusters and thin lines instead of a continuous belt. The strongest western cluster corresponds to the Havana area: Mason County places its courthouse in Havana, and the city describes itself as being on the east bank of the Illinois River. Other built clusters sit farther north and east within the agricultural interior. Because the supplied map does not label streets or every settlement, the safest reading is to use the larger clusters as geographic reference points without assigning every red cell to a named facility.
Hard surfaces stay compact even where the developed class is larger
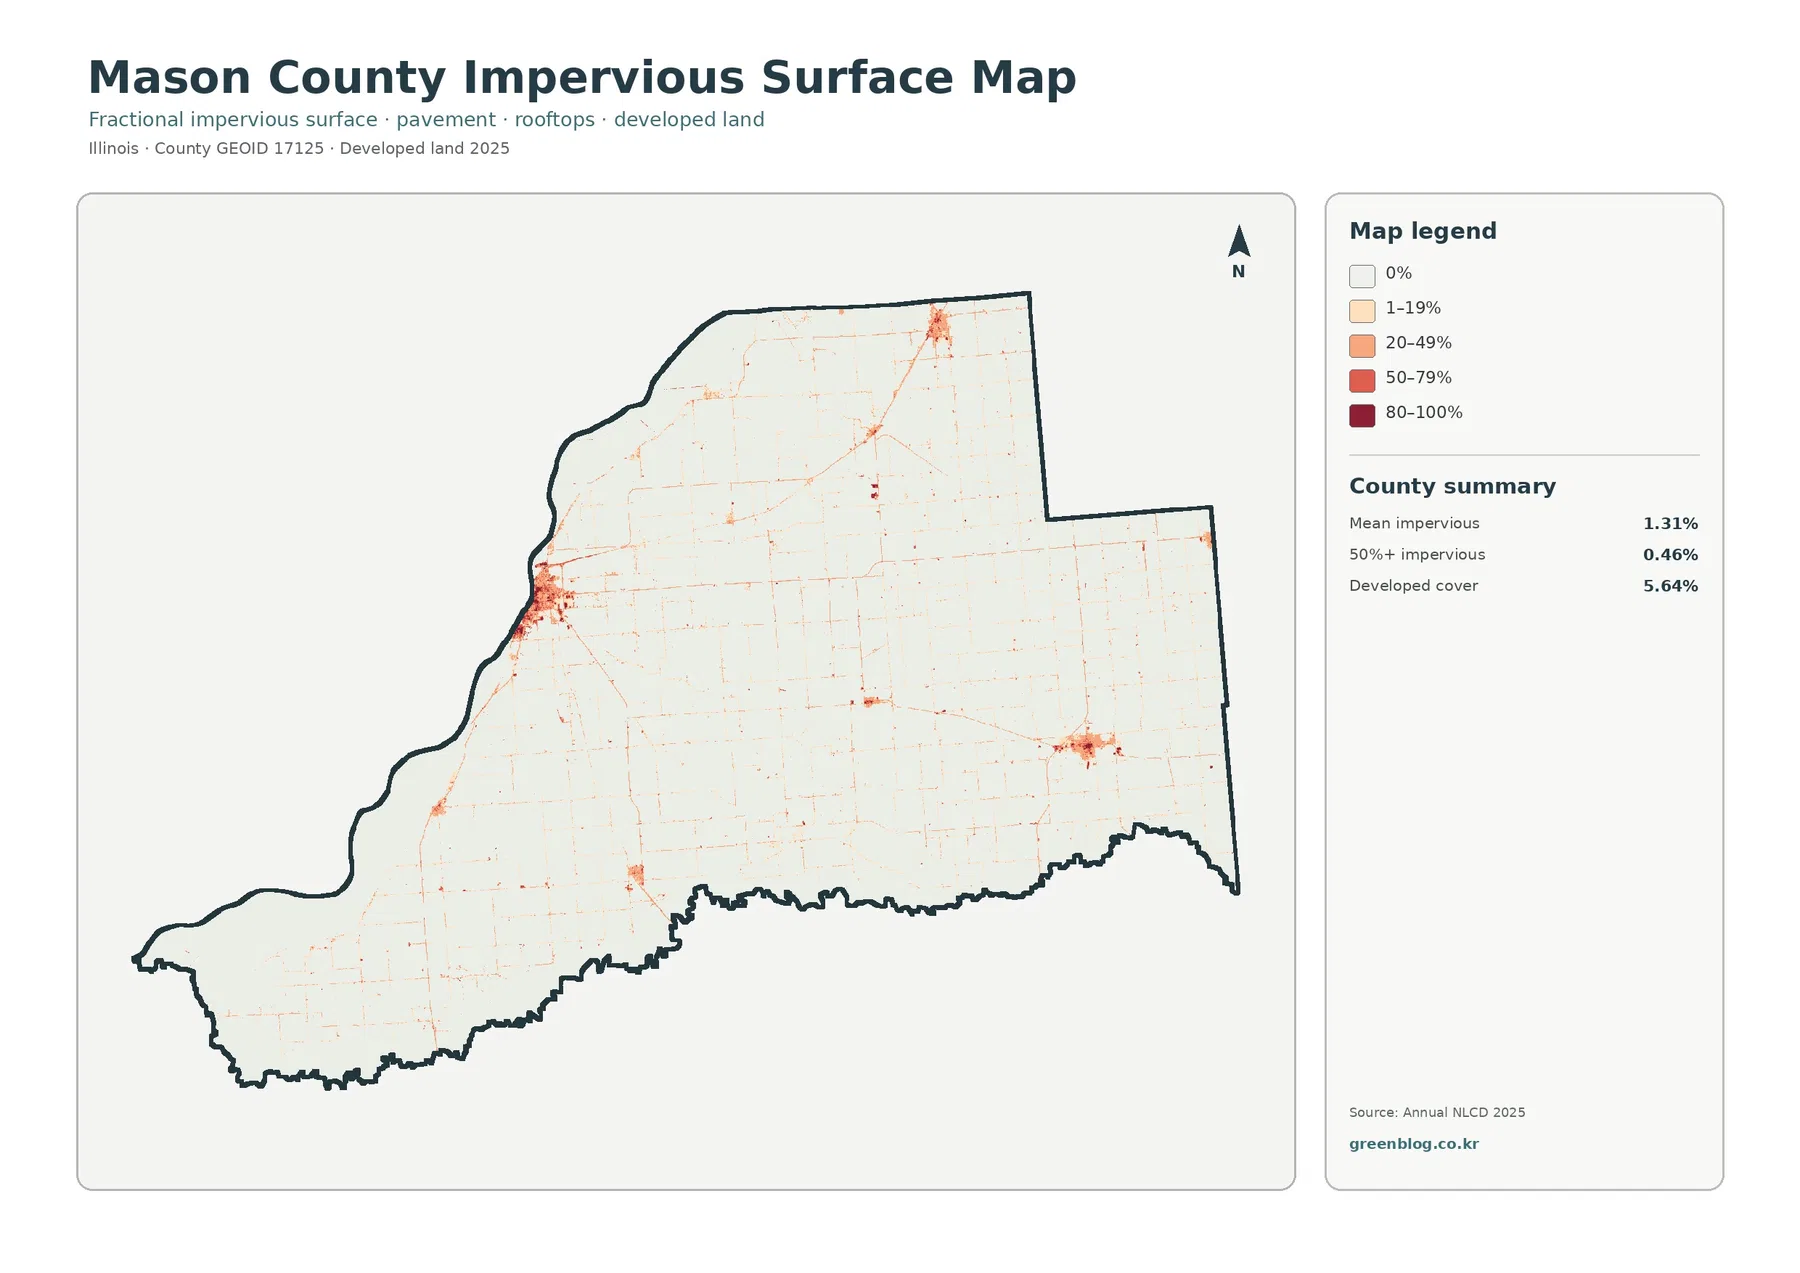
Impervious surface means roofs, pavement, parking areas, and other hard surfaces that do not readily absorb rainfall. The countywide mean impervious value is 1.31%, and only 0.46% of the county is mapped above 50% impervious. Both figures are much smaller than the 5.64% developed-cover share. That difference is expected because a developed land-cover class can include lawns, trees, bare soil, and other permeable areas around buildings and roads. Developed cover should therefore not be treated as a direct measurement of pavement.
The western urban cluster stands out most strongly, with several darker cells packed close to the river margin. Separate concentrations are visible in the north and east-central part of the county. Between them, a fine network of pale orange lines crosses otherwise light agricultural ground. These narrow traces resemble the spatial pattern of roads and other built surfaces, but the package does not provide road labels, so the map should not be used to name or measure individual routes. Its value is in showing where hard surfaces cluster and where they remain sparse.
Havana makes a useful example because official city information places it directly along the Illinois River. Comparing the impervious image with the general land-cover image shows how a compact developed area can sit beside water and wetlands without making the entire river edge highly impervious. That distinction matters for broad stormwater or environmental context. A county-scale impervious map can identify places worth examining more closely, but drainage design, flood analysis, and site engineering require finer elevation, infrastructure, and field information.
Removing most town detail exposes the shape of the river-side woodland
The forest-and-farmland view simplifies the county enough that the rural pattern becomes easier to read. Cropland-colored areas fill most of the center and east, while the largest forest blocks remain concentrated toward the northwest and along portions of the western river environment. Smaller woodland pieces extend through the central and southern farm country. Water and wetlands remain visible, so the green forest can be read in relation to the blue and teal river-edge classes rather than as an isolated percentage.
Forest accounts for 7.62% of the county, but it is visually stronger than that number might suggest because some patches are broad and connected. Grassland is listed at 1.68% and shrubland at only 0.01%, so they play a much smaller role in the overall pattern. Wetlands at 6.27% and water at 3.70% are more important along the western side. The result is not a simple checkerboard of farm and forest; it is a large agricultural interior meeting a river landscape with a more varied mix of cover classes.
A USDA county profile provides useful agricultural context without measuring the same thing as the land-cover map. The 2022 Census of Agriculture reported 588 farms in Mason County, 324,668 acres of land in farms, and 289,571 acres of cropland. It also reported that crops made up 95% of agricultural sales. Those figures describe farm operations and land in farms in 2022, whereas the 75.00% figure here is a 2025 satellite-based land-cover class. The sources point in the same broad direction—agriculture is important—but their numbers should not be substituted for one another.
The 1985–2025 difference is 6.42%, but it is not one continuous conversion zone
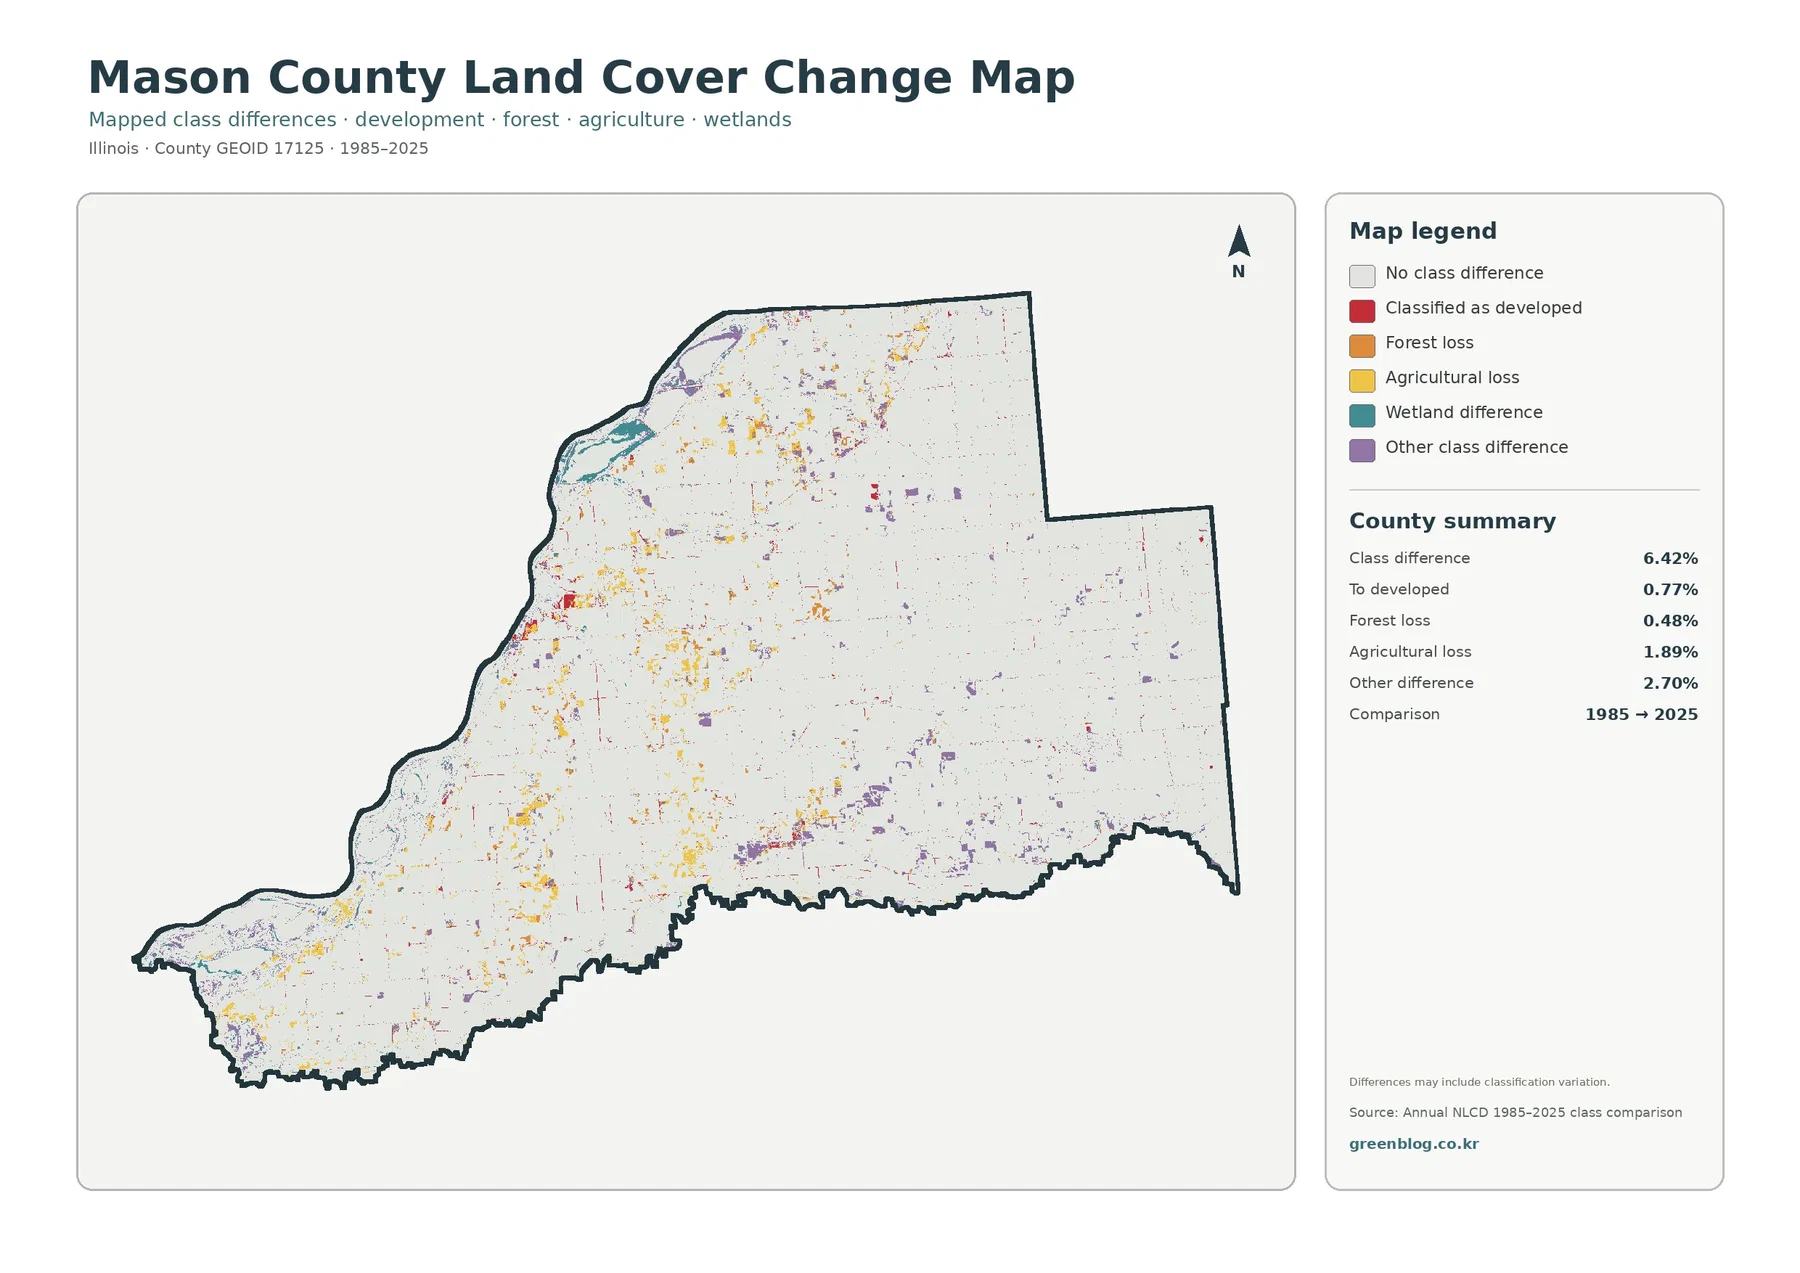
The change image compares the dominant mapped class in 1985 with the dominant class in 2025. The total class difference for Mason County is 6.42%. Within that summary, agricultural loss is 1.89%, change to developed is 0.77%, forest loss is 0.48%, and other class difference is 2.70%. Wetland difference is also represented as its own legend category. These categories are not interchangeable, so the total 6.42% should not be described as urban growth, farmland conversion, or forest removal.
Colored cells are scattered across the county rather than forming a single broad front. The western half, especially the river margin and the southwest, contains many small differences of several colors. Additional patches appear through the south-central area and north, while much of the eastern agricultural interior remains a pale background with smaller isolated changes. Red cells near present built clusters are easy to notice, but they represent only the supplied change-to-developed category between the two endpoints, not the full present-day developed footprint.
The map includes an important warning that class differences can contain classification variation. A 30-meter cell near a shoreline can contain water, wet ground, trees, field edge, and a road at the same time. Changes in imagery or the dominant class assigned to that mixed cell can create a mapped difference even when the physical change is subtle. The opposite problem also exists: a site that changed during an intermediate year and later returned to a similar class may not stand out in a simple 1985-versus-2025 comparison.
Reading the same location across four maps prevents four different measurements from being mixed
The Illinois River side is the best place to cross-check the set. On the general map, water, wetlands, forest, agriculture, and developed land share the same view. The forest-and-farmland image reduces the visual weight of development and makes the green margins around water easier to follow. The impervious image removes most natural-cover color and leaves only the harder built surfaces. The change image then asks a different question entirely: which cells received a different dominant class in 1985 and 2025?
The eastern farm interior offers a second useful test. A large yellow area on the general map does not become a large colored area on the impervious or change map. Instead, the hard-surface layer is mostly pale except for roads and compact settlements, while the change layer selects only scattered cells that differ between endpoints. This comparison makes clear why 75.00% agriculture, 1.31% mean impervious surface, and 6.42% class difference cannot be treated as parts of one pie chart.
For a presentation or lesson, start with the question instead of choosing a map by appearance. Choose the general 2025 map when the goal is to describe the county’s full surface mix. Choose the forest-and-farmland version when field and woodland boundaries matter most. The impervious layer works best for the concentration of hard surfaces, while the change image should be reserved for comparing the 1985 and 2025 endpoints. Keeping each legend attached to its map is a simple way to prevent a percentage from being carried into the wrong interpretation.
Thirty-meter cells simplify narrow river edges, roads, and small land-cover patches
Annual NLCD land cover is raster data, meaning the landscape is represented as a grid rather than as surveyed parcel polygons. Under the supplied interpretation rules, the land-cover classes are generalized at 30 meters. One cell may contain a field margin, trees, pavement, water, and wet ground. The map assigns a representative class to that cell, so a thin forest strip or wetland edge can appear wider, narrower, interrupted, or shifted compared with what a person would see on the ground.
Mason County’s western margin deserves extra caution because several classes meet over short distances. Water grades into wetland, woodland sits beside agricultural ground, and developed surfaces appear near the Havana riverfront. A few cells can change the apparent shape of those boundaries. The green and teal edges on these maps are not legal wetland delineations, property lines, or conservation boundaries. They are useful for consistent county-scale comparison, not for determining the status of an individual parcel.
Date limits matter as much as spatial resolution. The general land-cover, forest-and-farmland, and impervious views in this set are labeled 2025. The historical comparison uses 1985 and 2025 endpoints. Nothing that happened after 2025 can appear here, and the change image does not describe the full sequence of intermediate years. Current permitting, site selection, engineering, or habitat decisions should therefore be checked against newer imagery and the appropriate local records.
Land cover should also stay separate from land use. An agricultural cell does not name a crop, a farmer, or a legal farm parcel. A developed cell does not identify residential, commercial, industrial, or public use. Forest does not establish ownership or public access, and a wetland class does not replace a regulatory delineation. The strength of this map set is that it applies a consistent surface classification across the entire county, making broad geographic contrasts visible without claiming parcel-level authority.
Keep the four JPGs as a set, then choose the one that answers the specific question
The general JPG is the best single file for describing present-day land cover because it places agriculture, forest, wetlands, developed land, and water in one legend. The forest-and-farmland JPG is cleaner when the main subject is the rural boundary between fields, woodland, and the river environment. Impervious surface is the better choice for showing compact built intensity, while the 1985–2025 image should be used only for the supplied endpoint comparison.
The asset manifest lists each original JPG at 2480×1754 pixels. It does not mark those files as meeting the package’s A3 high-resolution reference, so large-format printing should be tested before the maps are used as final display graphics. For screen comparison, ordinary print reference, presentations, and classroom work, keeping the legends and date labels with each image preserves the distinctions among present cover, hard-surface intensity, and historical class difference.
Frequently Asked Questions
Why does the western side look so different if agriculture covers 75.00% of Mason County?
Agriculture is the largest countywide class, but it is not distributed uniformly. The center and east contain broad agricultural blocks, while the Illinois River side concentrates much of the mapped water, wetlands, and forest. Water is 3.70%, wetlands 6.27%, and forest 7.62%. Those smaller shares become visually prominent because they occur together in broad connected areas along the western margin rather than being evenly scattered through the county.
Why is developed cover 5.64% when mean impervious surface is only 1.31%?
The measurements describe different things. Developed land is a land-cover category that can contain buildings, roads, lawns, trees, and bare ground. Impervious surface estimates the share of hard material such as pavement and rooftops within cells. A developed area can therefore include substantial permeable ground. That is why the developed-cover share can be several times larger than the countywide mean impervious value.
Does the 6.42% 1985–2025 class difference equal the amount of land that was converted?
No. The 6.42% total combines several mapped categories, including agricultural loss, change to developed, forest loss, wetland difference, and other class difference. The change map also warns that classification variation can contribute to some differences, especially where mixed surfaces meet within a raster cell. Determining actual conversion acreage, timing, or cause requires additional imagery, local records, and more detailed site information.
Sources and Reference Data
The 2025 land-cover percentages, impervious summary, and 1985–2025 class-difference values discussed above come from the supplied Mason County maps and legends. The official resources below provide background on Annual NLCD classification, county agriculture, and the local setting around Havana. Because the sources measure different subjects and years, their statistics should be used for context rather than merged into one land-cover calculation.
- MRLC Annual NLCD Data – official Annual NLCD data access and product information
- USGS Annual NLCD Land Cover Classification – definitions and guidance for land-cover classes
- USDA 2022 Census of Agriculture – Mason County Profile – farms, cropland, land in farms, and agricultural sales context
- Mason County, Illinois official website – county government and courthouse information
- City of Havana – Our City – local information describing Havana’s location along the Illinois River
Map File Information
The ZIP contains four original JPG maps for Mason County, Illinois: general land cover, forest and farmland, impervious surface and developed land, and the 1985–2025 land-cover class comparison.
- Included Versions: Land cover / forest and farmland / impervious and developed land / land-cover change
- File Type: ZIP containing four JPG maps
Related Maps
- Adams County Illinois Land Cover Map
- Alexander County Illinois Land Cover Map
- Bond County Illinois Land Cover Map
Green Map creates custom-edited map images using open geographic data sources such as geoBoundaries, Natural Earth, OpenStreetMap, and government open data.
These maps are edited visual materials, not raw data files, and are provided for education, documents, presentations, and graphic reference.