Lawrence County, Illinois is overwhelmingly agricultural in the 2025 land-cover summary, but its farm pattern is broken by wooded river bottoms, wetlands, water, and the developed area around Lawrenceville. Agriculture covers 72.44% of the mapped county, while forest accounts for 12.12%, developed cover 8.44%, wetlands 5.77%, and water 1.07%. Those smaller classes matter because they cluster in recognizable places rather than being spread evenly across the county.
Four matched map views are provided on this page: current land cover, forest and farmland, impervious surface with developed land, and mapped class differences from 1985 to 2025. The four original JPG files are also available together in one ZIP download. Keeping the same county outline across the set makes side-by-side comparison straightforward for classroom work, presentations, environmental context, or a county profile.
Table of Contents
Cropland dominates until the Embarras and Wabash river bottoms break the pattern
Broad agricultural blocks fill most of the north, south, and outer portions of Lawrence County. Near the center and toward the eastern boundary, that uniform field pattern gives way to a mixture of wetlands, forest, open water, and developed cover. The contrast is easiest to recognize around Lawrenceville and along the river-influenced areas that extend eastward.
Lawrenceville is a useful reference point because Illinois sources identify it as the county seat and place it along the Embarras River. On the map, the county’s largest developed cluster lies beside a corridor where wetland and wooded classes become much more common. Their proximity is a visible geographic relationship; it should not be treated as proof that one land-cover type caused another.
Farther east, the county edge bends and curves rather than following a simple straight line. The Wabash River forms the Illinois–Indiana boundary here, while the Embarras River crosses the county before reaching the Wabash system. Water, wetland, and forest colors become more noticeable in this part of the map, even though agriculture remains the dominant class countywide.
The 2025 cover map puts 72.44% agriculture beside concentrated wetlands and forest
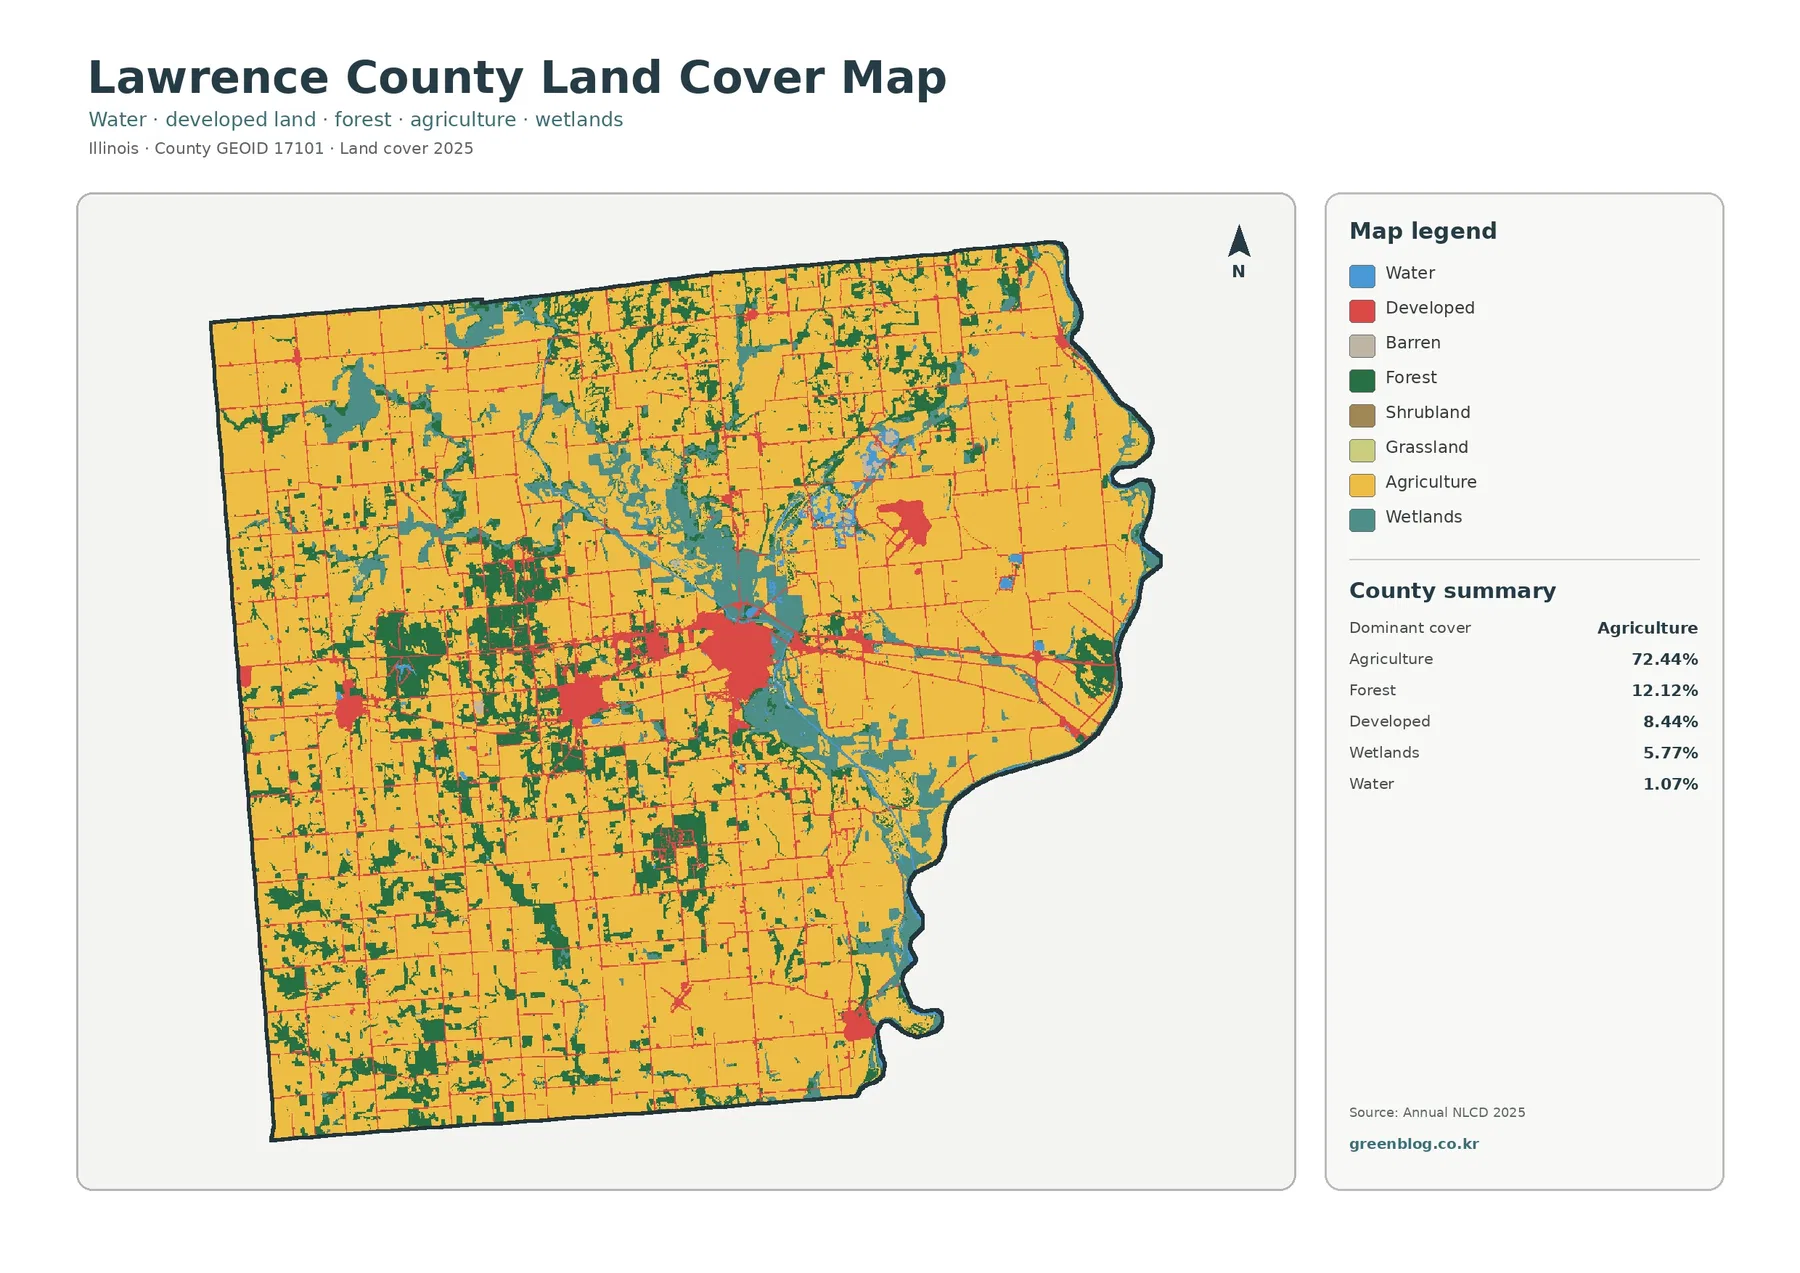
Land cover describes what is physically mapped at the surface, such as cropland, forest, wetland, water, or developed ground. It is different from zoning, ownership, parcel boundaries, and legal land use. A cell classified as agriculture identifies the mapped surface class at the dataset scale; it does not draw the boundary of an individual farm.
Countywide totals reinforce the first visual impression: agriculture leads at 72.44%, followed by forest at 12.12% and developed cover at 8.44%. Wetlands represent 5.77% and water 1.07%. The smaller percentages do not appear as random specks. Wooded and wet areas form larger patches and branching strips through the central river-bottom landscape and near the eastern edge.
Built cover is most concentrated at Lawrenceville, then appears as smaller clusters elsewhere in the agricultural landscape. Thin developed lines follow parts of the road network, separating compact settlement from the much larger rural background. A standard land-cover class cannot identify every building, road, industrial site, or neighborhood, but it does show where developed surfaces are grouped rather than continuous.
Wetland color is especially prominent between the Lawrenceville area and the Wabash side of the county. Illinois Department of Natural Resources material for the Embarras River Bottoms describes wetland, backwater, and river-bottom habitat in this same general area. That source gives local context for the concentration shown on the county map without implying that every mapped wetland cell belongs to a protected site.
Wooded pockets and wet ground stand out once farmland is isolated
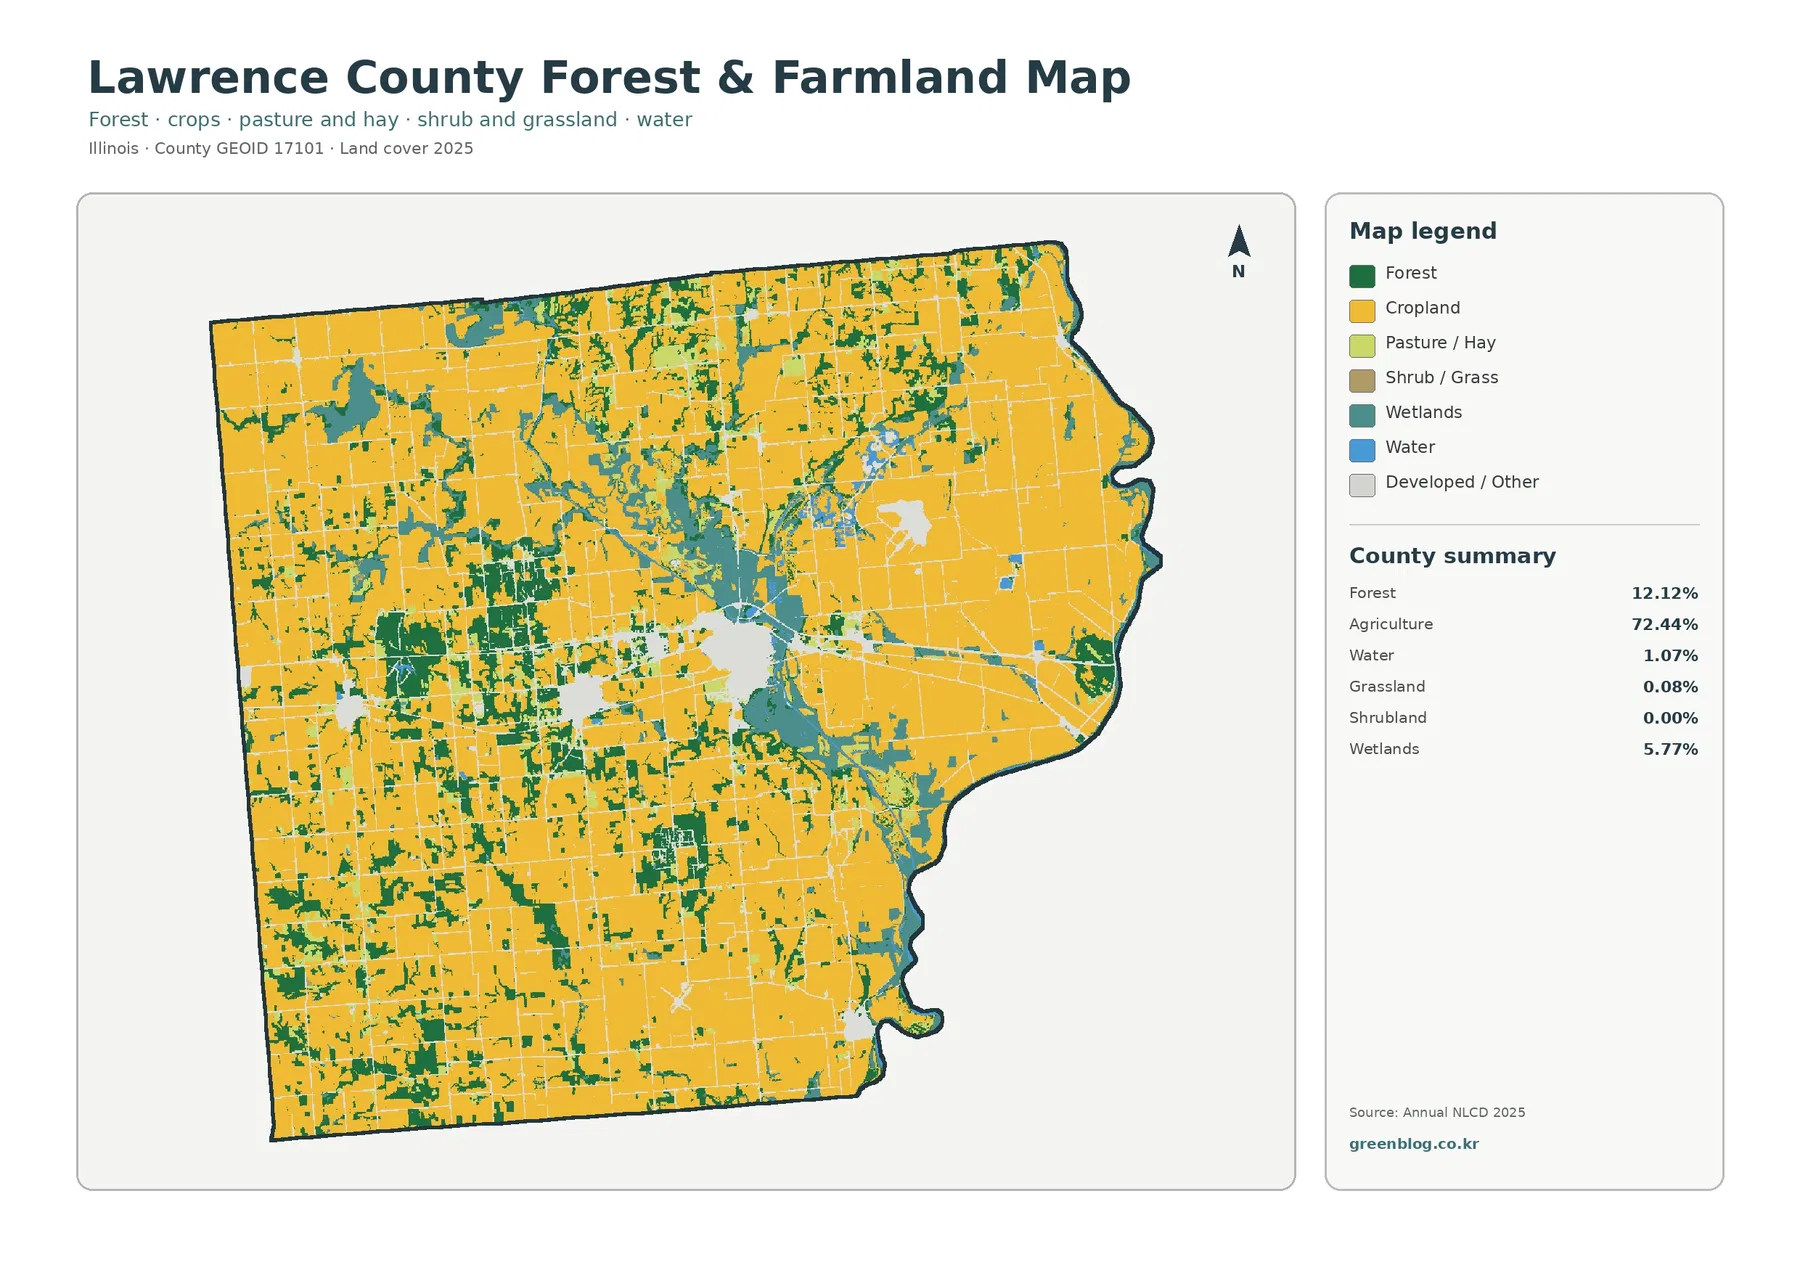
Removing much of the developed-class detail makes the farm-versus-natural-cover contrast easier to follow. Cropland still occupies most of the county, while forest reaches 12.12%, wetlands 5.77%, water 1.07%, and grassland 0.08% in the summary. Shrubland is shown as 0.00% after countywide rounding, which should not be read as proof that no small shrub patches exist on the ground.
Woodland is unevenly distributed. Several larger forest blocks sit west of the central river corridor, and narrower wooded strips branch through otherwise continuous cropland. That arrangement differs sharply from the broad rectangular field pattern surrounding it. In a classroom or presentation, the simplified map makes that contrast easier to explain without the stronger developed colors competing for attention.
Near Lawrenceville, agriculture is interrupted by a clear developed/other opening, with wetland and forest classes close by. Looking east and south from that area, river-bottom cover becomes more persistent. This is where the map adds more than a countywide percentage: it shows where the agricultural pattern actually gives way to wetter or more wooded ground.
At the Wabash-side boundary, water and wetland colors repeat along the irregular edge. Some fields extend close to the river-influenced zone, while other sections retain broader wooded or wetland bands. Those broad differences can guide a search for floodplain, habitat, or wetland information, but they are not a substitute for a regulatory wetland delineation or parcel-level review.
Lawrenceville carries most of the county’s hard-surface signal
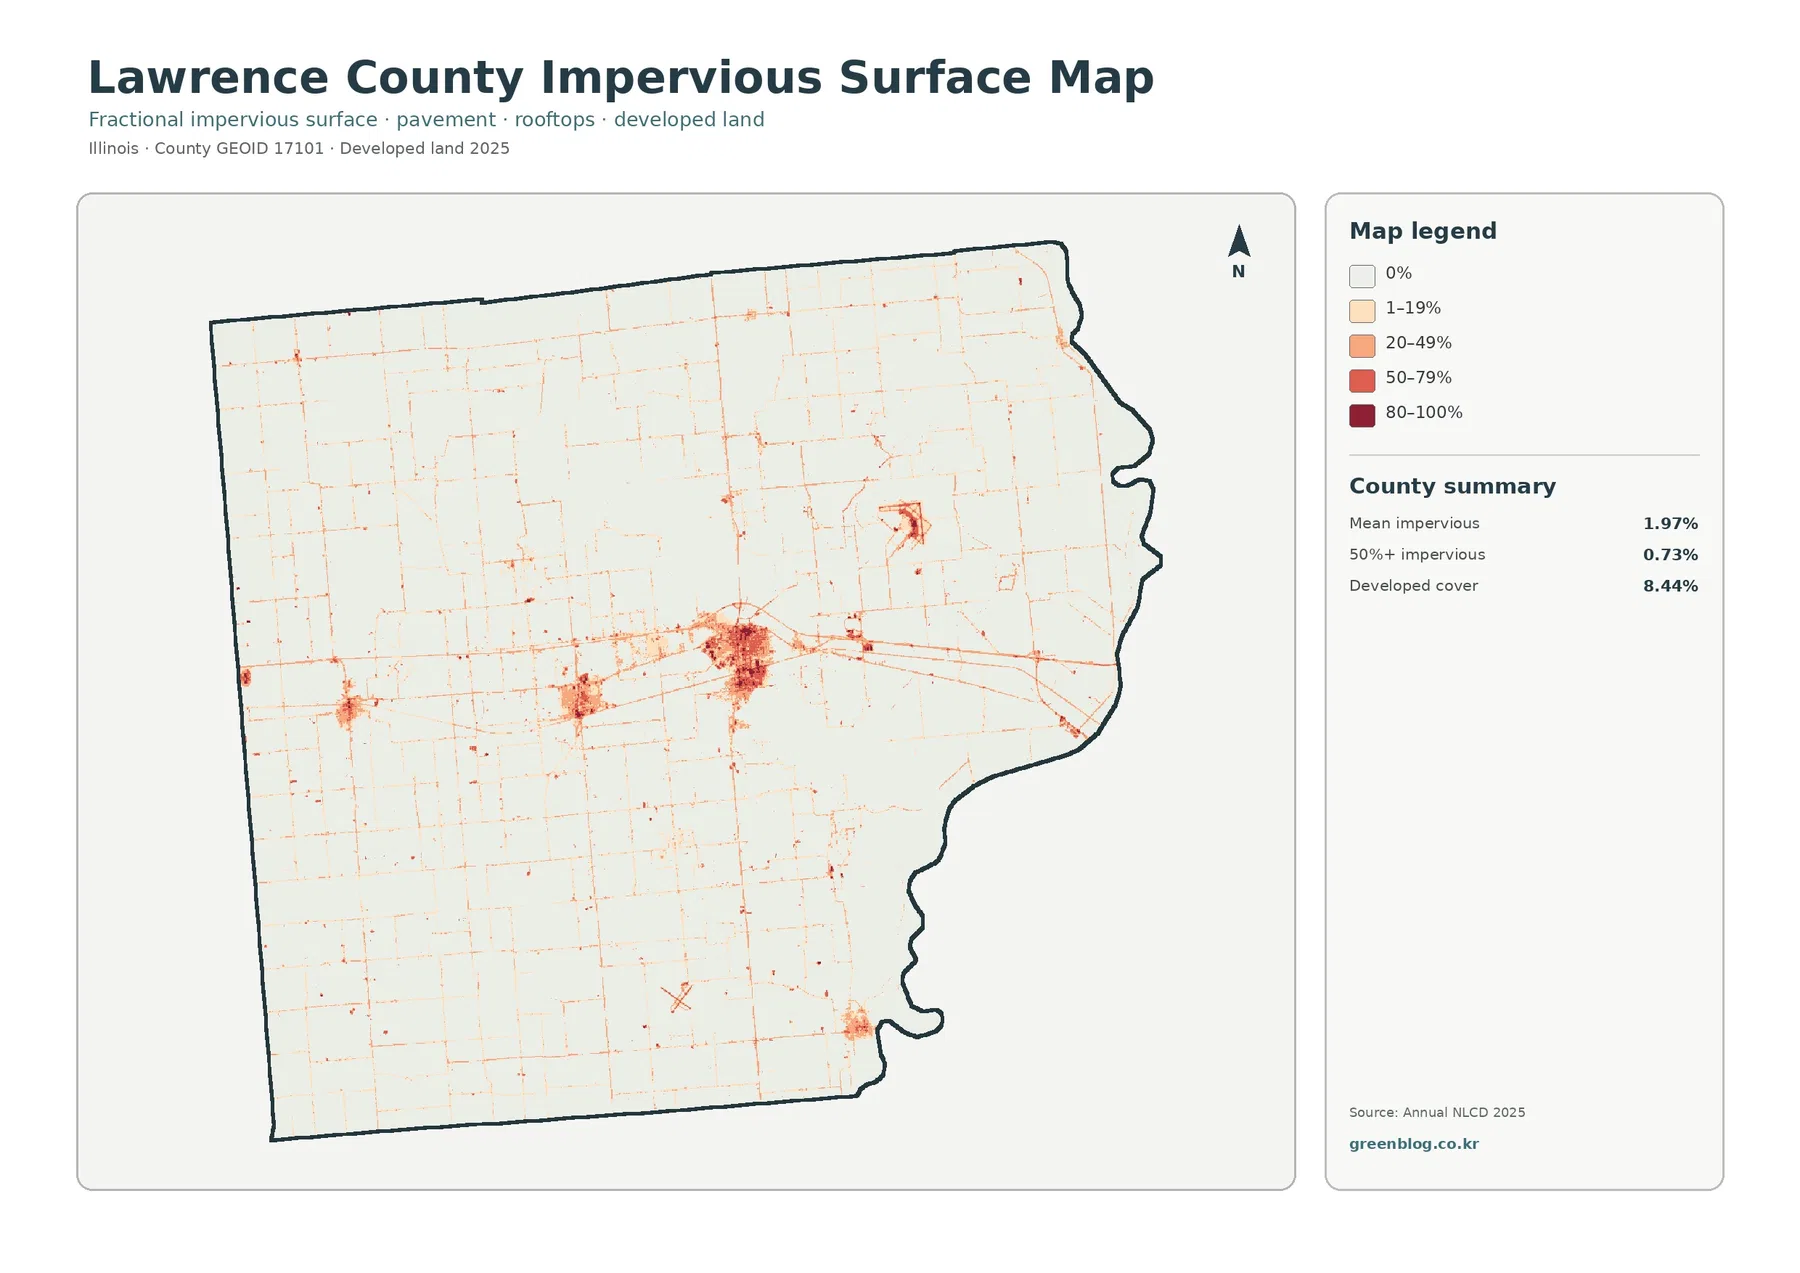
Impervious surface means rooftops, pavement, parking areas, and similar surfaces where rainfall does not readily soak into the ground. The county mean is 1.97%, and 0.73% of Lawrence County falls in mapped cells with more than 50% impervious cover. Because developed land as a cover class reaches 8.44%, the impervious layer adds detail by separating denser built surfaces from lower-intensity developed edges.
Lawrenceville forms the clearest high-impervious concentration. Roads extend outward as narrow lines, while smaller built clusters appear elsewhere among the fields. Across most agricultural sections, the road grid remains visible but surrounding cells stay at very low impervious values. In other words, development is present throughout the county without having the same surface intensity everywhere.
Placing the hard-surface layer beside the wetland and water pattern helps identify where built ground lies near the Embarras River corridor. That comparison can be a starting point for stormwater or watershed questions because it tells the reader where to look more closely. Drainage performance, runoff volume, water quality, and flood risk still require their own datasets and local information.
A low impervious percentage should be interpreted narrowly. It means relatively little mapped pavement or rooftop cover, not that a rural area has no environmental pressures. Field drainage, soil erosion, nutrient movement, and streambank conditions are different subjects. This layer is strongest when it is used for the built-surface question rather than as a general environmental score.
The 1985–2025 difference layer is scattered, not one sweeping conversion
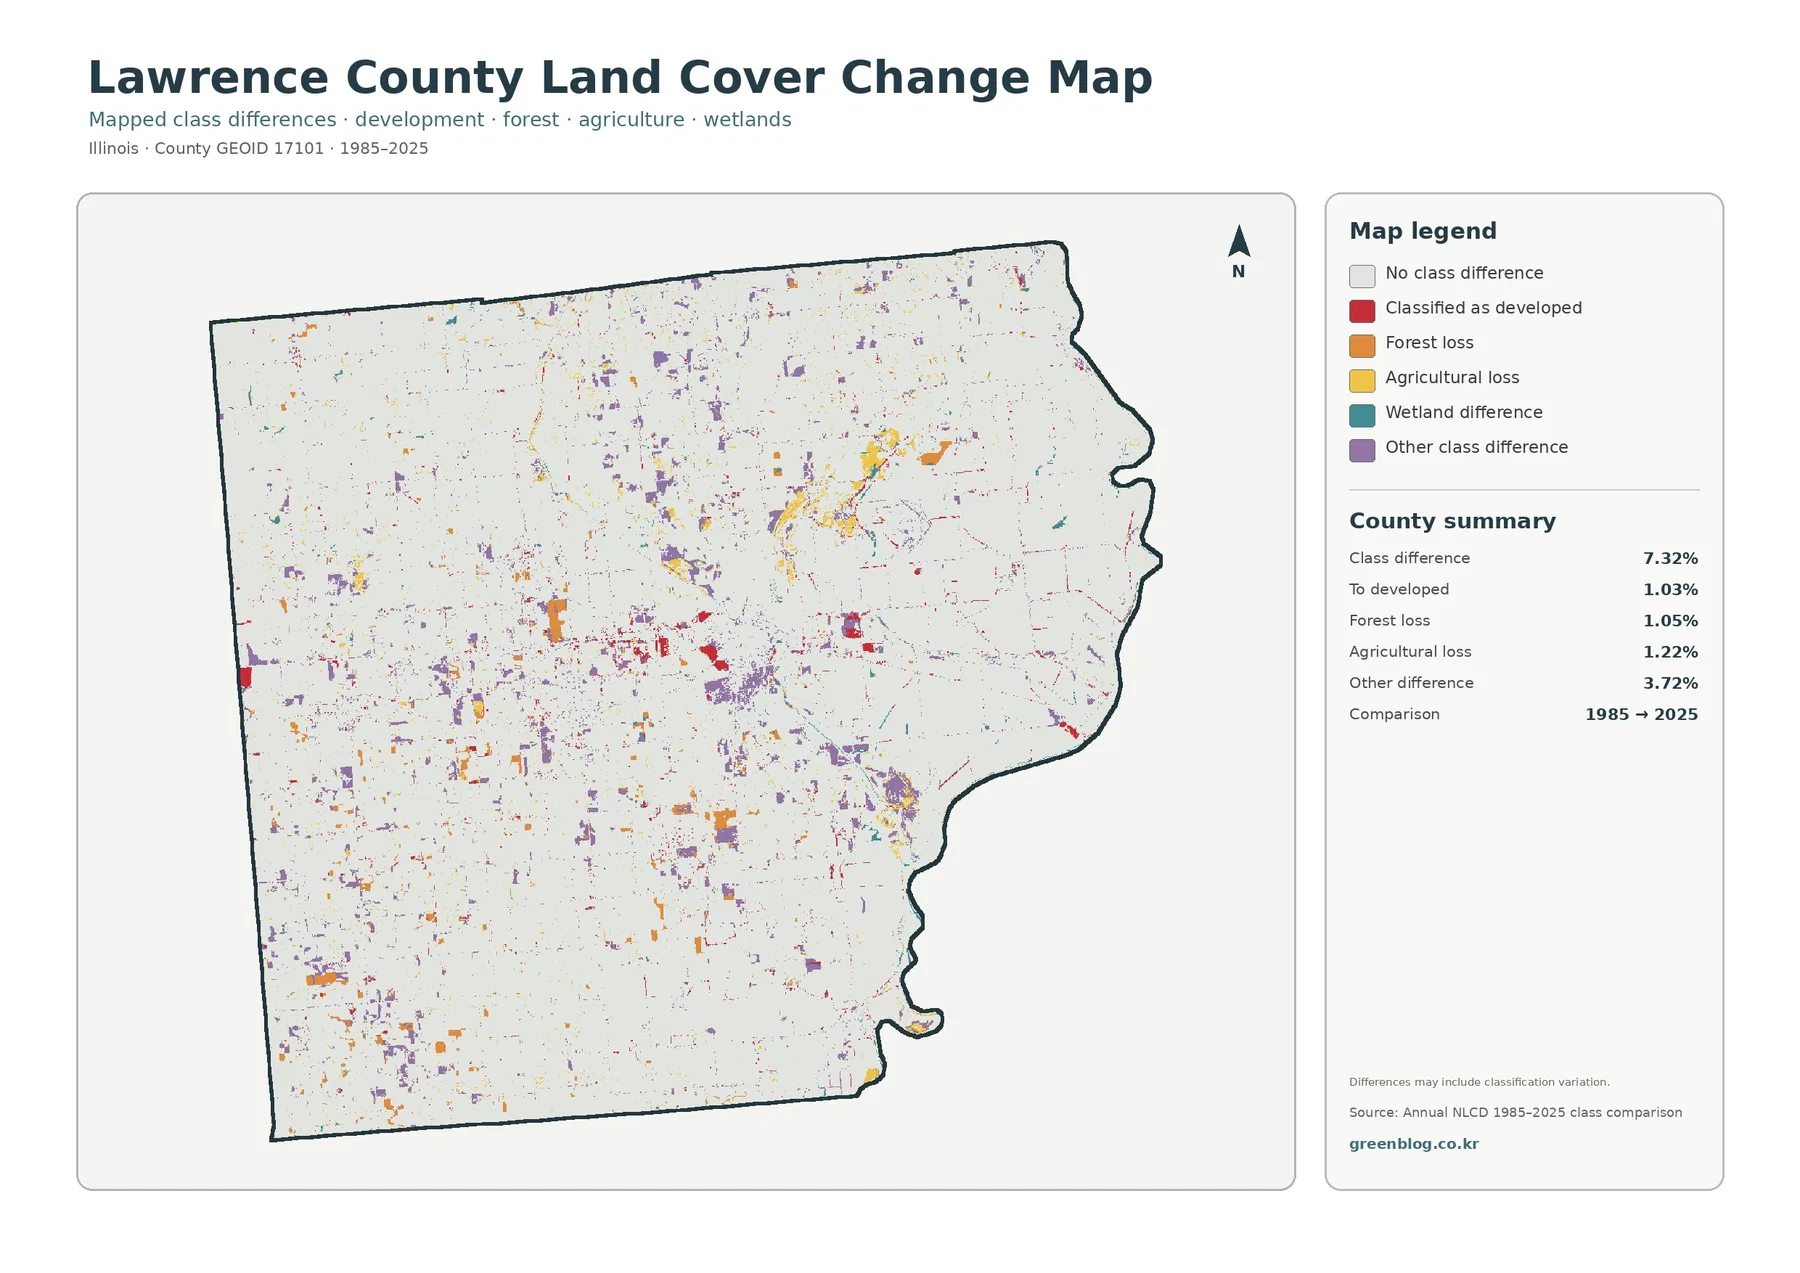
Between 1985 and 2025, the county summary reports a 7.32% mapped class difference. Listed components include 1.03% classified to developed, 1.05% forest loss, 1.22% agricultural loss, and 3.72% other class difference. Wetland difference appears as a legend category, but the supplied summary does not give it a separate exact percentage, so an additional value should not be invented by subtraction.
Colored change cells occur in many small patches rather than forming a single front across Lawrence County. Some developed differences lie near existing built clusters or linear features. Forest-loss and agricultural-loss colors appear in central and western patches, while several difference categories also occur near the eastern river environment. The resulting pattern is a mosaic, not a simple story of the whole county converting from one cover type to another.
Classification variation is explicitly part of the caution on this layer. A raster cell may switch classes because the ground truly changed, but imagery differences, mixed pixels, or classification boundaries can also affect the comparison. The 7.32% value is therefore best described as mapped class difference. Confirming a specific site requires aerial photographs, local records, field evidence, or another independent time series.
Larger color clusters are good candidates for follow-up. First note where the difference layer shows a concentration, then check the same location on the 2025 cover and impervious maps. That sequence tells you whether the place is currently agricultural, wooded, wet, or developed before you investigate its history with more detailed evidence.
Choosing the right Lawrence County map for the question
A county profile usually needs the general 2025 view first because it establishes the 72.44% agricultural baseline and immediately locates the central and eastern breaks in that pattern. A farm-and-natural-cover discussion can then move to the forest/farmland version, where wooded and wetland corridors are easier to trace against cropland.
Built-surface questions are better answered by pairing current cover with impervious intensity. Around Lawrenceville, that combination distinguishes the broader developed class from the smaller areas where pavement and rooftops are much more concentrated. The comparison is more informative than treating every developed cell as equally urban.
Wetland or river-bottom work benefits from the forest/farmland view beside the class-difference layer. One shows the present arrangement of crops, forest, wetlands, and water; the other highlights places where mapped classes differ between 1985 and 2025. Used together, they help narrow the places that deserve checking against Illinois DNR, hydrology, aerial imagery, or field-based sources.
Scale, classification, and dates set the limits of these maps
Annual NLCD products are raster datasets, so the landscape is divided into cells that receive a class or value. A single cell can contain more than one real-world surface. A narrow road may share space with cropland, or a forest edge may fall in the same cell as wet ground. Small features and boundaries can therefore look generalized at county scale.
Current-cover panels are labeled 2025, while the historical comparison uses 1985 and 2025. Development, vegetation change, or agricultural conversion after the observation period will not appear. Anyone needing present zoning, ownership, permit status, floodplain boundaries, or a surveyed parcel line should use the responsible local or state source instead of treating land cover as a legal map.
Neither the Embarras nor the Wabash river system stops at the county line. Watershed and ecological questions often need data from adjacent counties and the wider basin. Lawrence County is a convenient frame for comparing local patterns, but the boundary should not become an artificial limit when the subject is water movement, habitat, or river processes.
Download and practical use of the four JPG files
Each original JPG is 2480 by 1754 pixels according to the supplied asset manifest. The package does not mark those files as meeting an A3 high-resolution reference, so very large printing should be tested before final production. For screen use, document insertion, classroom handouts, and moderate-size presentation graphics, the four files provide a consistent set without relying on webpage screenshots.
A presentation about Lawrence County agriculture may need only the general cover and forest/farmland maps. A stormwater discussion would normally benefit more from the impervious panel beside current land cover. Historical screening calls for the 1985–2025 difference layer next to the 2025 map so the reader sees present cover before interpreting the older comparison.
Frequently Asked Questions
What is the dominant land cover in Lawrence County?
Agriculture is the dominant mapped cover in the 2025 county summary at 72.44%. Forest is 12.12% and developed cover is 8.44%. Wetlands and water have smaller countywide shares, but they are visually important because they are concentrated along the central and eastern river environments.
Which map is most useful for examining Lawrenceville?
Use the general land-cover map together with the impervious-surface map. The general view shows the developed cluster in relation to nearby forest, wetlands, and agriculture, while the impervious map separates the more heavily paved and built portions of the urban area from lower-density roads and edges.
Does the 7.32% class difference mean 7.32% of the county definitely changed land use?
No. It is a mapped land-cover class difference between 1985 and 2025, and the map notes that classification variation may be included. Site-level change should be checked with aerial imagery, local records, field information, or another independent time series before making a definitive statement. Map File Information The ZIP contains the four original JPG maps for Lawrence County, Illinois: 2025 land cover, forest and farmland, impervious surface and developed land, and 1985–2025 land-cover class differences.
Map File Information
Download the map files associated with this page for reference, printing, and compatible visual projects.
- Included Files: Use only the versions confirmed in the article and supplied images
- File Type: Use the confirmed download contents
- Intended Use: Printing, education, presentations, and map-based projects
Related Maps
- Adams County Illinois Land Cover Map
- Alexander County Illinois Land Cover Map
- Bond County Illinois Land Cover Map
Sources and references
- MRLC Annual NLCD Data – official access to Annual NLCD land-cover products
- USGS Annual NLCD Land Cover Classification – class definitions and interpretation guidance
- U.S. Census Bureau TIGER/Line Shapefiles – county boundary data
- Lawrence County, Illinois official website – county government and local information
- Illinois DNR Embarras River Bottoms State Natural Area – local river-bottom, wetland, and habitat context
Green Map creates custom-edited map images using open geographic data sources such as geoBoundaries, Natural Earth, OpenStreetMap, and government open data.
These maps are edited visual materials, not raw data files, and are provided for education, documents, presentations, and graphic reference.