Lee County is overwhelmingly agricultural on the 2025 land-cover map, yet the northwest corner around Dixon and the Rock River looks very different from the broad farm country farther east. Agriculture accounts for 86.25% of the county summary, while developed land covers 7.71%, forest 4.17%, wetlands 0.80%, and water 0.51%. The four maps on this page separate those patterns into general land cover, forest and farmland, impervious surface, and 1985–2025 class differences.
The four original JPG maps are also available in one download. They work well as a matched set because every map uses the same county boundary, making it easy to compare the farm interior with developed centers, wooded stream corridors, and mapped change. The discussion below stays close to what the supplied images actually show and explains where a second source is needed before making parcel-level or legal conclusions.
Table of Contents
A farm-dominant county with a sharply different northwest corner
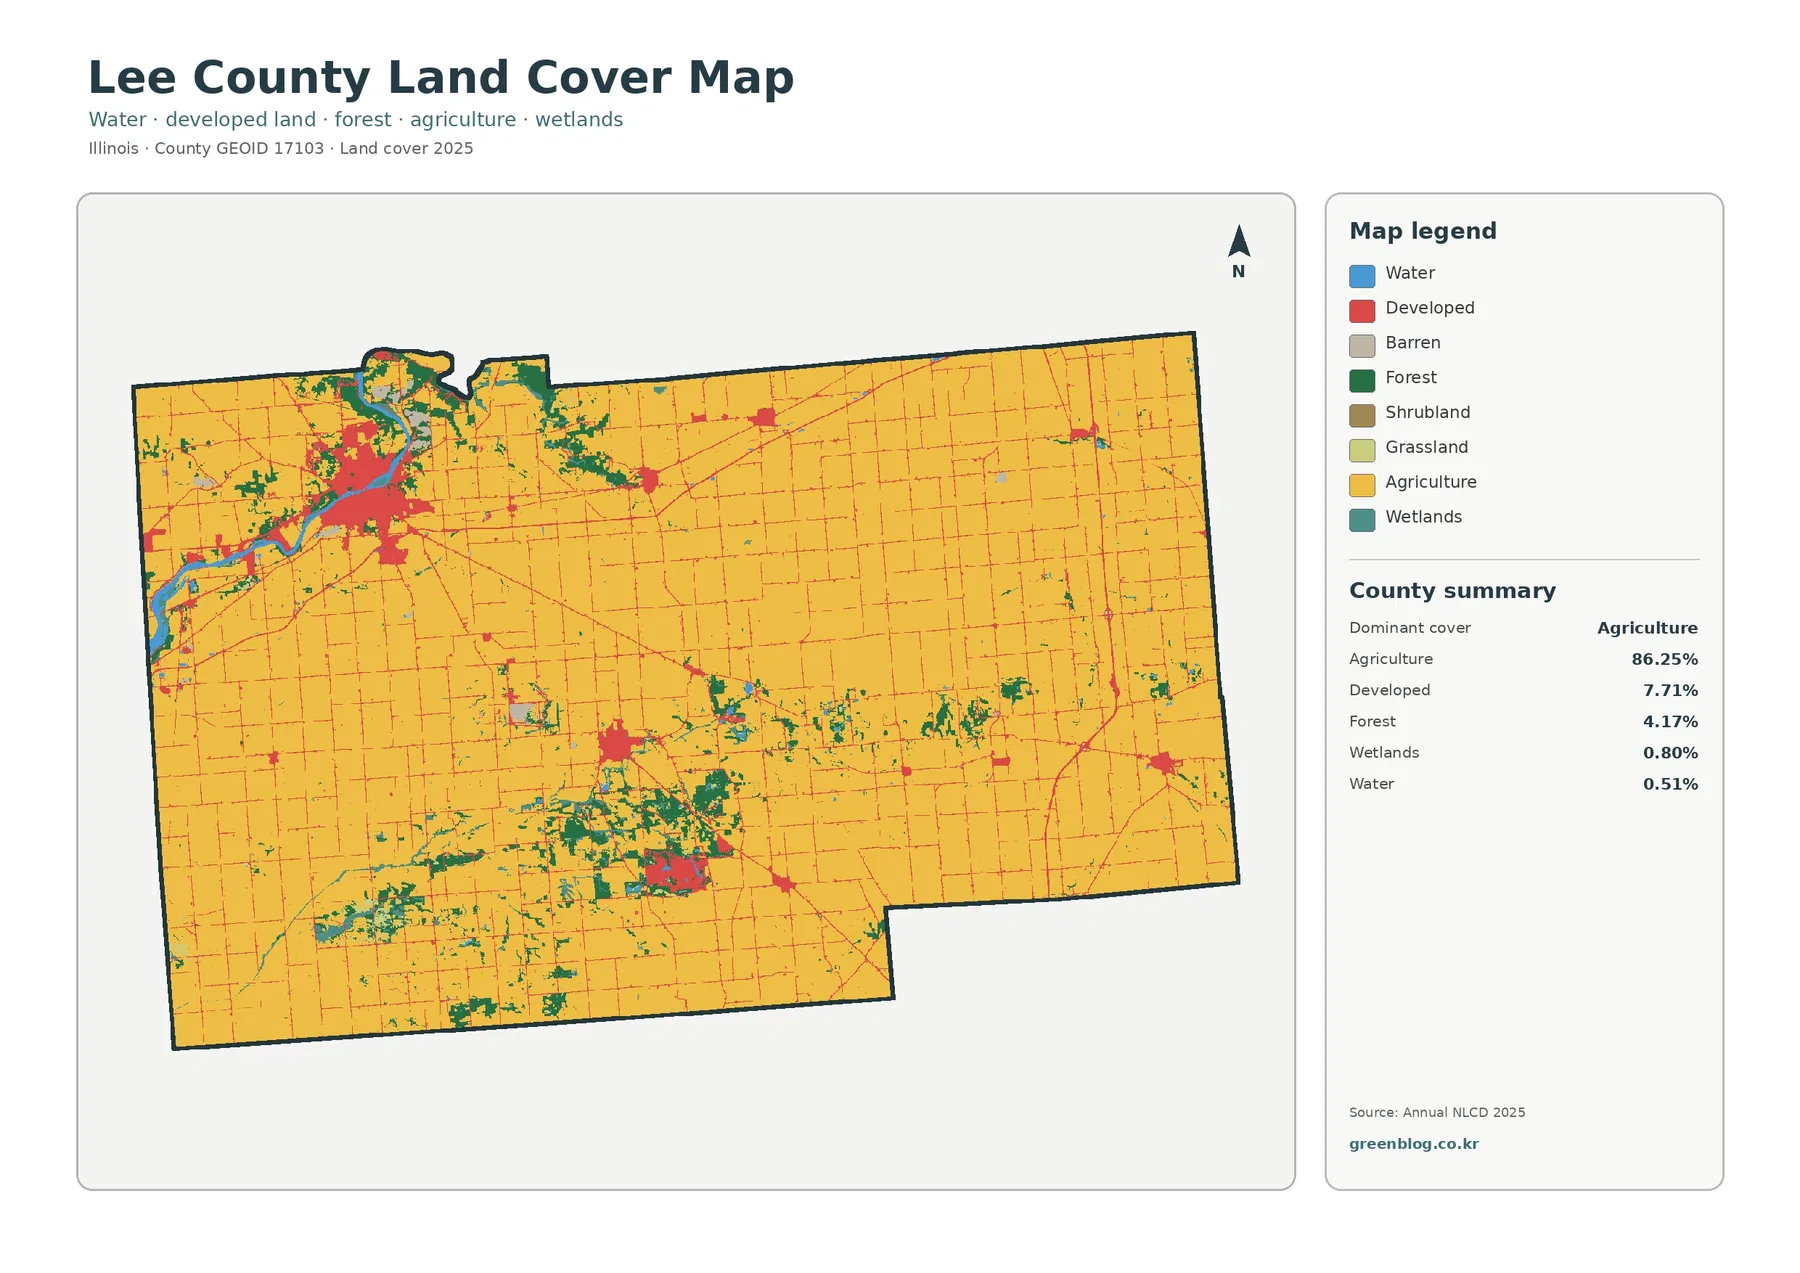
The first impression is a nearly continuous agricultural surface. Yellow farm classes fill most of the central and eastern county, interrupted by a fine road grid, small developed spots, and scattered green patches. That uniform appearance breaks down in the northwest, where a large developed cluster sits beside a winding water corridor and denser woodland. The contrast is strong enough that a reader can orient the other three maps by finding this corner first.
Lee County’s official comprehensive planning material describes the county as a rural part of northwestern Illinois and says development is focused in Dixon, the county seat, along with smaller cities and villages. That description matches the supplied map well: the most prominent built concentration appears around Dixon, while extensive agriculture spreads outward. County sources also identify Dixon with the Rock River, helping explain why water and wooded cover are so visible beside the northwest developed area.
A second built cluster appears in the south-central part of the county, surrounded by farmland and smaller wooded patches. Elsewhere, development is usually much smaller and often follows narrow linear features rather than forming broad blocks. This distribution matters because the countywide developed percentage alone does not show whether development is continuous or concentrated. On the map, most nonfarm surfaces are clustered around settlements and roads instead of being evenly distributed across the rural landscape.
The 2025 map puts 86.25% agriculture in context
Land cover describes the physical surface detected and classified from remotely sensed data. It is not the same as zoning, ownership, a parcel survey, or a legal land-use designation. A cell labeled agriculture indicates an agricultural surface class in the dataset; it does not draw the boundary of an individual farm. Developed classes likewise show built or developed cover, not the permitted use of a property. The map is best used to understand county-scale distribution and contrast.
The county summary lists agriculture at 86.25%, developed land at 7.71%, forest at 4.17%, wetlands at 0.80%, and water at 0.51%. Agriculture clearly dominates, but the smaller classes are not visually insignificant. Forest and water are concentrated in recognizable corridors, especially near the northwest river system and in several south-central bands. Developed land forms a few distinct centers plus thin lines that thread through the farm matrix.
Wooded cover rarely forms one huge interior block. Instead, many green areas are narrow, branching, or patchy, suggesting that the most visible forests are associated with corridors and margins rather than a uniformly forested region. The northwest contains the strongest combination of water, woodland, and development. Farther south, green patches interrupt the farm surface in a different pattern, with fewer large water features and more separated woodland pieces.
Wetlands and open water together occupy a small share of the county summary, yet their location gives them more visual weight than the percentages might suggest. Blue and wetland colors gather along specific channels rather than being spread evenly. That concentration makes the general map useful for choosing places that deserve a closer look with watershed, floodplain, or wetland data. It does not, however, identify flood risk or regulatory wetland boundaries by itself.
Mean impervious cover is 2.02%, but the built centers stand out clearly
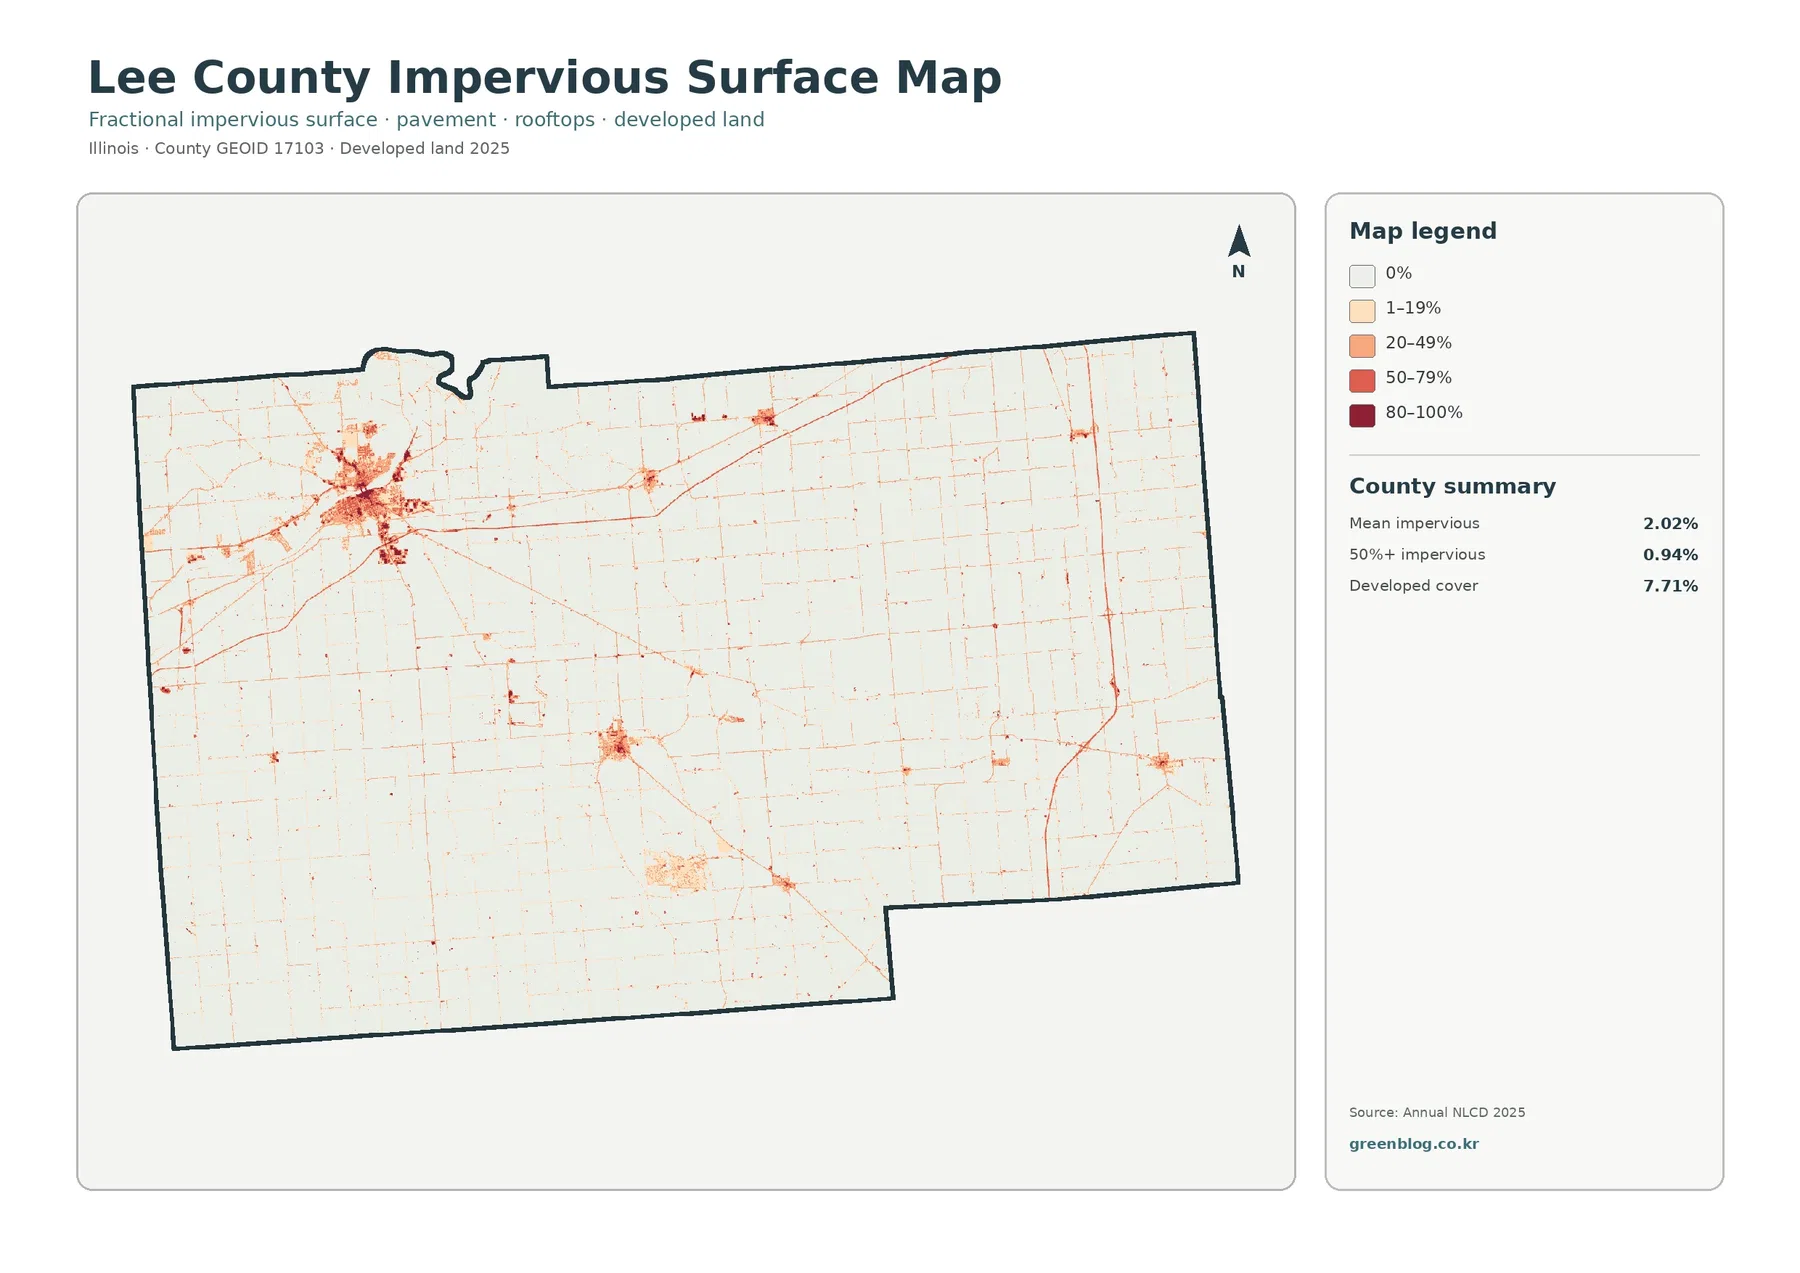
Impervious surface means pavement, rooftops, parking areas, and similar surfaces that limit direct infiltration into the ground. The map groups cells into percentage ranges from little or no impervious cover to very high values. Lee County’s mean impervious cover is 2.02%, while 0.94% of the county is mapped at 50% impervious or higher. The developed-land share is 7.71%, which shows why developed area and high impervious area should not be treated as interchangeable measures.
Dixon produces the strongest concentration on this map. Darker impervious values cluster around the northwest urban center, with lighter values spreading outward and narrow road lines extending into the agricultural surroundings. The pattern is much finer than the general land-cover map. Instead of one broad developed color, readers can see that central built surfaces, lower-density edges, and rural roads have different levels of imperviousness.
The south-central developed cluster also becomes easy to locate. It is smaller than Dixon but still forms a distinct patch against the otherwise pale agricultural background. Thin lines connect many smaller settlements and farm areas, creating a countywide network without turning the landscape into a continuous developed surface. This is a useful visual reminder that rural counties can have extensive transportation and settlement networks while retaining a very low average impervious percentage.
Low imperviousness does not mean an area has no water-management concerns. Soil erosion, field drainage, nutrient movement, and other agricultural processes are outside the purpose of this map. Likewise, seeing impervious cover near the Rock River does not establish a cause for any specific water-quality issue. The map is most useful as a screening layer that shows where built surfaces are concentrated before a reader consults engineering, drainage, or watershed information.
The 1985–2025 comparison shows 4.99% class difference, mostly in scattered patches
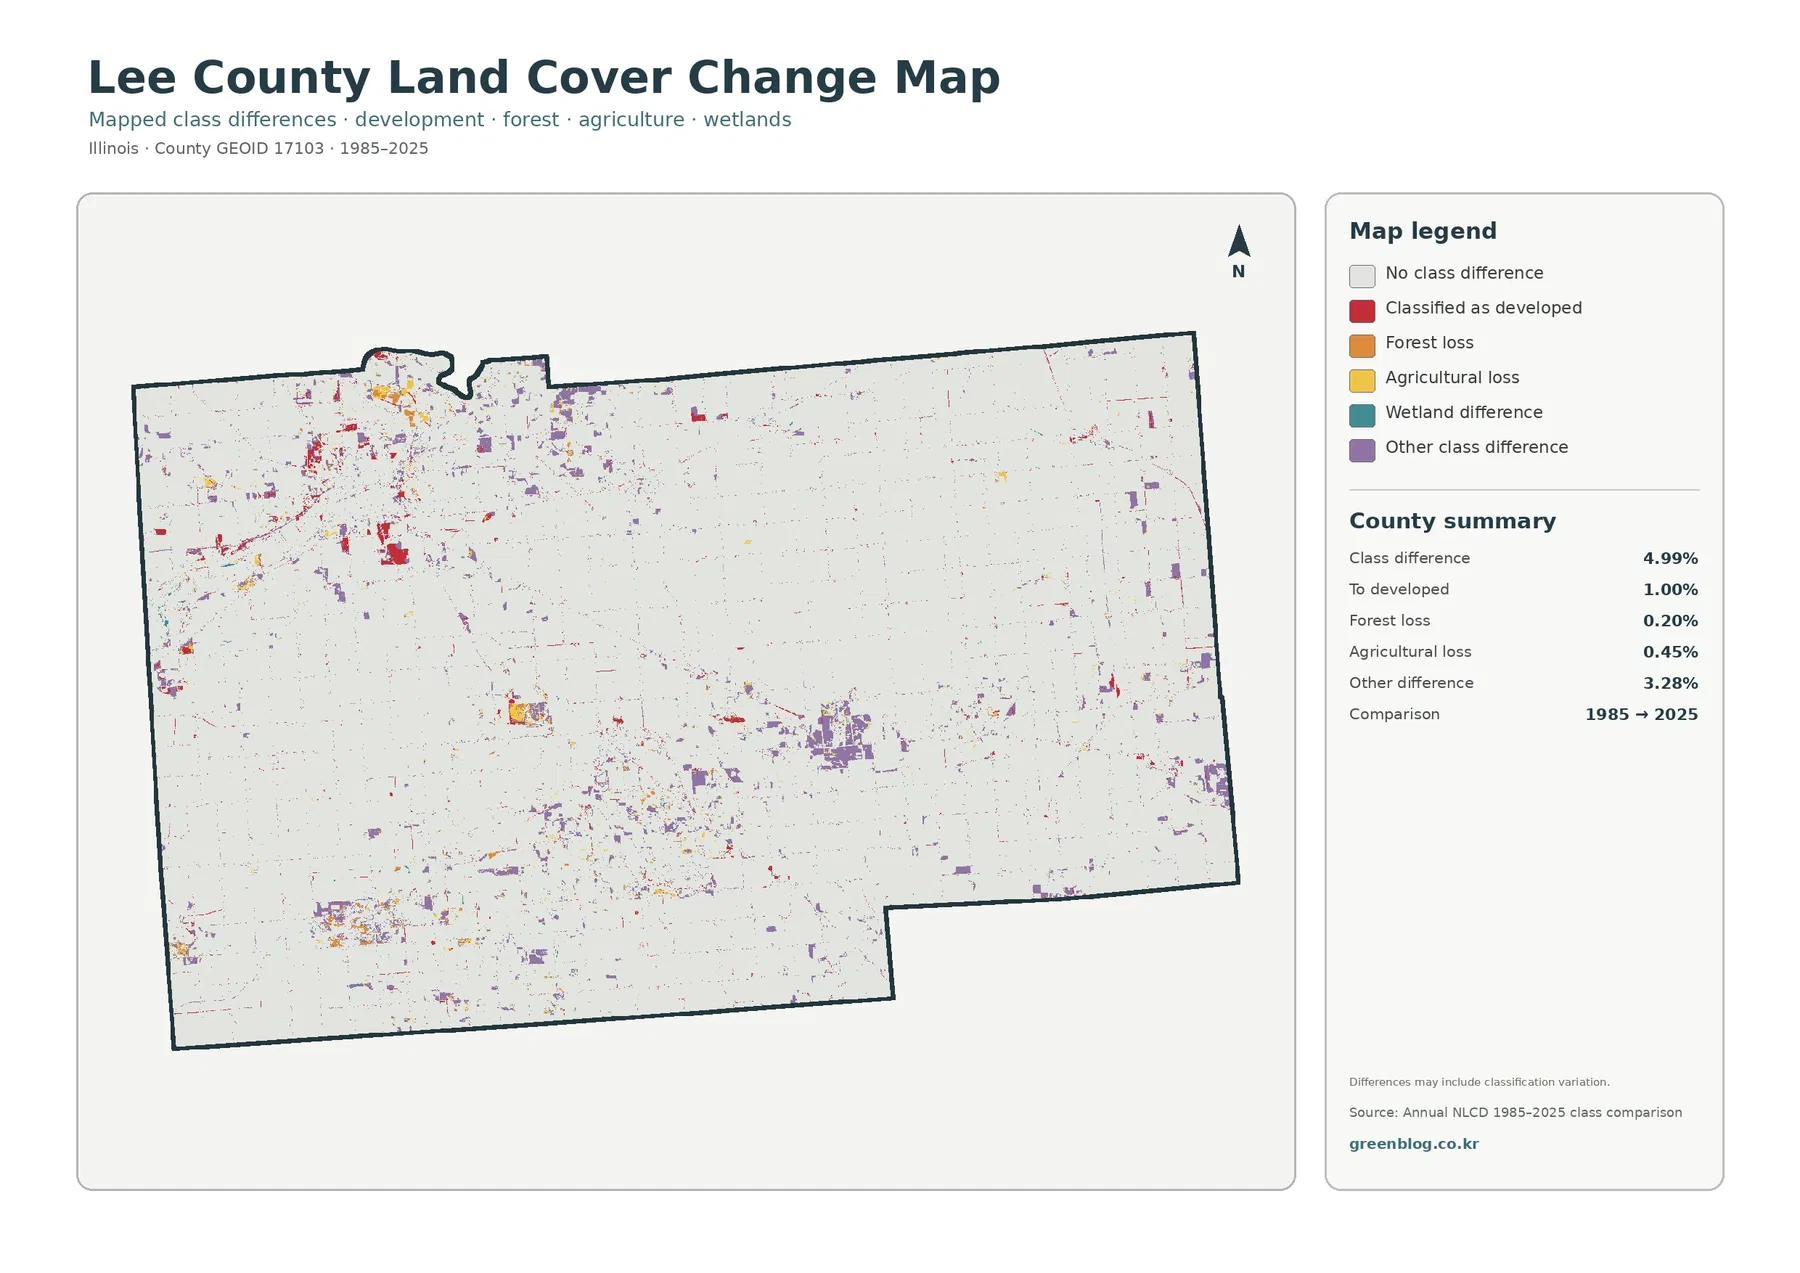
The change view compares the 1985 and 2025 classifications. Its summary reports a 4.99% class difference, including 1.00% classified as change to developed, 0.20% forest loss, 0.45% agricultural loss, and 3.28% other class difference. Most of the county remains in the pale no-difference category, so the visual story is not a wholesale conversion of the agricultural landscape. Instead, colored cells appear in clusters around developed areas and in many smaller scattered locations.
Red change-to-developed cells are most noticeable around the northwest urban area and occur around other settlements as well. Purple and other difference colors are more dispersed, including patches in the farm interior. The eastern portion contains many small marks but no single enormous block of continuous change. This spatial pattern is more informative than the countywide percentage because it helps a reader identify where further historical imagery or local records may be worth checking.
The 4.99% figure should not be read as an official total of land-use conversion. Differences can reflect real surface change, but they can also include classification variation between years. Thirty-meter cells may contain mixed cover, and changes in imagery or classification methods can shift a cell from one class to another even when the real-world boundary is gradual. A small colored patch therefore needs corroboration before it is tied to a particular development, clearing event, or farm conversion.
Forest loss at 0.20% and agricultural loss at 0.45% deserve the same caution. They are map-comparison categories rather than administrative totals for timber removal or farmland conversion. A practical way to use this map is to flag larger or repeated colored clusters, compare them with the current land-cover image, and then consult aerial photography or local records. That workflow preserves the map’s value without claiming more precision than the dataset provides.
Forest and farmland separate cleanly along the Rock River corridor
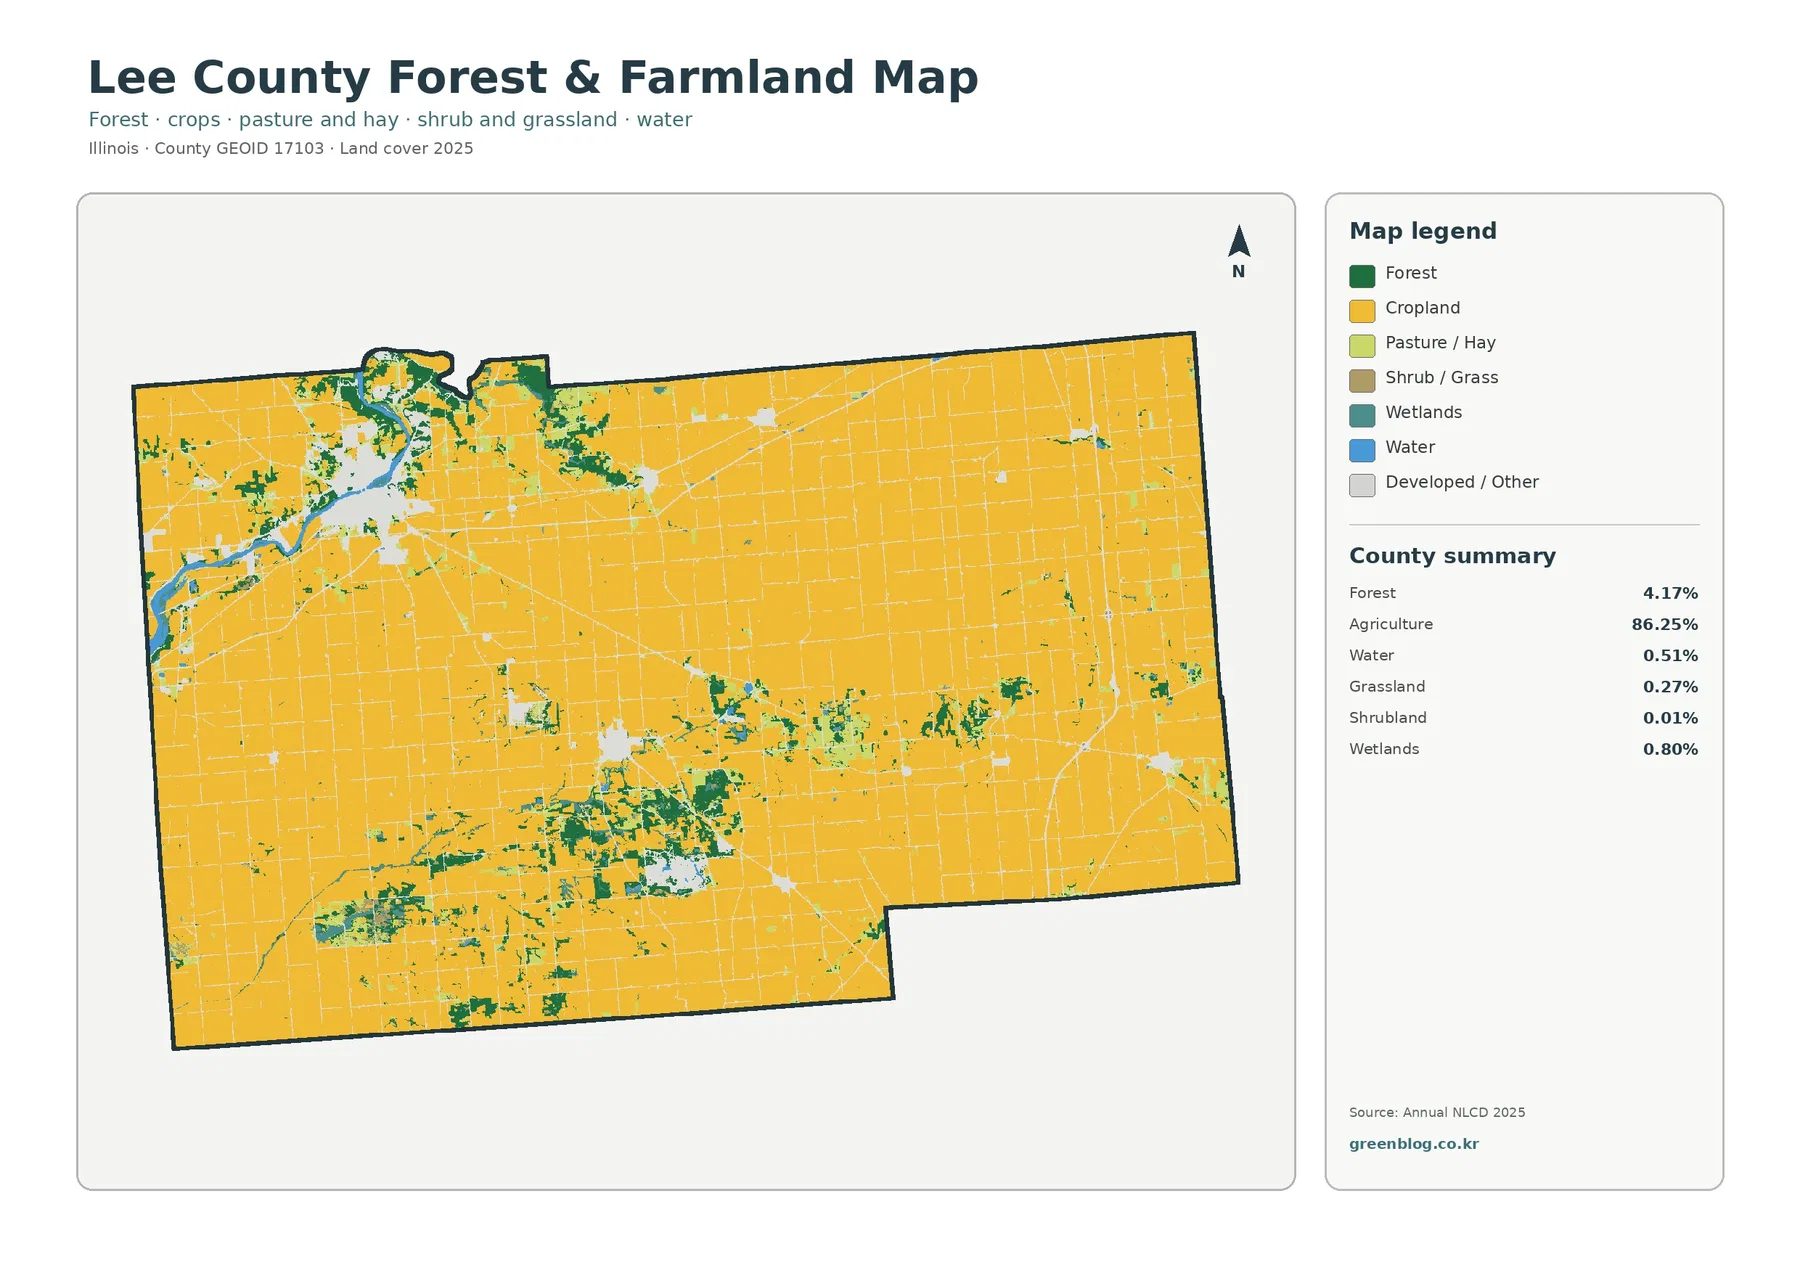
The forest-and-farmland version strips away much of the developed detail so the agricultural pattern becomes even clearer. Its summary repeats agriculture at 86.25% and forest at 4.17%, with water at 0.51%, wetlands at 0.80%, grassland at 0.27%, and shrubland at 0.01%. Those very small grass and shrub shares are important: Lee County should not be described as a grassland- or shrubland-dominated landscape when the supplied data overwhelmingly point to cropland.
Around Dixon, the simplified palette makes the Rock River corridor and adjacent woods easier to follow. The developed center becomes a neutral area while forest and water stand out around it, so the relationship between town, river, and wooded margins is more legible than on the general map. This is one of the best views for explaining how a heavily farmed county can still contain narrow natural corridors that are visually continuous across several miles.
South-central Lee County contains a different woodland pattern. Instead of one dominant river bend beside a city, green patches appear as smaller blocks and branching strips within cropland. Some pieces look isolated at first glance but connect through narrow bands when the map is viewed closely. That detail is useful for habitat or watershed discussions because it points to places where more specialized ecological data could be compared later.
The eastern half remains mostly agricultural even in this simplified map, although small wetland, water, and forest patches remain visible. Because the forest share is only 4.17%, scale matters when printing or placing the map in a presentation. A full-county thumbnail can make small green areas disappear. Showing the whole county first and then enlarging the northwest or south-central woodland concentrations preserves both the broad farm context and the local detail.
What Lee County planning documents add to the map interpretation
Lee County’s Planning page says the comprehensive land-use plan is intended to maintain the agricultural economy, limit nonagricultural development on prime farmland, and preserve the county’s rural character. The supplied map’s 86.25% agricultural cover provides a strong visual context for that policy discussion. The two sources answer different questions, however. The map classifies the physical surface in 2025, while the plan addresses land-use goals and decisions.
The county plan also describes development as concentrated in Dixon and smaller communities rather than spread evenly across the landscape. That is consistent with the built clusters visible in the land-cover and impervious maps. Using the plan beside the imagery helps explain why it is useful to compare the location of developed land with the continuity of agricultural cover. It does not mean the map can predict future development or determine whether a parcel may be rezoned.
Lee County’s GIS department makes a similar distinction about legal precision. Its public GIS information is provided for visual reference, and legal parcel-boundary confirmation requires appropriate survey work. Land-cover pixels deserve at least the same caution. Their boundaries are analytical classifications, not surveyed property lines. Countywide patterns are the strength of this page; property ownership, zoning, easements, and permit status belong to other official datasets.
Thirty-meter cells, mixed pixels, and other limits to keep in mind
Annual NLCD land-cover products use a 30-meter raster framework. The real landscape is continuous, but the map divides it into regular cells and assigns a representative class. Small ponds, narrow woodland strips, individual buildings, or short road segments can be simplified when they occupy only part of a cell. That is why some edges look blocky and why a thin natural feature may appear wider, narrower, or discontinuous at this scale.
Mixed pixels are especially important where forest, cropland, lawns, roads, and water meet within a short distance. One cell may contain more than one real surface but still receive a single dominant land-cover class. Impervious data reduce that problem in a different way by expressing a fraction, yet they still do not trace the exact outline of every roof or parking lot. The maps should therefore be read as generalized regional information rather than a substitute for detailed site mapping.
The long-term comparison adds another layer of uncertainty. Images from different years are affected by acquisition conditions, seasonal appearance, classification updates, and boundary placement. Large clusters and repeated patterns deserve more attention than isolated single cells. If a specific site matters, the next step should be higher-resolution imagery, county GIS layers, field observations, or official planning records rather than magnifying the raster and assuming it becomes more precise.
Choosing the right Lee County map for printing, classwork, or local comparison
The general land-cover map is the best starting point for a quick county overview. It shows the 86.25% agricultural setting, the developed centers, and the forest-water corridors in one view. If the purpose is to compare cropland with wooded or wet areas, the forest-and-farmland map is cleaner because it reduces competing developed detail. That makes the northwest river corridor and the south-central green patches easier to explain on a slide or printed handout.
The impervious map is more useful when the question concerns the density of built surfaces. Pairing the 7.71% developed share with 2.02% mean imperviousness is a simple way to show that developed classes include more than rooftops and pavement. For environmental education, place this map beside the water and wetland pattern to identify places worth checking with watershed or stormwater sources. The map itself does not measure runoff.
For historical comparison, the 1985–2025 map provides a different kind of evidence. It highlights locations where classes differ, so the safest caption is “mapped class difference” rather than “confirmed land-use conversion.” Place it beside the current land-cover image to see whether a change cluster falls in today’s developed, agricultural, forested, or wet area.
The downloadable JPG files preserve the same map layouts and legends without relying on a browser screenshot. They can be arranged as a four-panel comparison, printed separately, or used one at a time in a presentation. Higher image dimensions improve the appearance of text and linework when printed, but they do not increase the underlying 30-meter land-cover resolution. Keeping that distinction clear prevents a sharp-looking file from being mistaken for parcel-scale data.
Frequently Asked Questions
What is the largest land-cover class in Lee County?
Agriculture is the dominant 2025 class at 86.25%. Developed land accounts for 7.71%, forest 4.17%, wetlands 0.80%, and water 0.51%. The farm pattern is broadest across the central and eastern county, while the northwest around Dixon and the Rock River contains a much more varied mixture of development, woodland, and water.
Which map makes the Rock River woodland around Dixon easiest to see?
The forest-and-farmland map is the clearest choice because it simplifies developed classes and strengthens the contrast among cropland, forest, water, and wetlands. If the goal is to compare the river corridor with urban surface density, use it beside the general land-cover and impervious-surface maps.
Does the 4.99% change figure mean 4.99% of the county was legally converted to a new land use?
No. The 4.99% value represents mapped class differences between the 1985 and 2025 land-cover classifications. It is not a total of zoning changes, development permits, farmland conversions, or timber removals. Classification variation can contribute to the result, so important locations should be checked with aerial imagery, county records, or other site-specific sources.
Map File Information
One ZIP contains the four original JPG maps for Lee County, Illinois: general land cover, forest and farmland, impervious surface and developed land, and the 1985–2025 land-cover change map.
- Included Files: Four original JPG land-cover maps used in this article
- File Type: JPG images packaged in a ZIP archive
- Intended Use: Printing, education, presentations, and map-based projects
Related Maps
- Adams County Illinois Land Cover Map
- Alexander County Illinois Land Cover Map
- Bond County Illinois Land Cover Map
Sources and References
The numerical summaries and spatial observations above are based first on the four supplied Annual NLCD 2025 map images. Official sources below provide the land-cover classification background, county planning context, GIS cautions, and county boundary reference. These maps should not be used as legal evidence of parcel boundaries, ownership, zoning, or development rights.
- MRLC Annual NLCD Data – annual land-cover data resources
- U.S. Geological Survey – Annual NLCD Land Cover Classification – classification background and class descriptions
- Lee County Planning – county comprehensive land-use planning and agricultural policy context
- Lee County GIS – county GIS access and parcel-boundary reference cautions
- U.S. Census Bureau TIGER/Line Shapefiles – county boundary data
Green Map creates custom-edited map images using open geographic data sources such as geoBoundaries, Natural Earth, OpenStreetMap, and government open data. These maps are edited visual materials, not raw data files, and are provided for education, documents, presentations, and graphic reference.