Greene County is dominated by agriculture in the 2025 land-cover data, but the county does not read as one uninterrupted farm surface. Agriculture covers 73.05%, while forest accounts for 17.90%, developed land 5.54%, wetlands 2.69%, and water 0.74%. The wooded cover breaks the farm blocks into smaller pieces, and water and wetland colors become much more noticeable along the western side. This page uses four maps to separate those patterns without turning the explanation into a technical GIS report.
The WebP maps can be compared directly on the page, and the four original JPG maps are available together in one ZIP. One map shows all major land-cover classes, another reduces the view to forest and farmland, a third emphasizes impervious and developed surfaces, and the final map compares the 1985 and 2025 classifications. Reading them together makes it easier to distinguish broad farm country from wooded corridors, compact built centers, river-edge cover, and mapped class differences over time.
Table of Contents
Agriculture covers 73.05%, but wooded bands keep the county from looking uniform
The general 2025 land-cover map is mostly agricultural yellow across the north, east, and interior. Large farm blocks touch one another through much of the county, so the overall agricultural character is obvious even before reading the percentage summary. Forest changes that picture. Green bands and patches cut through the fields, becoming broader in parts of the southwest and west-central area and more branch-like through the interior.
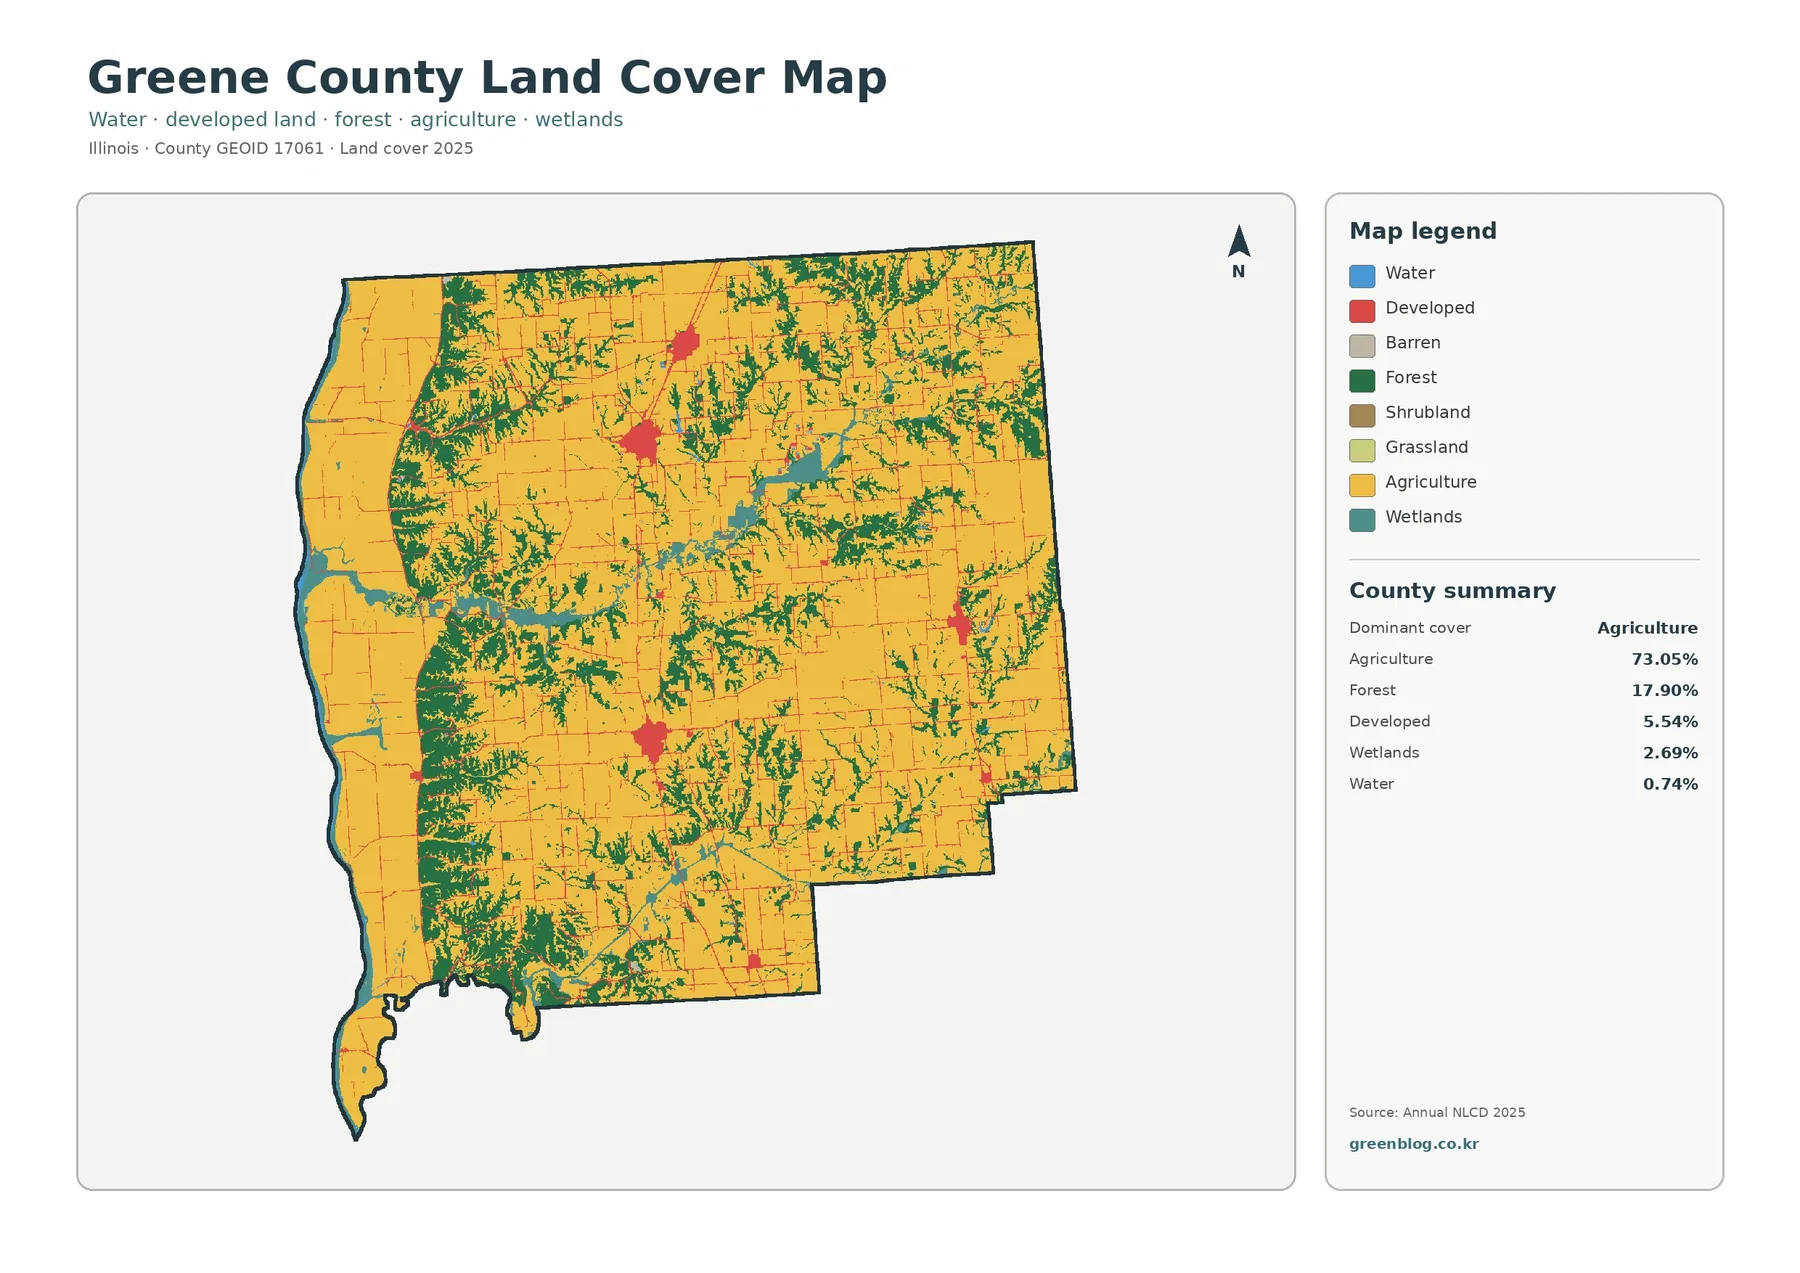
Forest is the second-largest class at 17.90%. It is not confined to one large block. Instead, wooded cover repeatedly enters the farm landscape in narrow or medium-width strips, with heavier concentrations in the southwest and west-central parts of the county. That arrangement matters because two places can both be surrounded by agriculture while still having very different amounts of nearby tree cover.
Developed land accounts for 5.54%. The red and orange areas do not form a broad urban sheet. They appear as small concentrations separated by farmland and connected by thin road-like lines. That pattern is more consistent with scattered town centers and transportation links than with one continuously built-up area. The percentage summary is useful here because the strong map colors can make those small developed centers look larger than their actual share of the county.
Water and wetlands occupy small percentages but strongly shape the western edge
Water covers 0.74% and wetlands 2.69%, so neither class is large in countywide percentage terms. On the map, however, blue and teal features form long shapes along the western side and in nearby low-lying areas. Greene County’s location near the Illinois River helps explain why that edge looks more varied than the broad agricultural interior.
The most useful detail is the relationship among the classes. Water is often bordered by wetland or forest color before the map returns to agriculture farther inland. Those narrow transitions can have a strong visual effect even when the countywide percentages are small. A visitor who only reads the table might treat water as minor, while the map shows why river-edge cover is one of the features that makes Greene County distinct from a simple farm-grid county.
The forest-and-farmland view makes the branching wooded pattern easier to follow
The forest-and-farmland map removes much of the color competition from the full land-cover legend. Agriculture still fills most of the county, but the wooded strips are easier to trace from one area to the next. In the center and south, green cover repeatedly interrupts the farm blocks. Farther west, forest is more closely associated with the complex water-and-wetland edge. The eastern side generally appears more open and agricultural.
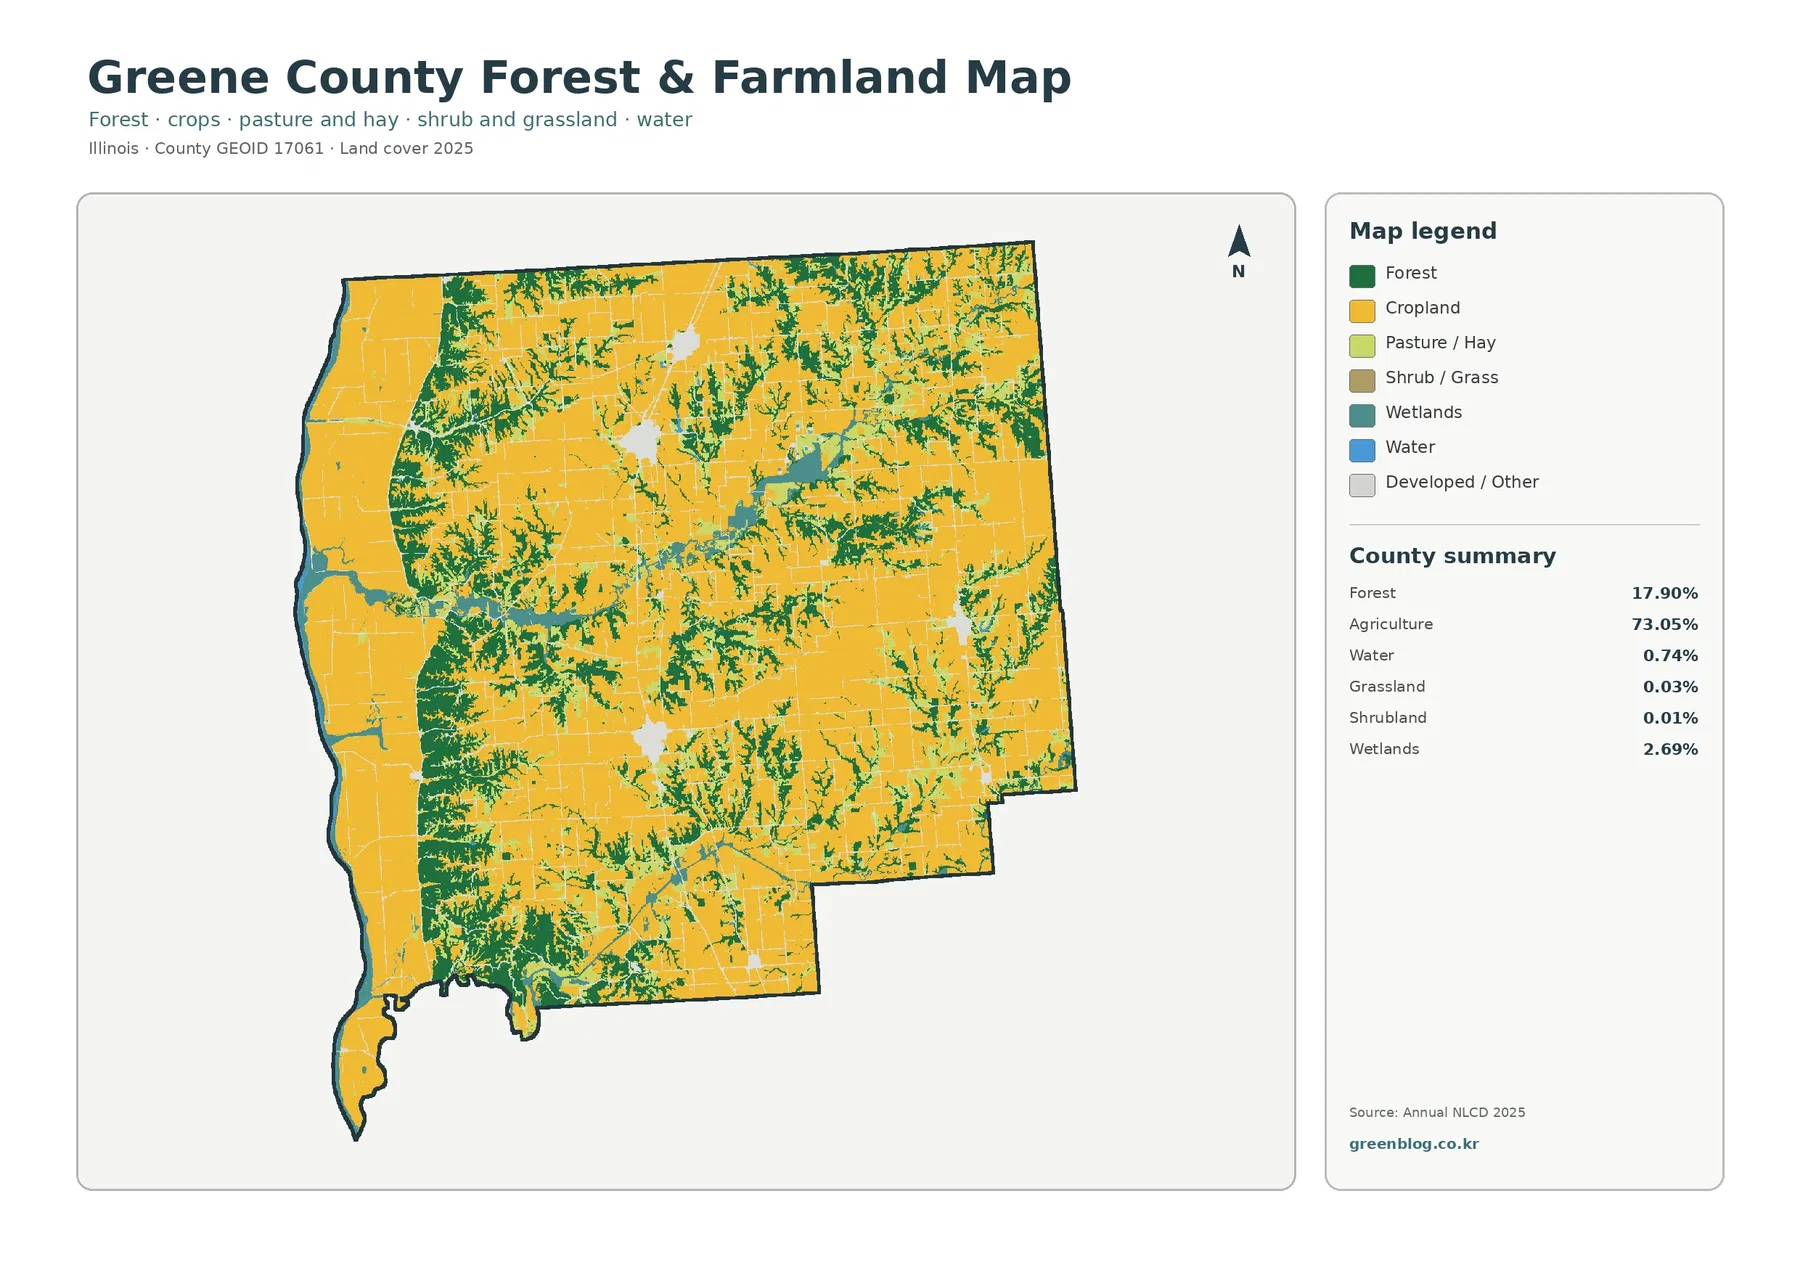
This version is especially useful when the question is not “what class is every pixel?” but “where do farm blocks stay open, and where does tree cover break them up?” It also shows why the 17.90% forest figure should not be imagined as a single forest reserve. Much of the wooded cover is distributed in elongated or irregular pieces that are woven through agricultural land.
The USDA 2022 Census of Agriculture profile reports 709 farms and 319,730 acres of land in farms for Greene County. That information is useful background for understanding the county’s agricultural character, but it is not the same measure as the 73.05% agricultural land-cover class in the 2025 Annual NLCD. One source describes agricultural operations and land in farms, while the other classifies the observed surface cover.
A 1.26% mean impervious value points to compact hard-surface centers rather than widespread paving
The impervious/developed map shifts attention away from crops and trees and toward harder surfaces such as pavement, parking areas, and rooftops. Most of Greene County remains very light on this map. Stronger colors appear in a few compact centers, with thin road patterns extending between them. That makes the separation between developed places and the surrounding rural landscape easier to see than on the full land-cover map.
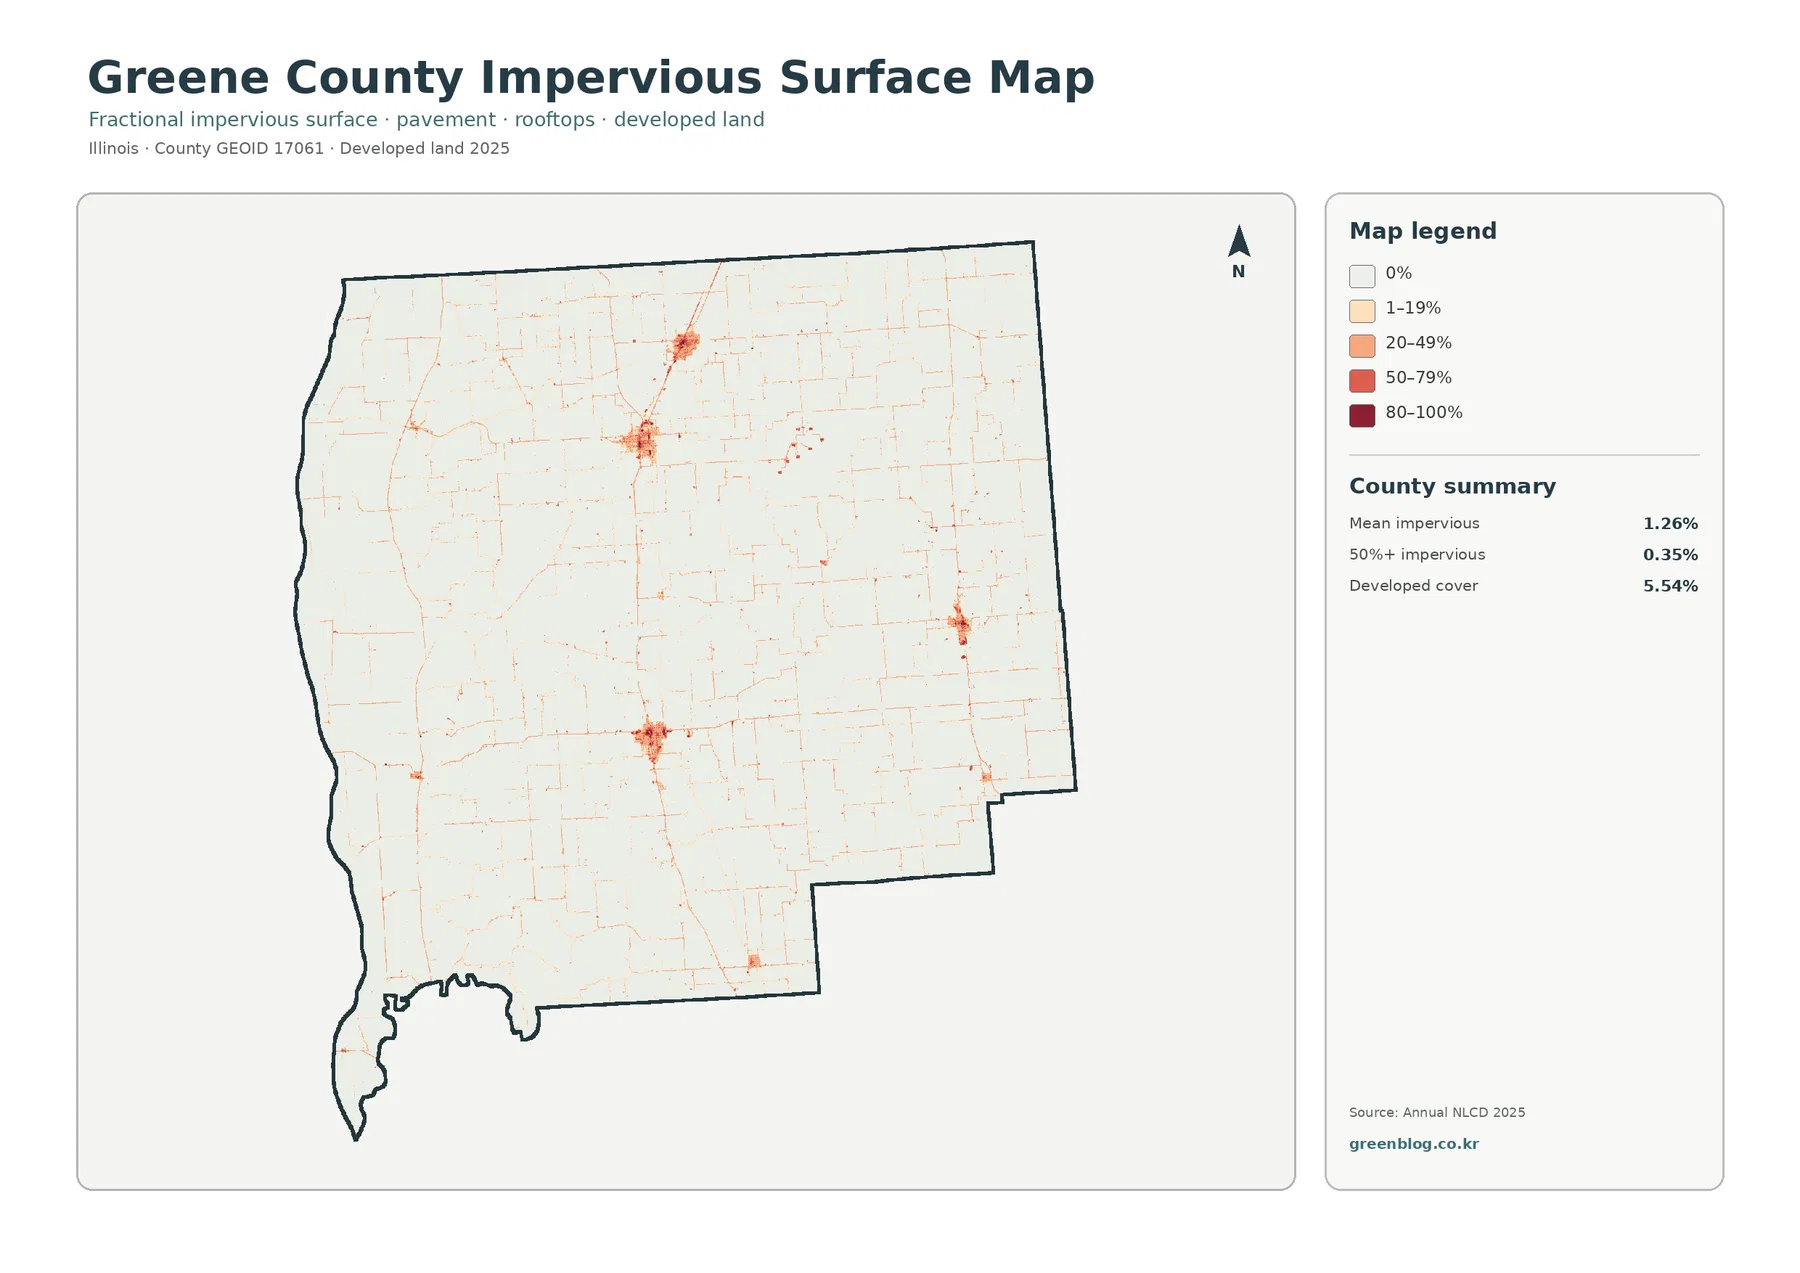
Mean impervious cover is 1.26%, and areas at or above 50% impervious cover account for 0.35%. Those values are much smaller than the 5.54% developed-land share because the two measures describe different things. A developed land-cover cell can still include lawns, trees, exposed soil, and other surfaces that absorb water. Impervious cover estimates the portion that is actually sealed by hard materials.
The low countywide average should not hide the local concentrations shown on the map. Town centers still stand out clearly from surrounding farm country. At the same time, a high impervious value is not a flood-risk or drainage diagnosis. This map is useful for locating hard-surface concentrations, but site-level water management questions require additional elevation, drainage, engineering, and local data.
The 8.75% 1985–2025 class difference is scattered across many small patches
The change map compares the land-cover classification at two endpoints: 1985 and 2025. Greene County has an 8.75% total class difference. The summary separates that into 0.62% classified as developed in the comparison, 0.68% forest loss, 0.73% agricultural loss, and 6.62% other class difference. Because the “other difference” category is by far the largest component, the total should not be described as one single type of land-use change.
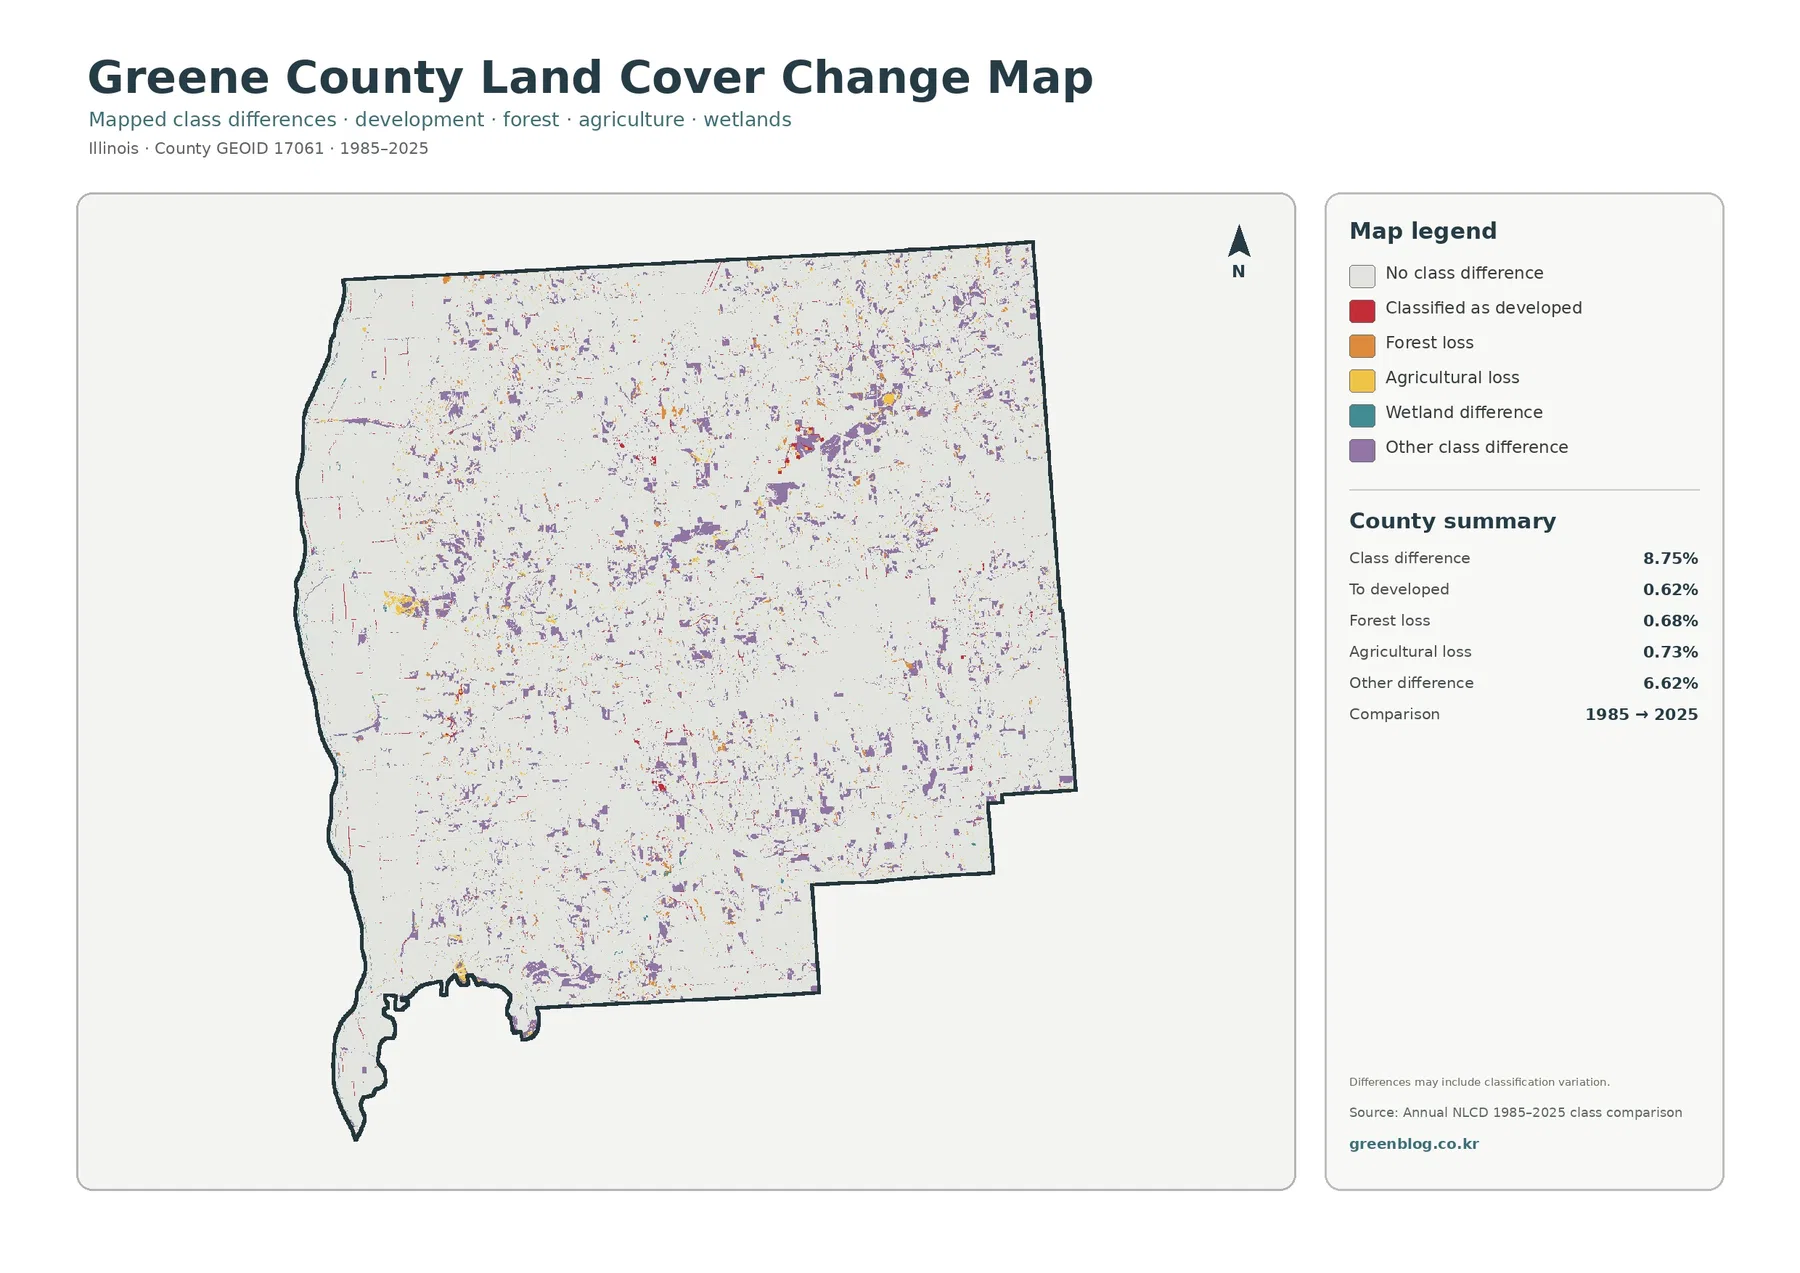
The colored cells are dispersed rather than concentrated in one large change zone. Small patches appear through the center, northeast, west-central area, and southwest. Developed-class differences are easier to notice around existing built centers and some roads, but the 0.62% figure shows that they are only a small part of the total difference.
A different color at the two endpoints can reflect a real surface change, but it can also be influenced by image conditions, classification methods, small boundary shifts, and mixed pixels. Annual NLCD commonly uses 30-meter raster cells, so one cell may contain more than one real-world surface. The change map is therefore best used to identify places that deserve a closer look with newer imagery or local records.
Choose the map by the question: overall cover, farm-versus-forest, hard surfaces, or time
Use the general land-cover map when the goal is to see agriculture, forest, water, wetlands, and developed land on one page. Use the forest-and-farmland version when the main question is how wooded cover divides the farm landscape. The impervious/developed map is the quickest way to find compact hard-surface centers and roads, while the change map is better for screening locations where the two endpoint classifications differ.
Thirty-meter raster cells simplify narrow features, so these maps are not parcel boundaries
Annual NLCD commonly represents land cover with 30-meter raster cells. A raster is a grid, and each cell summarizes a small area. A narrow road beside a field, trees along a stream, or a small wetland next to open water can be simplified when several surfaces fall inside one cell. That limitation is especially relevant along Greene County’s western water-and-wetland edge, where cover types meet across relatively narrow boundaries.
Land cover is also different from legal land use, ownership, zoning, or building permission. A wetland color is not a legal wetland determination, forest color does not identify a protected property, and developed land does not show what can be built on a parcel. Parcel-level planning requires finer official maps and, when needed, field or survey information.
Frequently Asked Questions
What is the largest 2025 land-cover class in Greene County?
Agriculture is the largest class at 73.05%. Forest is second at 17.90%, followed by developed land at 5.54%, wetlands at 2.69%, and water at 0.74%. The county is farm-dominated overall, but the western water-and-wetland edge and branching wooded cover create strong local differences.
Why is developed land 5.54% while mean impervious cover is only 1.26%?
Developed land can include grass, trees, soil, and other surfaces that still absorb water. Impervious cover estimates the harder portion such as pavement, parking lots, and rooftops. Because they measure different characteristics, the two percentages are not expected to match.
Does the 8.75% 1985–2025 class difference mean that 8.75% of the county definitely changed land use?
No. It is the share of cells whose classifications differ between the two endpoints. Real surface change may be included, but image conditions, classification methods, small boundary shifts, and mixed pixels can also contribute. The 6.62% other-difference category is the largest listed component.
Map File Information
The ZIP contains the four original JPG maps for Greene County: general land cover, forest and farmland, impervious/developed land, and the 1985–2025 land-cover comparison.
- Included Versions: land cover, forest/farmland, impervious/developed land, and land-cover change
- File Type: one ZIP containing four JPG files
Related Maps
- Adams County Illinois Land Cover Map
- Alexander County Illinois Land Cover Map
- Bond County Illinois Land Cover Map
Sources and References
- MRLC Annual NLCD Data – official access to Annual NLCD land-cover and impervious-surface datasets.
- USGS Annual NLCD Land Cover Classification – official background on land-cover classes and classification.
- U.S. Census Bureau TIGER/Line Shapefiles – official county boundary reference data.
- Greene County IL Government – About Greene County – county background and location context.
- USDA 2022 Census of Agriculture – Greene County Profile – county agricultural context used separately from NLCD land-cover percentages.
Green Map creates custom-edited map images using open geographic data sources such as geoBoundaries, Natural Earth, OpenStreetMap, and government open data.
These maps are edited visual materials, not raw data files, and are provided for education, documents, presentations, and graphic reference.