Fulton County, Illinois, does not read as a simple block of farm country on the 2025 land-cover maps. Agriculture is the largest class at 62.02%, yet forest covers another 25.86% and breaks the farm pattern into irregular pieces across much of the county. Developed land accounts for 6.54%, while water and wetlands add 3.22% and 1.96%. The eastern edge is especially distinctive because broad water areas sit beside wooded and wetland cover.
Four map views are provided on this page: current land cover, forest and farmland, impervious surface and developed land, and the mapped 1985–2025 class comparison. The four original JPG maps are also available together in one ZIP download. Looking at the maps separately helps distinguish the county’s present surface cover from the harder paved surfaces and from places where the two comparison years were classified differently.
Table of Contents
Farm fields dominate the total area, but forest shapes the county almost everywhere you look
The broadest color on the current land-cover map is the yellow used for agriculture. Large farm blocks appear in the north, west, and southeast, but green forest repeatedly cuts through them. In the central and southern portions of the county, wooded cover branches into narrow and broad strips instead of forming one isolated mass. That distribution is why the county can be 62.02% agricultural and still look strongly wooded on a map.
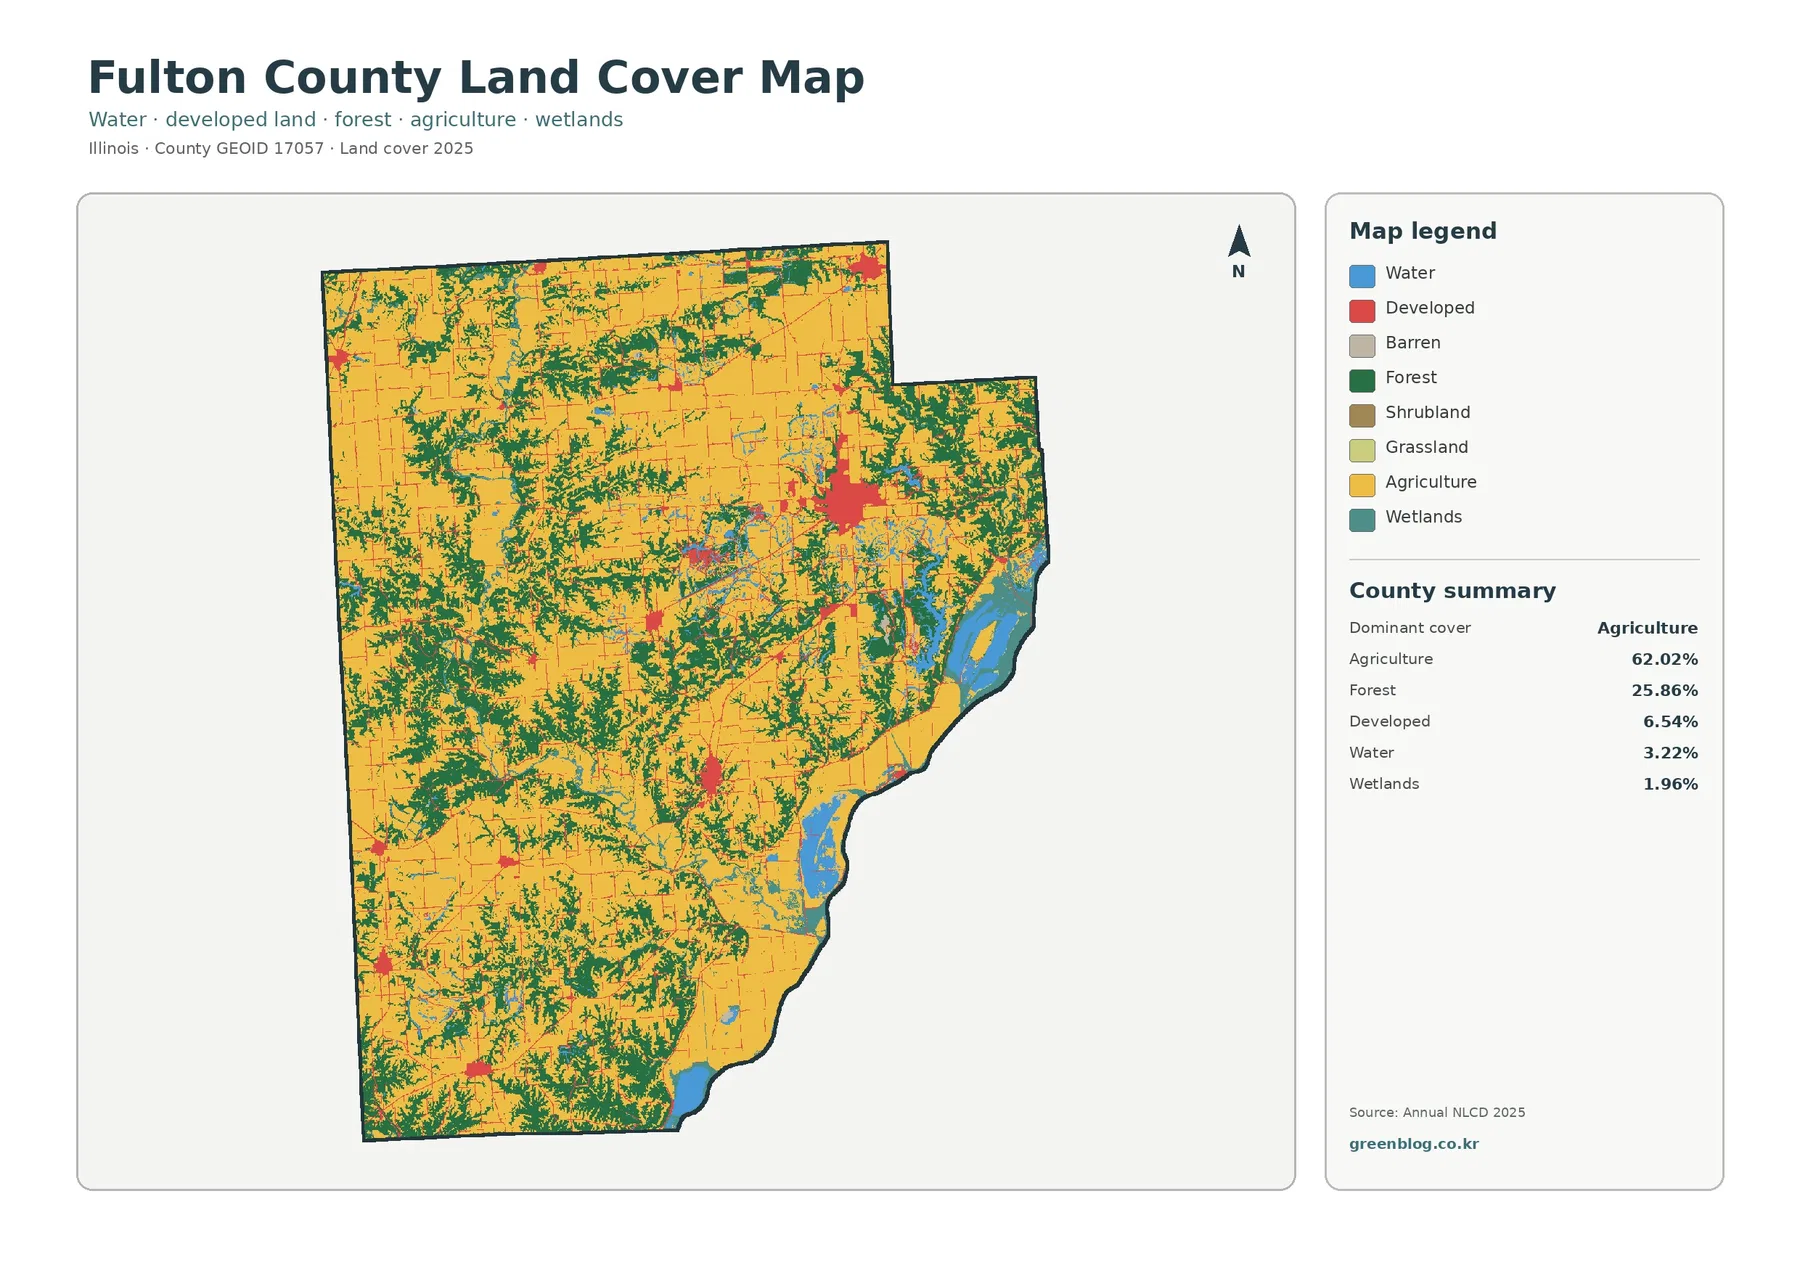
Developed land is much smaller by area, at 6.54%, but it stands out because the red class has strong contrast against fields and woods. One larger cluster appears in the north-central to northeastern part of the county, with several smaller clusters elsewhere. These red areas should not be read as municipal boundaries. The map classifies surface cover, so it does not show legal city limits, zoning, parcel ownership, or permitted land use.
The forest-and-farmland view makes the county’s broken agricultural pattern easier to see
Removing much of the visual competition from the other classes changes the way Fulton County reads. The forest-and-farmland map makes the yellow agricultural blocks and green wooded strips the main story. Broad field areas remain easy to identify, especially toward the north and west, but the green network becomes more noticeable through the center, south, and parts of the northeast. In many places the forest seems to divide one agricultural area from another rather than simply sitting at the county’s edge.
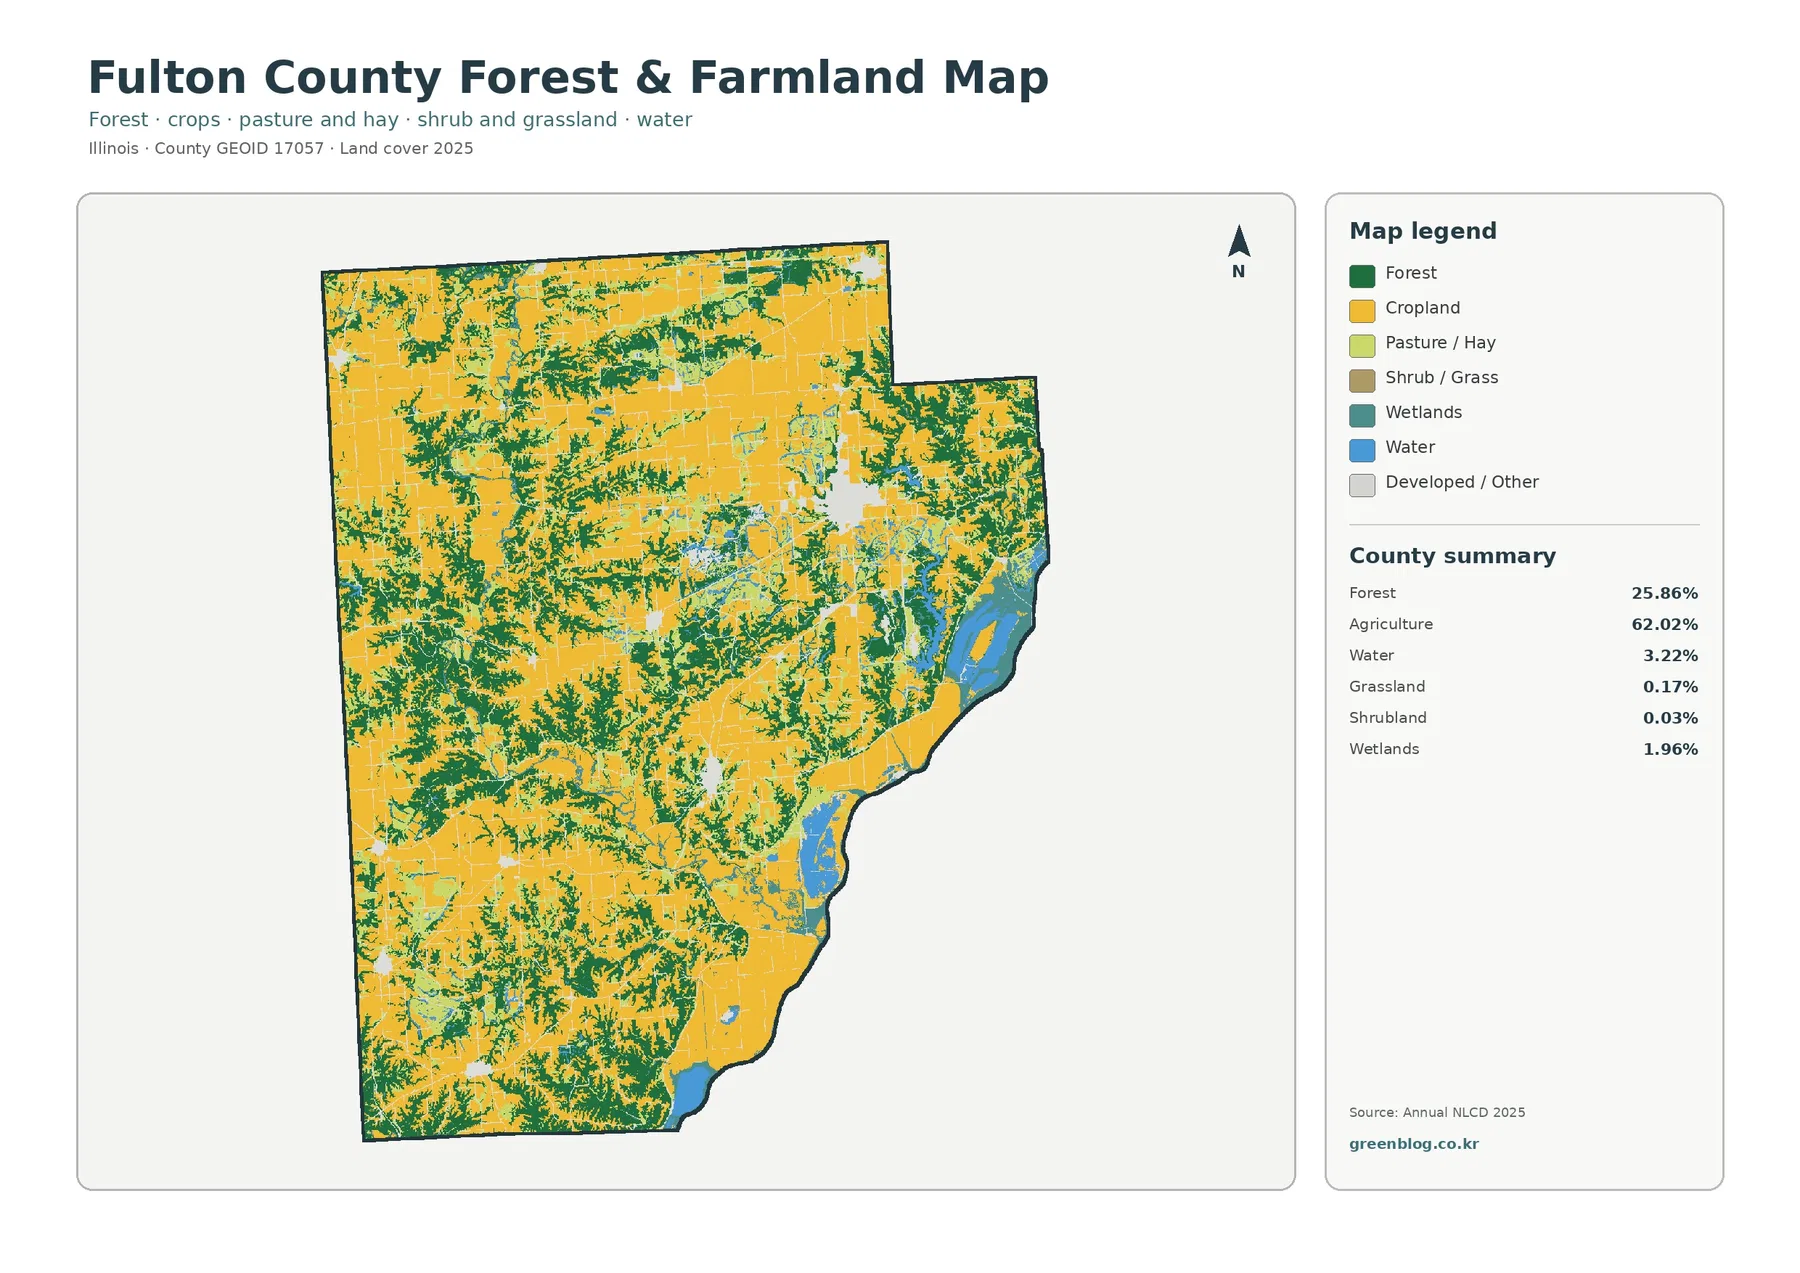
This pattern matters when Fulton County is compared with another agricultural county. Two counties can have similar percentages of farmland but look very different if one has a few compact forests and the other has wooded cover threaded throughout the farm landscape. Fulton County frequently shows the second pattern. The percentage summary explains how much land belongs to each class, while the map explains how those classes are arranged.
Impervious cover is sparse countywide and concentrated around a few centers and road corridors
The impervious-surface map has a very different appearance from the two land-cover maps. Most of Fulton County is pale because fields, forests, wetlands, and water do not contain large amounts of pavement or rooftops. Thin lines cross the county along roads, while several compact clusters show where harder surfaces are more concentrated. The largest cluster appears north of the county center, and smaller ones are scattered to the west, south, and near other road junctions.
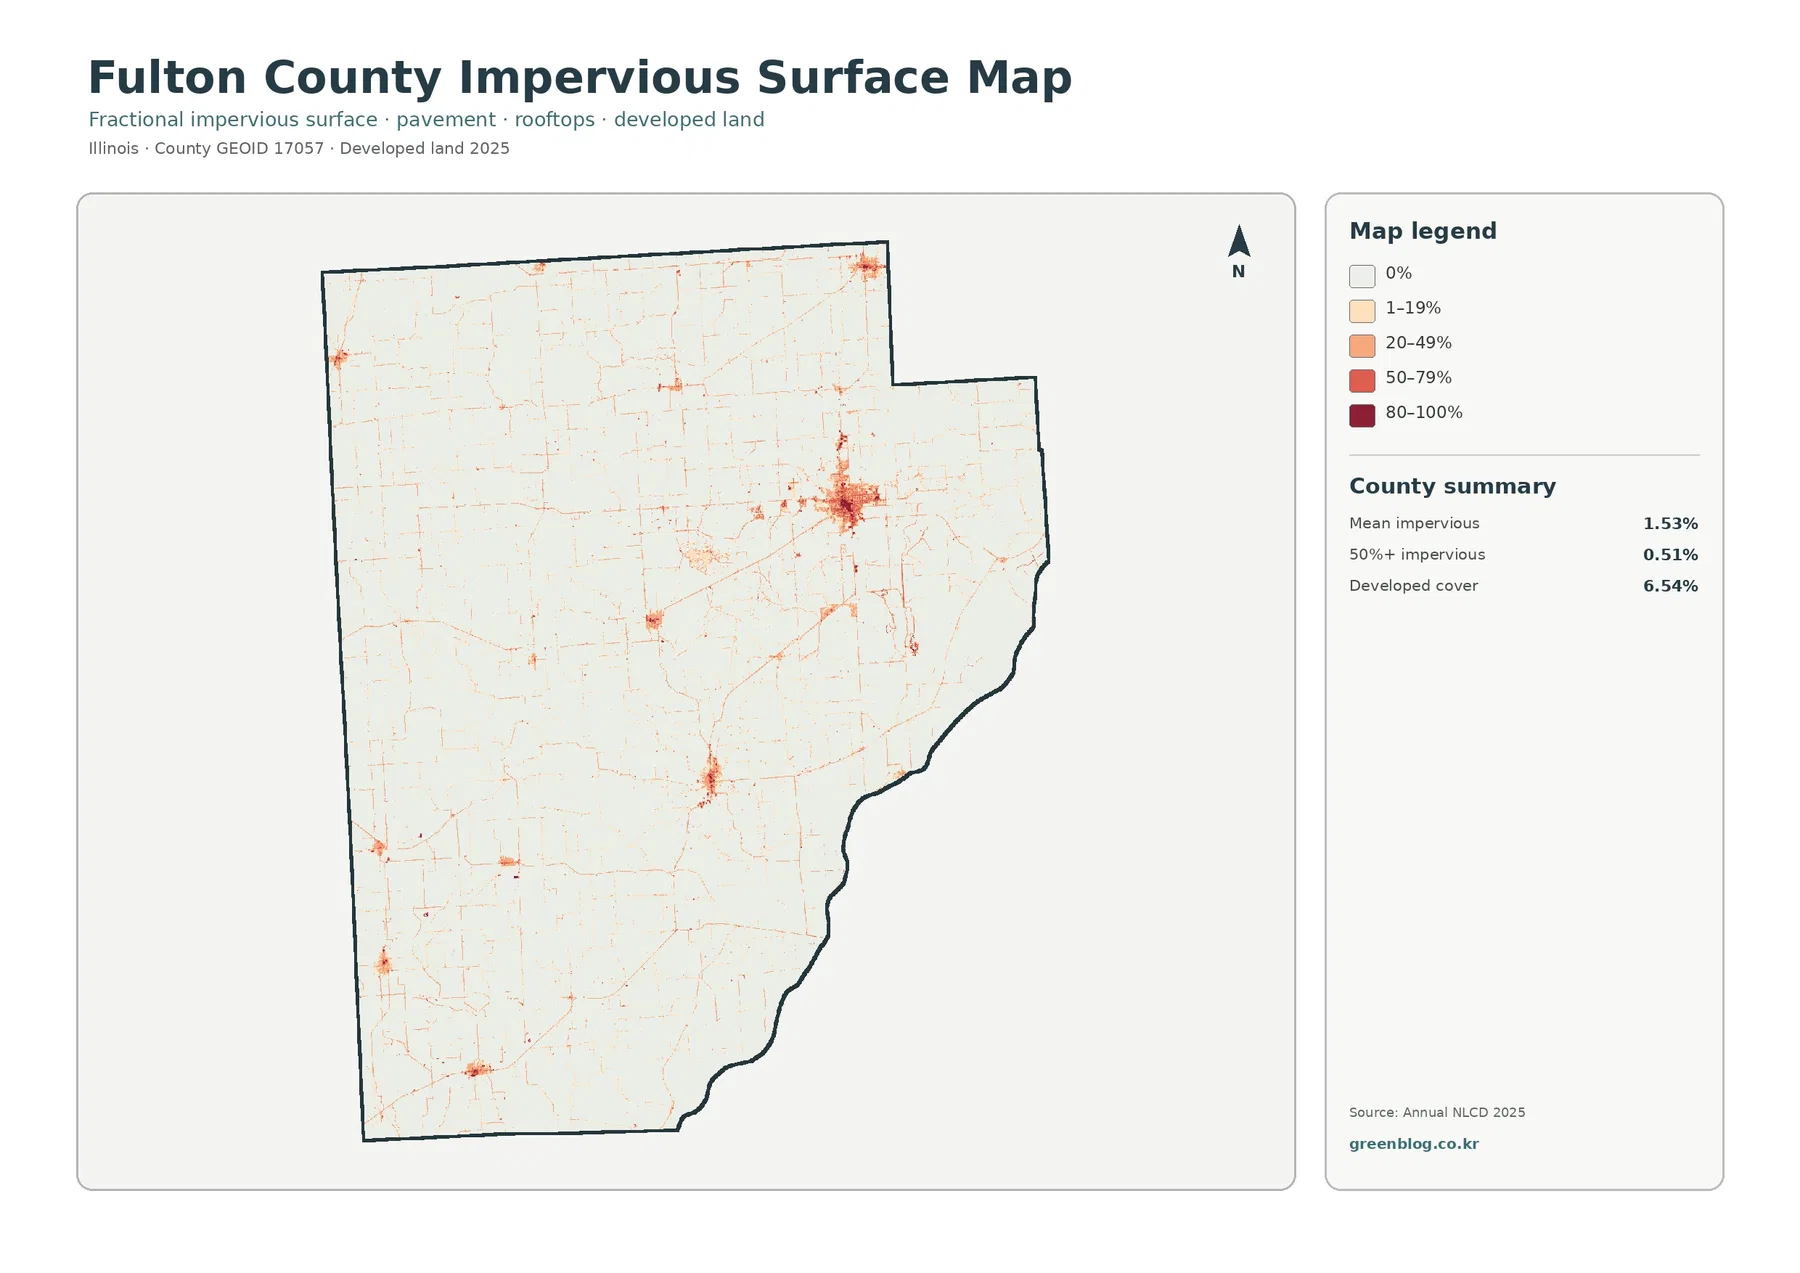
Mean impervious cover is 1.53%, and only 0.51% of the county is mapped above 50% impervious. Those values are far below the 6.54% developed-land share because the measures describe different things. A developed land-cover cell can include lawns, trees, bare soil, and other surfaces where water can infiltrate. Impervious cover focuses on hard surfaces such as roofs, pavement, and parking areas.
Water along the eastern side adds a second major landscape contrast beyond farms and forest
The eastern edge contains the largest continuous blue areas in the county. Water is only 3.22% of Fulton County in the summary, but it is strongly concentrated, so its shape is visually prominent. Teal wetland cover, which accounts for 1.96%, appears in and around parts of the same eastern zone. Nearby forest and agriculture create short-distance transitions among several cover classes rather than one uniform shoreline band.
The 1985–2025 comparison records an 11.74% class difference, mostly in the “other” category
The change map compares the land-cover classification from 1985 with the 2025 classification. Across Fulton County, 11.74% of the mapped area is shown as a class difference between the two endpoints. The summary separates 0.87% as classified to developed, 1.37% as forest loss, 1.64% as agricultural loss, and 7.66% as other class difference. The last category is by far the largest, so the total difference should not be described as one single type of land conversion.
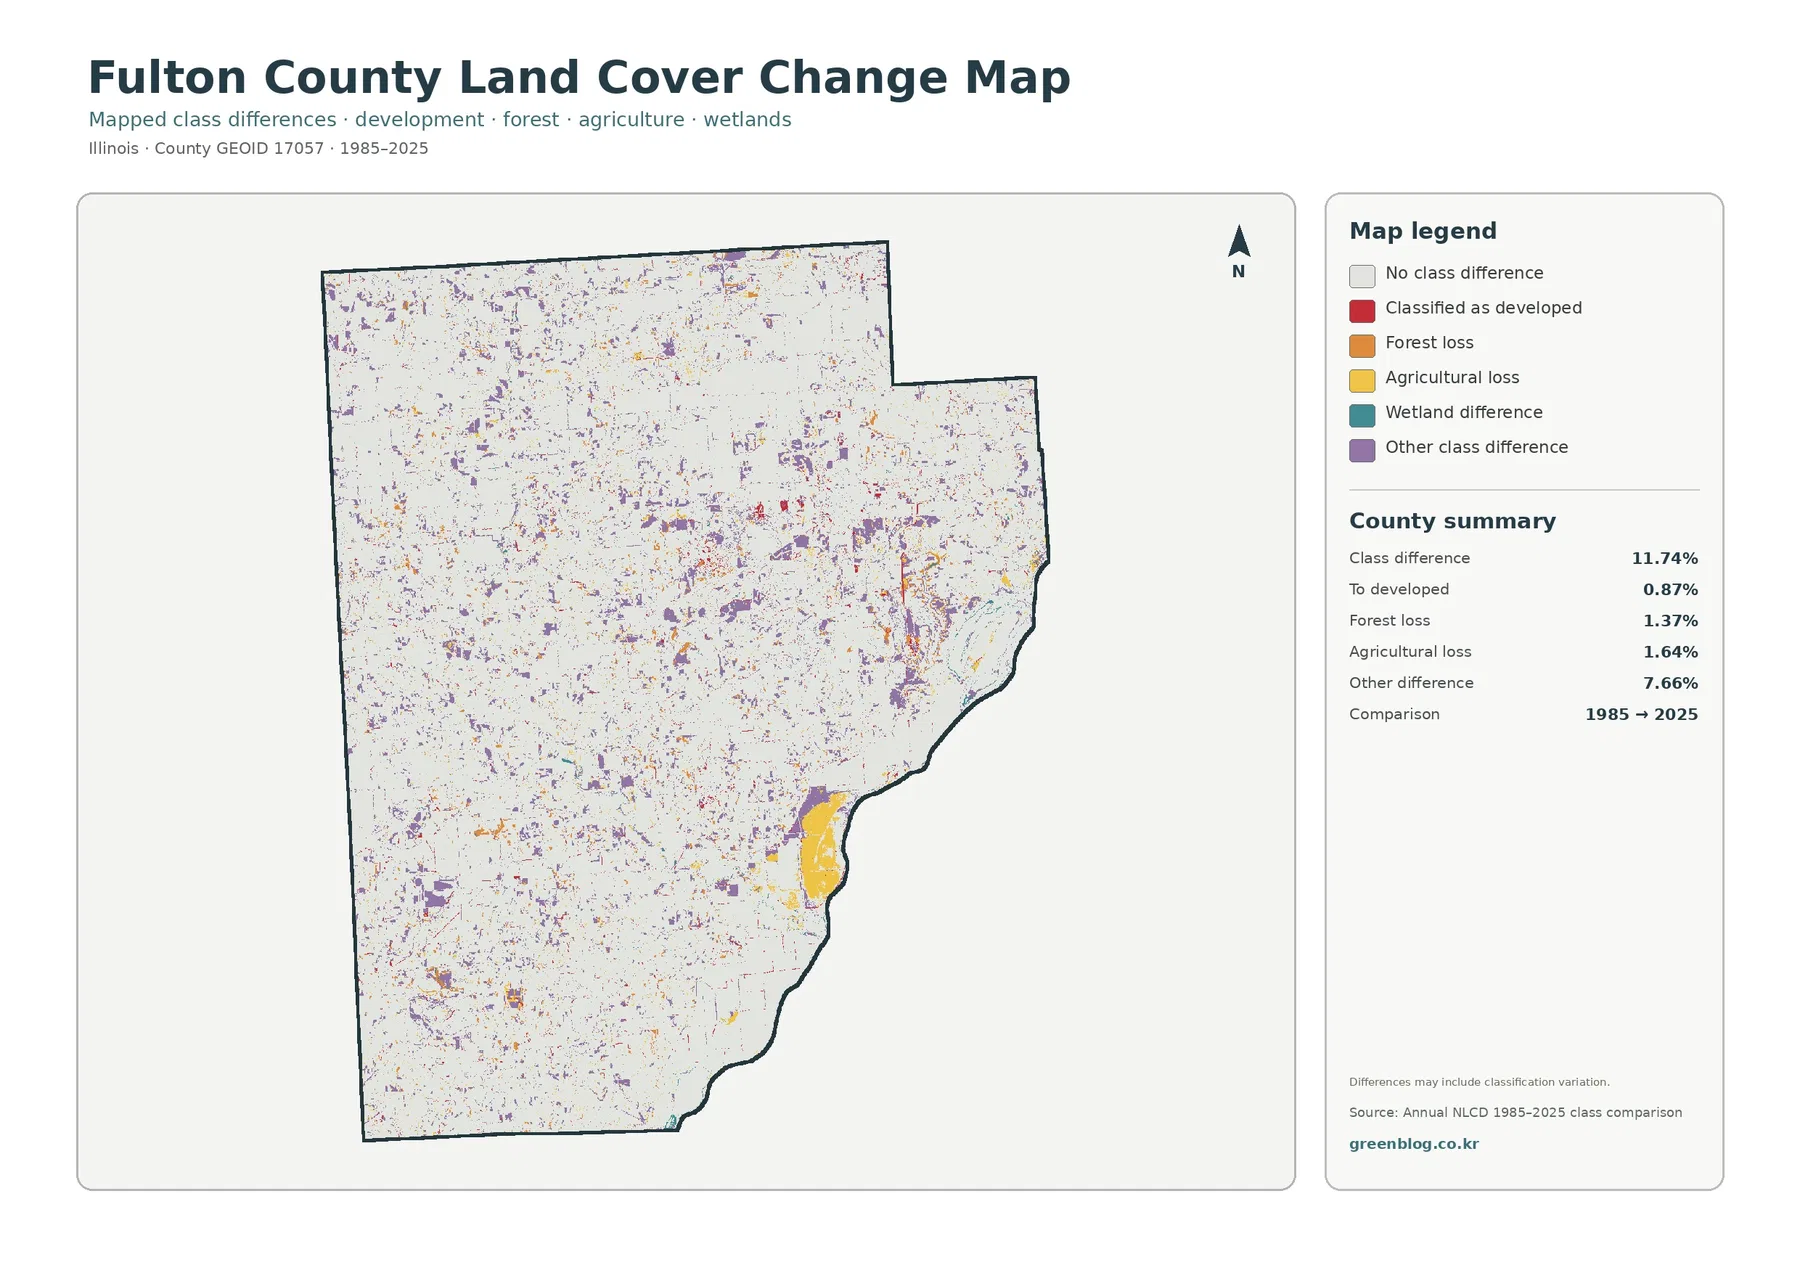
Most of the colored difference pixels are scattered in small patches rather than forming one continuous front. Purple “other” differences appear widely across the county. Red areas classified to developed are more limited and tend to sit near existing developed clusters or linear features. A larger yellow agricultural-loss area is visible near the eastern side, but the map alone cannot establish why that location changed classification.
A class difference can represent real land-cover change, but it can also reflect differences in imagery, classification rules, boundary placement, or mixed pixels. A mixed pixel contains more than one surface type within the same raster cell, such as both trees and crops or both water and wetland vegetation. If a particular location matters, intermediate Annual NLCD years and aerial imagery should be checked before describing the mapped difference as a confirmed land conversion.
Choose the map according to the question rather than trying to make one layer explain everything
For a quick picture of present-day Fulton County, start with the current land-cover map. It shows the balance among agriculture, forest, developed land, water, and wetlands in one view. If the topic is specifically the relationship between fields and woods, the forest-and-farmland map removes distractions and makes the irregular green network much easier to compare with the large agricultural blocks.
Raster scale and classification limits matter most along narrow woods, roads, and shorelines
Annual NLCD land cover is raster data, meaning the landscape is divided into grid cells and each cell receives a representative classification. Standard land-cover products use a 30-meter grid. Narrow roads, small ponds, thin tree lines, and complicated field edges can therefore be simplified. A cell that contains several surface types may still display only one dominant class, so the map should not be treated as a survey of exact ground boundaries.
Used within those limits, the maps are strong orientation tools. They show that Fulton County is primarily agricultural but far from uniform: forest occupies more than one quarter of the county, water is concentrated along the east, developed and impervious surfaces remain clustered, and classification differences are dispersed rather than dominated by one change type. That combination provides a useful starting point for more detailed local research.
Frequently Asked Questions
What is the largest land-cover class in Fulton County?
Agriculture is the largest 2025 class at 62.02%. Forest is also substantial at 25.86%, followed by developed land at 6.54%, water at 3.22%, and wetlands at 1.96%. The map therefore shows a farm-dominated county with extensive wooded cover rather than a uniform field landscape.
Why does the eastern water area look so important if water is only 3.22% of the county?
Most of the mapped water is concentrated along the eastern side instead of being spread evenly across Fulton County. A small countywide percentage can have a strong visual effect when it forms a large, continuous feature in one part of the map.
Does the 11.74% class difference mean that 11.74% of Fulton County definitely changed land use?
No. It is the area where the 1985 and 2025 land-cover classifications differ. The total includes 0.87% to developed, 1.37% forest loss, 1.64% agricultural loss, and 7.66% other class difference. Classification and mixed-pixel effects should be considered before confirming change at a specific site.
Map File Information
The original JPG set includes Fulton County’s 2025 land cover, forest and farmland, impervious/developed land, and the 1985–2025 land-cover class comparison.
- Included Versions: land cover, forest & farmland, impervious & developed land, and 1985–2025 land-cover change
- File Type: one ZIP containing four JPG files
- Intended Use: printing, teaching, presentations, county comparison, and reference before more detailed local research
Related Maps
- Adams County Illinois Land Cover Map
- Alexander County Illinois Land Cover Map
- Bond County Illinois Land Cover Map
Sources and references
- MRLC Annual NLCD Data – official access to Annual NLCD land-cover and impervious-surface datasets used for the map summaries.
- USGS Annual NLCD Land Cover Classification – official explanation of Annual NLCD land-cover classes and classification concepts.
- U.S. Census Bureau TIGER/Line Shapefiles – official geographic boundary source for U.S. counties, including Fulton County.
Green Map creates custom-edited map images using open geographic data sources such as geoBoundaries, Natural Earth, OpenStreetMap, and government open data.
These maps are edited visual materials, not raw data files, and are provided for education, documents, presentations, and graphic reference.