Cook County is dominated by developed land in the supplied 2025 classification. Developed cover accounts for 85.24%, while forest, wetlands, agriculture, and water occupy much smaller shares. This Cook County Illinois Land Cover Map set makes that urban dominance clear while also showing where natural cover remains along the county’s outer areas and within narrow corridors.
Four views are included: current land cover, forest and farmland, impervious surface and developed land, and a 1985–2025 class-difference comparison. The WebP previews support the discussion below, and the four original 2480 × 1754-pixel JPG maps are available together in one ZIP for reference, teaching, and presentation work.
Table of Contents
Impervious surface separates the dense urban core from greener outer pockets
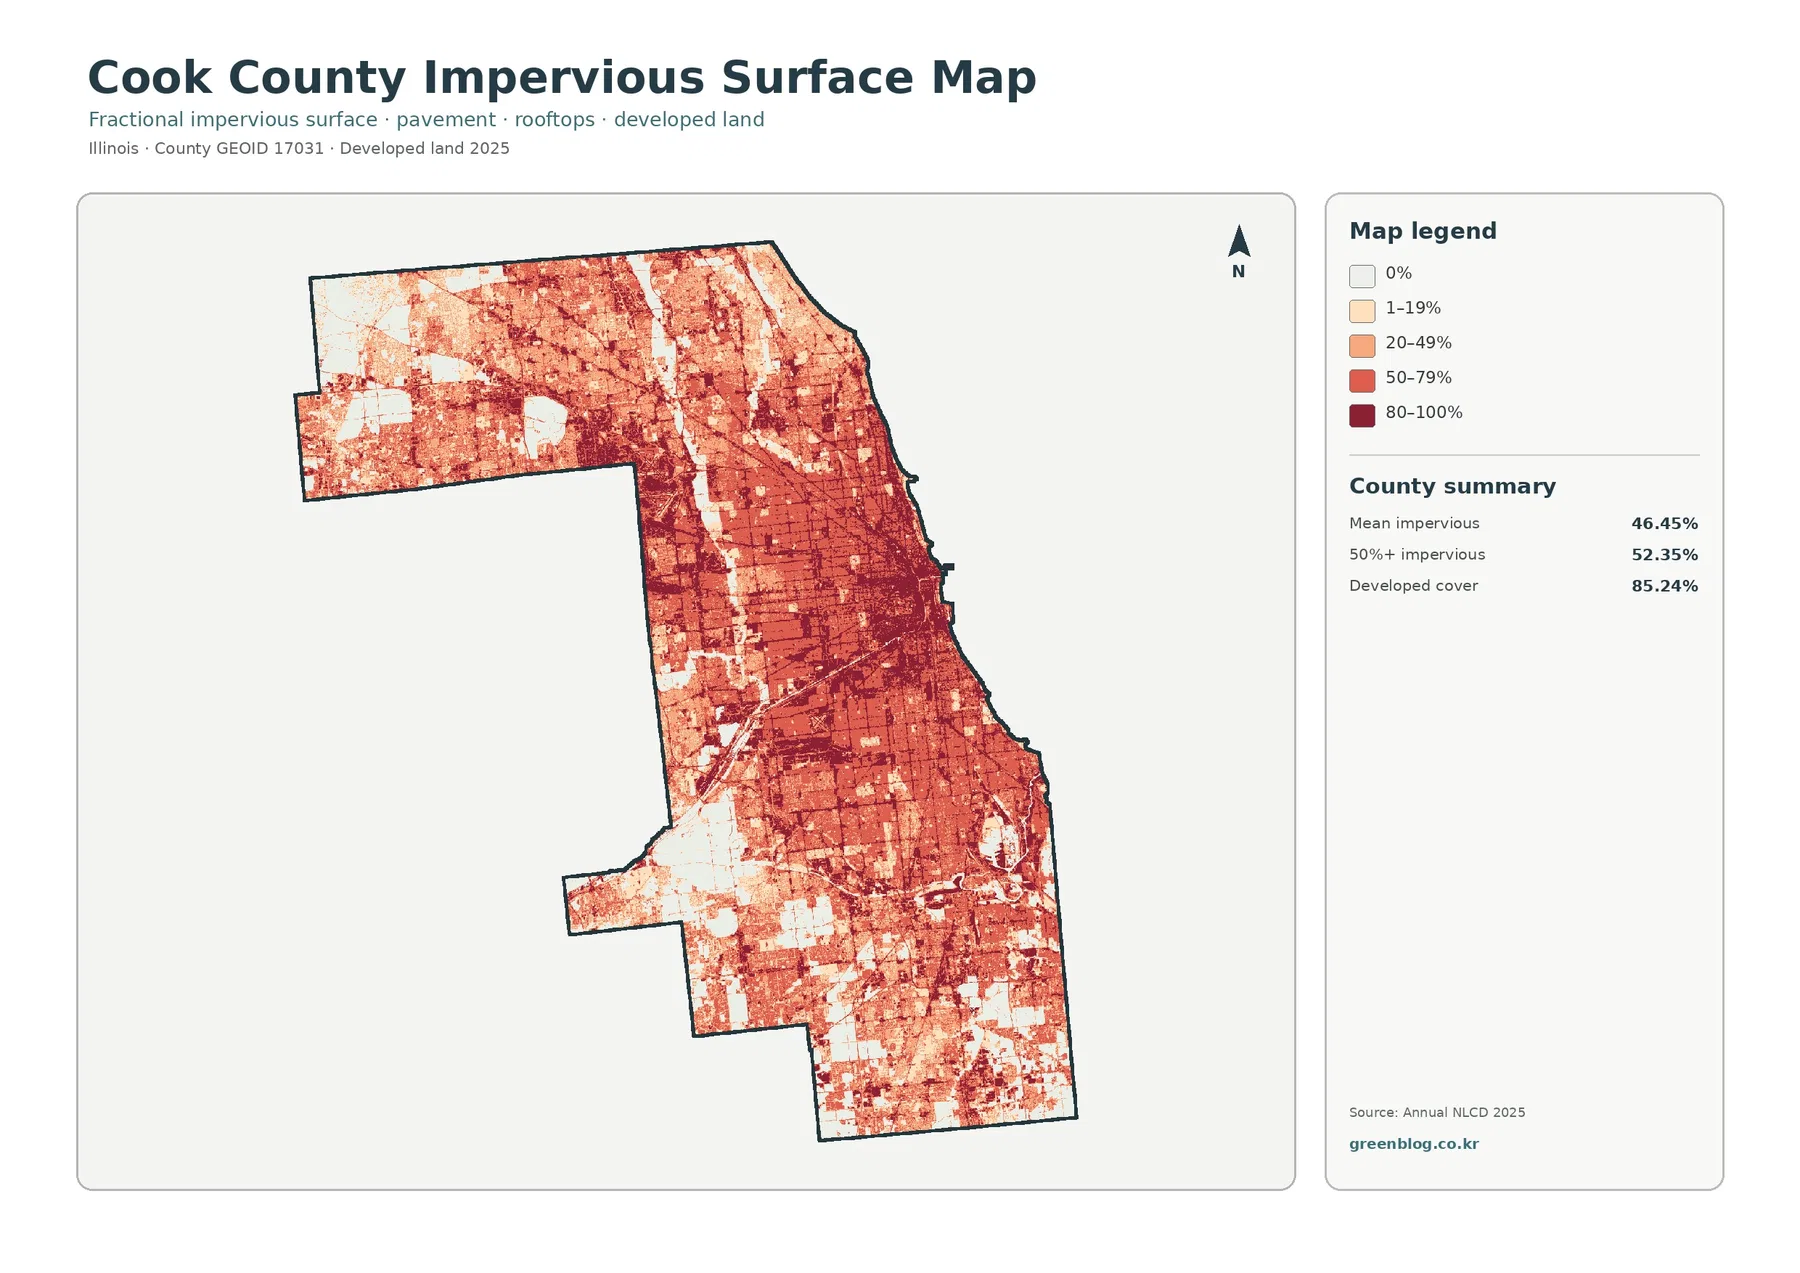
Cook County’s mean impervious cover is 46.45%, and 52.35% of the county is mapped at 50% impervious or greater. Those values are unusually important here because developed land is not merely a collection of isolated town centers. Darker impervious classes form a broad, connected field across the central and eastern portions of the county, with dense blocks continuing south. Lighter areas become more common toward parts of the northwest, southwest, and far south, where open land and natural cover interrupt the urban fabric.
The 85.24% developed share is higher than the 46.45% mean impervious value because the two measurements describe different things. A developed land-cover class can contain houses, roads, yards, trees, soil, and other permeable surfaces within the same 30-meter cell. Impervious data concentrates on the fraction covered by roofs, pavement, and similar hard materials. A neighborhood can therefore be classified as developed even when a large part of its surface still absorbs water.
This distinction is useful when the map is used to discuss runoff or green infrastructure, but it should not be turned into a flood-risk map. Flooding also depends on rainfall, drainage systems, elevation, soils, waterways, sewer capacity, and local engineering. Cook County’s current environmental policy work discusses permeable surfaces, green stormwater infrastructure, wetland restoration, and runoff reduction, which gives the impervious map a useful planning context without making it a substitute for a hydrologic study.
The 2025 overview shows how little undeveloped cover remains countywide
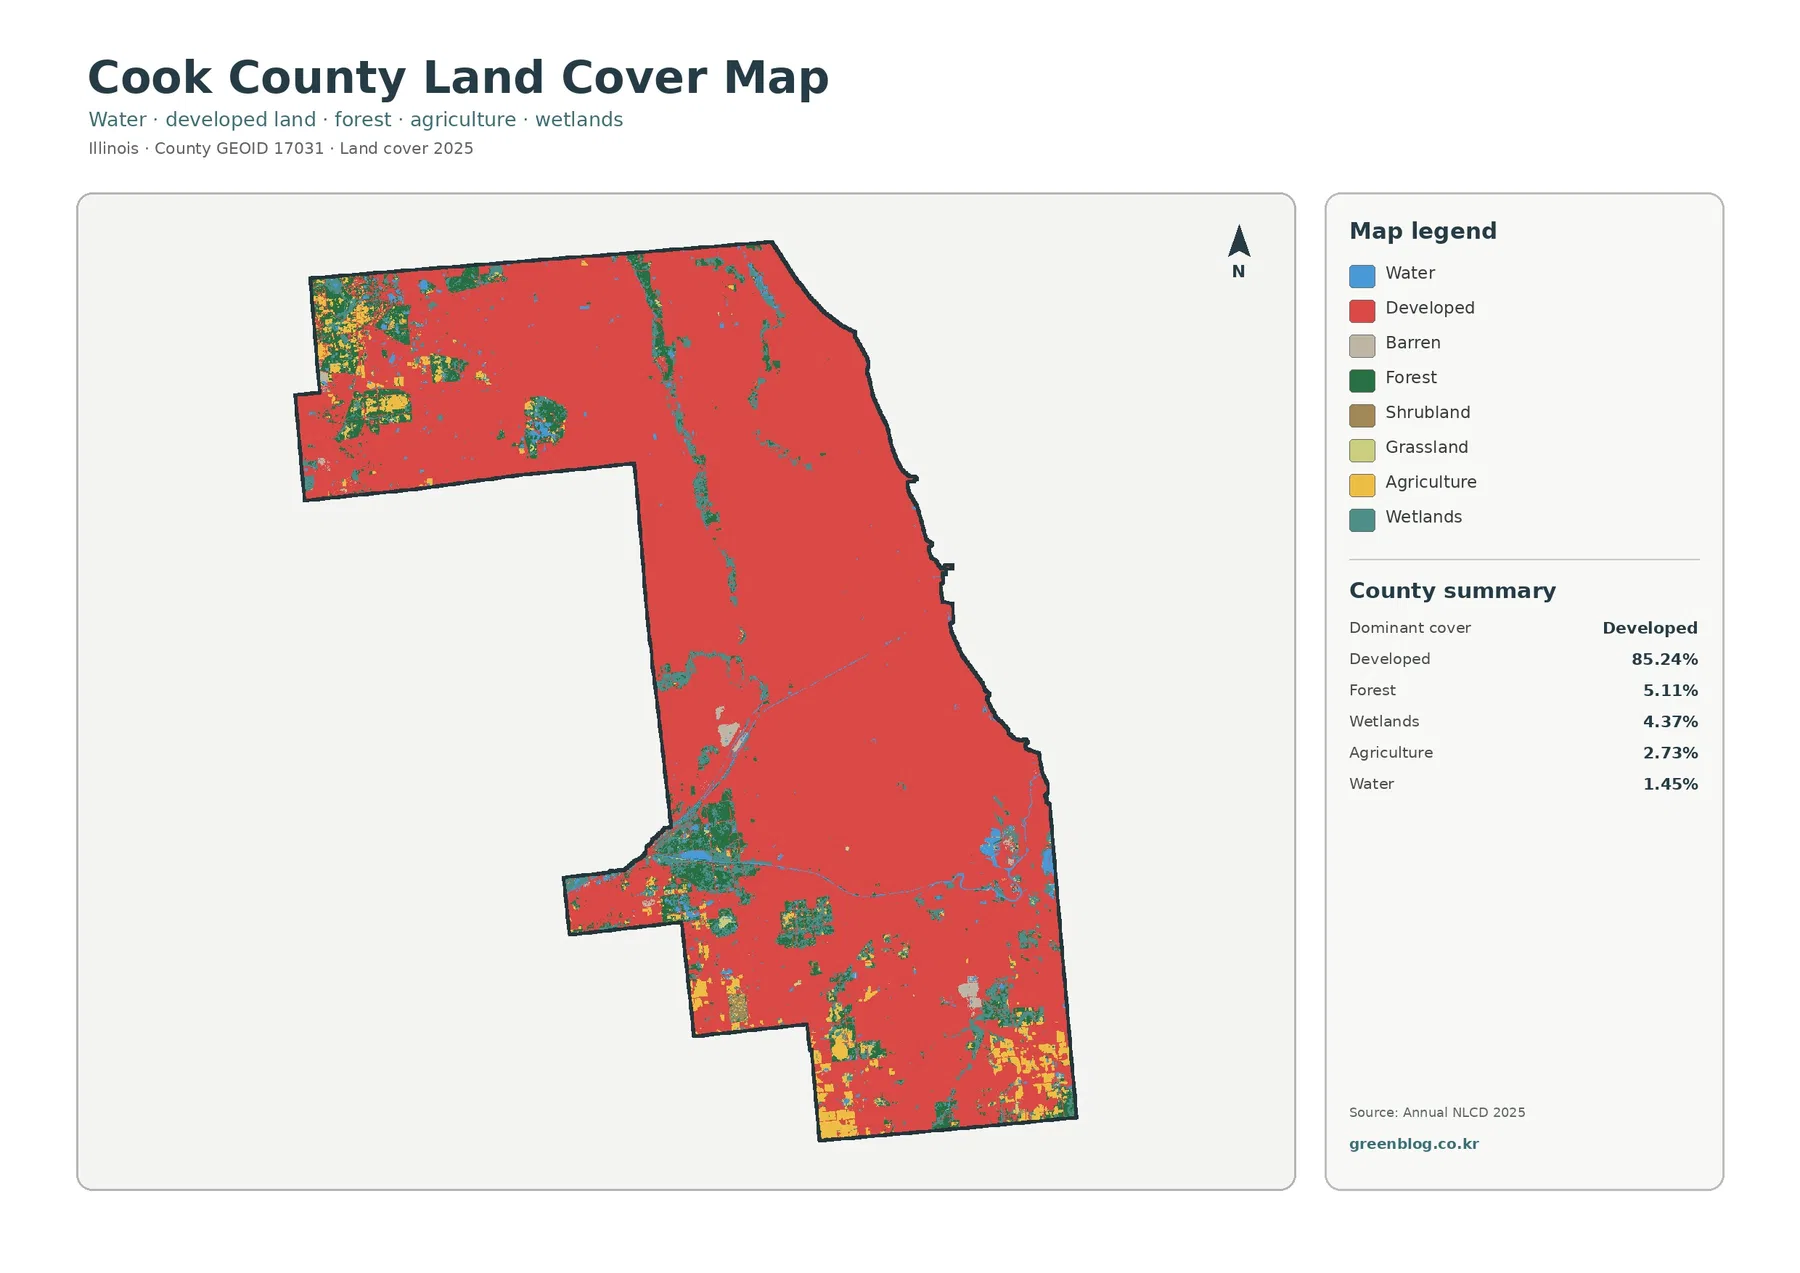
On the general land-cover map, developed land covers nearly the entire central and eastern body of the county and remains extensive in the northern and southern sections. The county summary lists forest at 5.11%, wetlands at 4.37%, agriculture at 2.73%, and water at 1.45%. Because developed land is so dominant, the smaller categories are easiest to understand by looking at their location rather than their percentages alone.
Forest and agricultural cover become more visible toward the northwestern edge and in parts of the south. Wetlands frequently appear as narrow teal traces or irregular patches rather than one large block. Small blue water areas occur in several places, while the county’s eastern boundary follows the Lake Michigan side of the region. The 1.45% water statistic should be read as a land-cover result within the mapped county area, not as a measurement of Lake Michigan itself.
The broad red area should not be treated as a municipal boundary or zoning map. Land cover describes the physical surface detected and classified from imagery. It does not identify ownership, legal land use, development rights, parcel limits, or the exact boundary of Chicago and its suburbs. Those questions require current county and municipal GIS layers. The value of this image is its consistent countywide view of what covers the ground, not its ability to answer legal property questions.
Removing the urban background reveals a network of forest, wetlands, and limited farmland
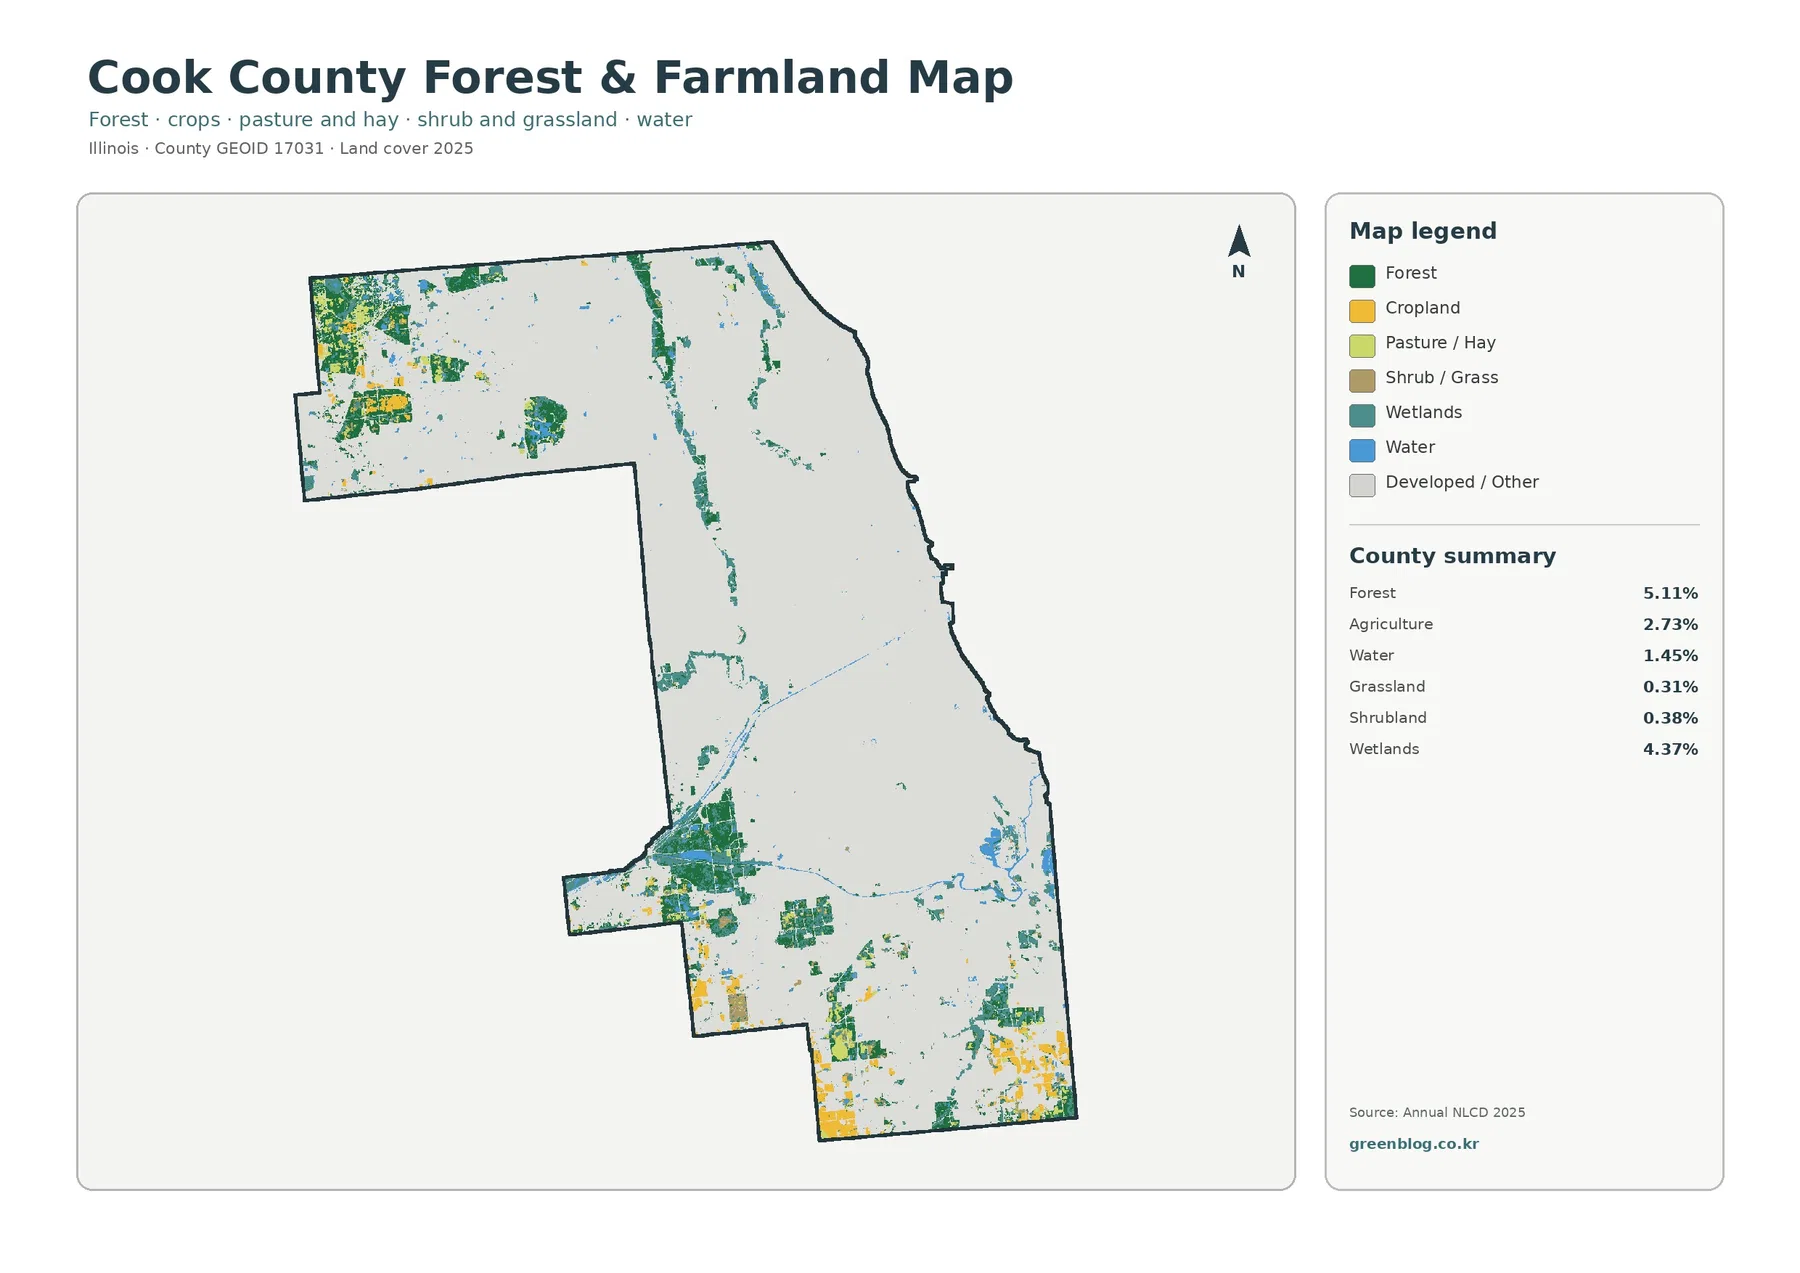
The forest-and-farmland view changes the visual balance of the county. Once most developed surfaces fade to a pale background, wooded areas in the northwest and additional green patches in the southwest and south become easier to follow. Agriculture is only 2.73% countywide, yet yellow cropland and related agricultural colors form recognizable pockets near the outer edges. Cook County therefore retains a small but visible rural component despite the overwhelming developed share.
Wetlands account for 4.37%, a share close to the 5.11% forest total, but their shapes are different. Many wetland areas form thin corridors, branching strips, or irregular patches associated with low-lying natural areas and waterways. Grassland is 0.31% and shrubland 0.38%, so those categories usually appear as small pieces mixed among forest, wetland, agricultural, and developed surroundings. Water covers 1.45%, again appearing as multiple water bodies rather than one countywide mass.
The official Forest Preserves of Cook County page says the district manages more than 70,000 acres of natural areas and open space, including forests, woodlands, savannas, prairies, and wetlands. That information helps explain why substantial green and teal patches remain inside an intensely urban county. It does not mean every forest or wetland cell on this NLCD map lies inside a Forest Preserve. Ownership and preserve boundaries come from separate administrative datasets and should be checked independently.
Most of the 15.61% endpoint difference is not labeled as new development
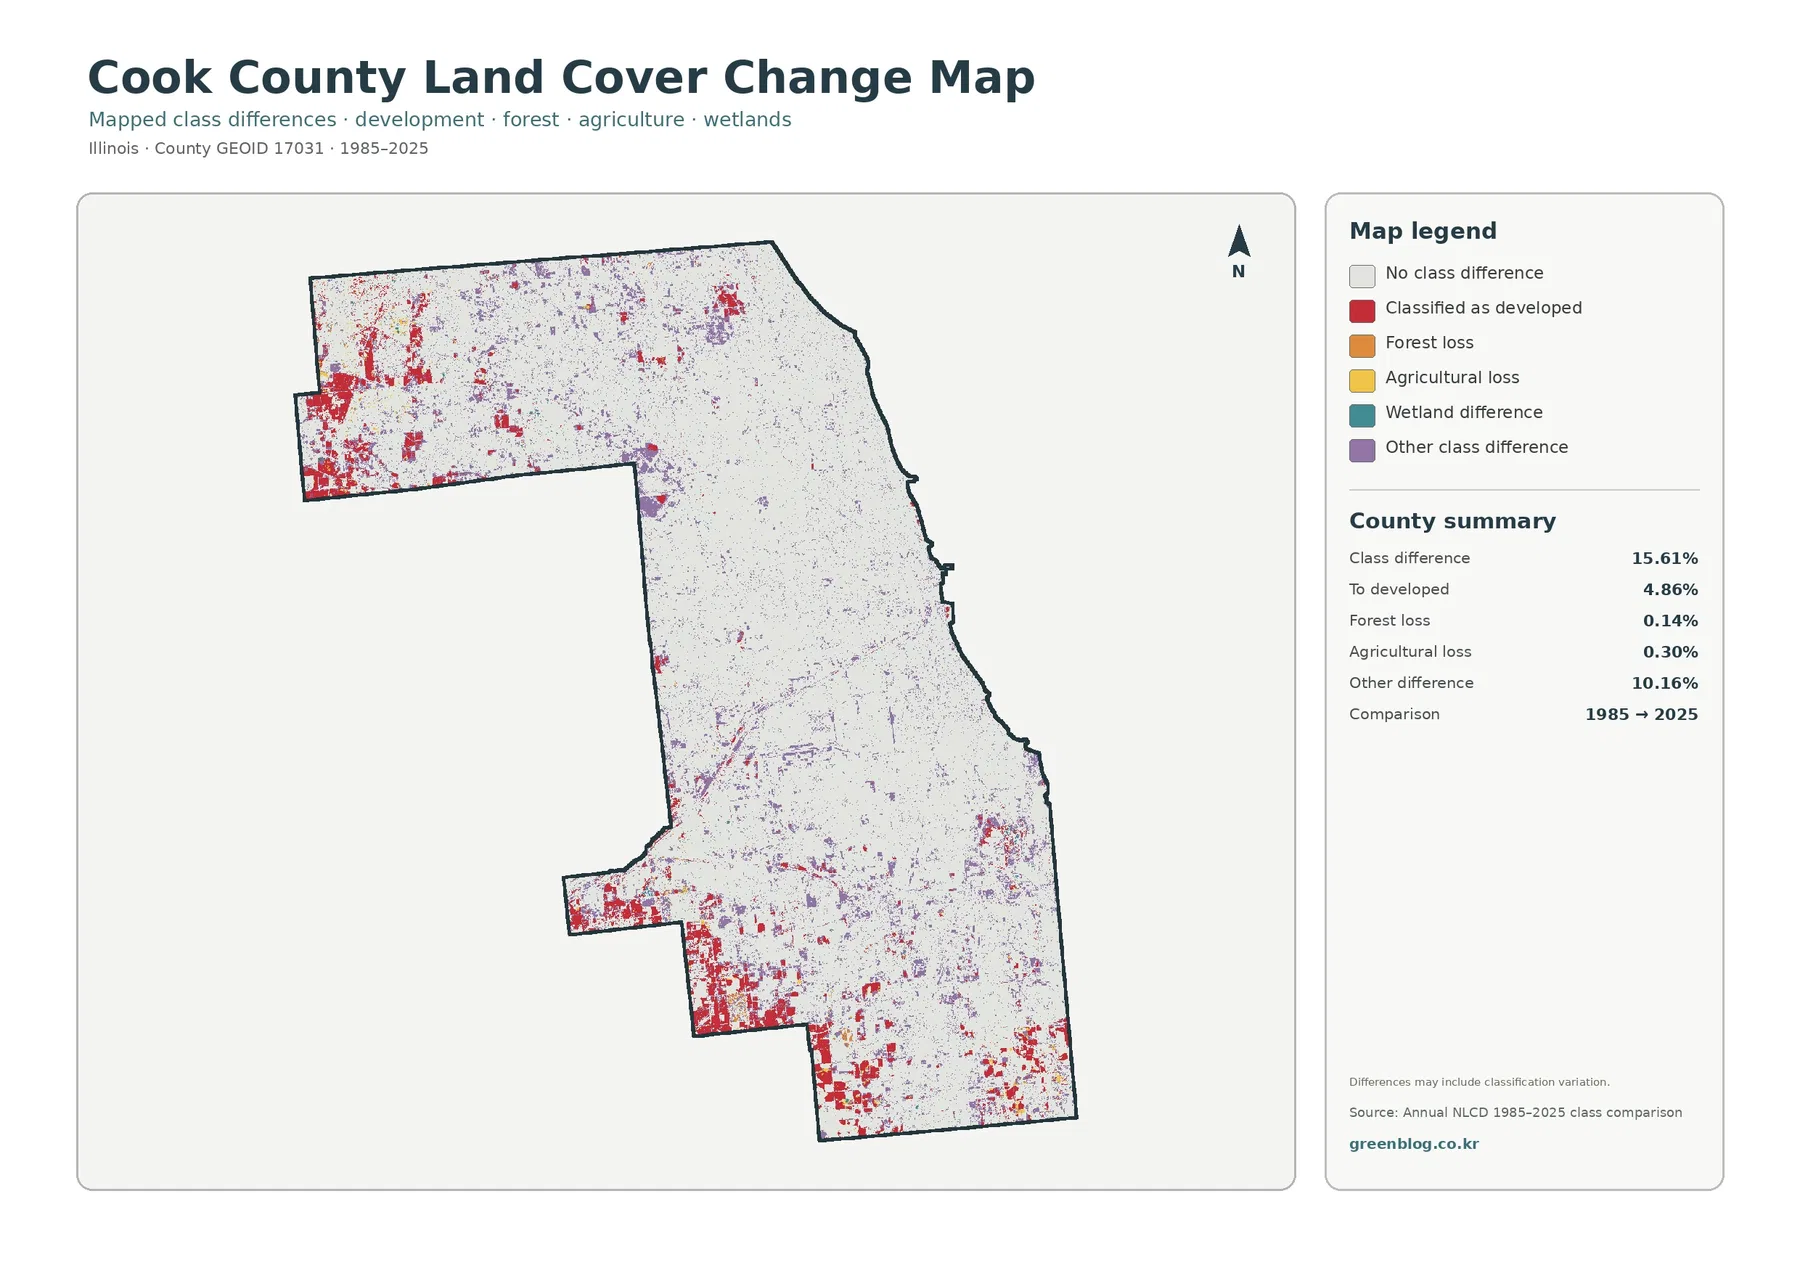
The endpoint comparison reports 15.61% total class difference between 1985 and 2025. Of the listed components, 4.86% is classified as developed at the 2025 endpoint, 0.14% is forest loss, 0.30% is agricultural loss, and 10.16% is other class difference. Wetland difference appears in the legend but does not have a separate percentage in the supplied summary. A residual calculation should therefore not be presented as an official wetland-change value.
Red developed-conversion cells are especially noticeable in the northwestern and western projection of the county and across several southwestern and southern areas. Within the already dense urban core, smaller changes appear as a fine scatter rather than as one new solid block. Purple other-difference cells occur widely enough to matter because “other difference” is the largest numerical component. The pattern shows why the total 15.61% cannot be described simply as urban expansion.
A class labeled as “loss” describes an endpoint change, not the cause. A cell that was forest in 1985 and another class in 2025 could reflect development, vegetation management, storm effects, classification variation, or another process. Likewise, a cell classified as developed at the later endpoint does not reveal the year a building or road appeared. Investigating a specific project requires intermediate aerial imagery, permits, land records, and local planning information.
Use the four views to answer different Cook County questions without mixing their meanings
For a general county profile, begin with the 2025 land-cover overview because it immediately establishes the 85.24% developed share and the locations of the remaining natural categories. If the question is about open space, woodland, agriculture, or wet ground, switch to the forest-and-farmland image so the urban background no longer overwhelms the smaller classes. Use the impervious map when the subject is hard-surface intensity, and bring in the 1985–2025 comparison only when the discussion is specifically about endpoint differences.
The pair of developed and impervious values is particularly useful in classrooms. Students can compare 85.24% developed cover with a 46.45% mean impervious surface and see that “developed” does not mean “completely paved.” A second comparison can use forest at 5.11% and wetlands at 4.37%. Their totals are similar, but forest often appears in broader green patches while wetlands more often trace narrow or irregular corridors. The maps make those differences easier to understand than a percentage table alone.
The original JPGs measure 2480 × 1754 pixels each. The asset manifest does not mark them as meeting an A3 high-resolution reference, so large-format printing should be tested before a full poster run. They are well suited to screen viewing, reports, ordinary printouts, teaching slides, and county comparisons. A project requiring fine parcel detail, engineering accuracy, or very large exhibition graphics should begin with higher-resolution source data rather than enlarging these raster images.
Thirty-meter cells are useful for regional comparison, not parcel decisions
Annual NLCD uses a 30-meter raster framework for land-cover classification. One square cell can contain a roof, lawn, trees, pavement, bare soil, and a drainage feature while receiving one predominant land-cover class. That generalization is especially important in Cook County, where land surfaces change over short distances and urban blocks contain many mixed materials. Zooming the image does not recover detail that was never present in the underlying cell classification.
The current maps represent the supplied 2025 observation year, so later construction, demolition, restoration, tree growth, wetland work, or other changes may not appear. The 1985–2025 image compares two endpoints and should not be read as a year-by-year construction history. For parcel boundaries, preserve ownership, zoning, building permits, flood studies, or current water features, use the appropriate Cook County, municipal, Forest Preserves, or engineering source alongside the land-cover maps.
Frequently Asked Questions
Why is developed cover 85.24% when mean impervious cover is 46.45%?
Developed land-cover classes can include lawns, trees, soil, and other permeable surfaces around buildings and roads. Impervious cover focuses on roofs, pavement, parking areas, and similar hard materials. The two measures describe related but different characteristics, which is why Cook County can be 85.24% developed while its countywide mean impervious value is lower.
Does the 15.61% class difference mean 15.61% of Cook County was newly urbanized after 1985?
No. Only 4.86% is listed as classified as developed at the 2025 endpoint, while 10.16% is other class difference and smaller shares are forest and agricultural loss. The map compares endpoint classes and does not assign a construction date or cause to every changed cell.
Can the green and teal areas be used as exact Forest Preserve boundaries?
No. Green forest and teal wetland cells describe mapped surface cover, while Forest Preserve ownership and management boundaries are administrative lines from separate data. The land-cover images are useful for environmental context, but preserve visits, ownership questions, and management decisions should use official Forest Preserves and Cook County GIS information.
Sources and Reference Data
- MRLC Annual NLCD Data – official access point for current and annual land-cover products
- USGS Annual NLCD Land Cover Classification – class definitions and guidance for developed land, forest, agriculture, wetlands, and related categories
- U.S. Census Bureau TIGER/Line Shapefiles – official county-boundary reference for Cook County
- Forest Preserves of Cook County – official information about the county’s forests, wetlands, prairies, waterways, and open space
- Cook County Open Data – HydroPoly – Cook County GIS hydrographic polygon data for lakes and rivers
Map File Information
The ZIP contains four original JPG maps for comparing Cook County’s 2025 developed cover, remaining forest and wetlands, impervious-surface intensity, and 1985–2025 class differences.
- Included Files: Use only the versions confirmed in the article and supplied images
- File Type: Use the confirmed download contents
- Intended Use: Printing, education, presentations, and map-based projects
Related Maps
- Adams County Illinois Land Cover Map
- Alexander County Illinois Land Cover Map
- Bond County Illinois Land Cover Map
Green Map creates custom-edited map images using open geographic data sources such as geoBoundaries, Natural Earth, OpenStreetMap, and government open data.
These maps are edited visual materials, not raw data files, and are provided for education, documents, presentations, and graphic reference.