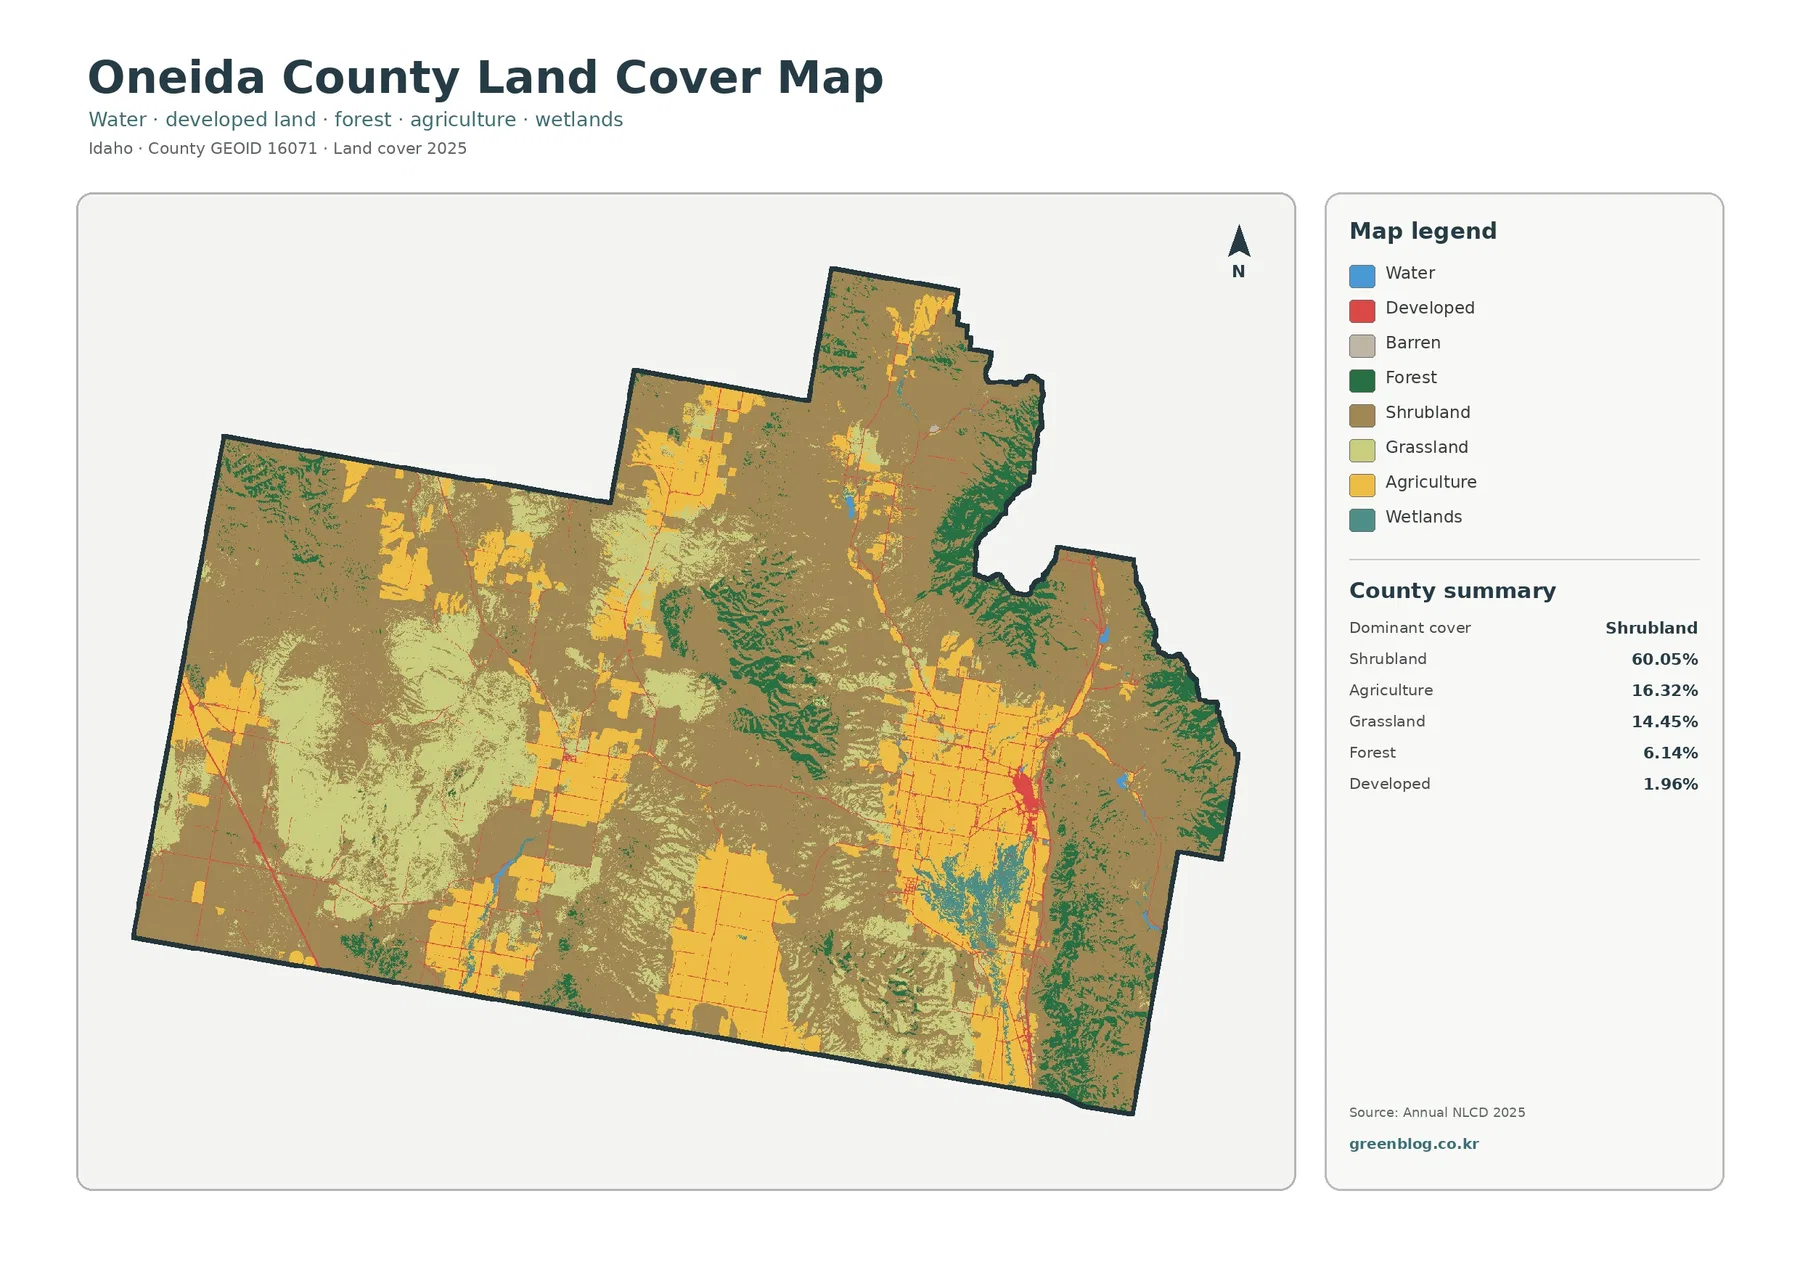
Oneida County is dominated by open shrub-covered country rather than a continuous farm or forest belt. In the 2025 map summary, shrubland accounts for 60.05% of the county, followed by agriculture at 16.32% and grassland at 14.45%. Forest covers 6.14%, while developed land occupies 1.96% and is concentrated most clearly around Malad City and along a limited road network. The four maps on this page let you compare that present-day pattern with farm and forest areas, impervious surfaces, and mapped class differences between 1985 and 2025.
The four original JPG maps are also available together in one ZIP download. They work best for county-scale reference, printing, classroom use, presentations, or a quick visual comparison of where major land-cover classes occur. Land cover describes what the surface is classified as from satellite-based data. It does not show zoning, parcel ownership, legal land use, property boundaries, water rights, or whether a site can be developed.
Table of Contents
Shrubland forms the countywide background, while farms appear as distinct valley blocks
The general land-cover map is visually anchored by the broad brown shrubland class. It extends across much of the western half, continues through the north, and fills large spaces between farm fields and grassland patches in the center and south. At 60.05%, shrubland is not just the largest category; it covers more area than agriculture, grassland, forest, developed land, water, and wetlands combined. That large open-land background is the first pattern to understand before looking at smaller classes.
Grassland contributes another 14.45% and is especially noticeable in a broad western patch as well as in scattered central and southern areas. Its edges frequently meet shrubland rather than forming one isolated grassland zone. Those transitions matter when comparing years because open shrub and grass classes can shift along broad, irregular boundaries. A viewer who looks only at the county percentages would miss how much the two classes interlock on the map.
Agriculture, at 16.32%, is smaller by area but more geometric. Yellow fields appear in blocks through the central and southern valleys, with additional clusters farther north and east. The Oneida Soil and Water Conservation District describes cropland as being concentrated mainly in valley bottoms and notes both dryland grain production and irrigated farming in the county. That regional description fits the mapped tendency for cropland to gather in flatter corridors, although the NLCD map does not identify individual crops, irrigation districts, or farm ownership.
The Malad City area is the clearest meeting point of farms, roads, and developed land
The strongest developed cluster sits in the east-central part of the county, surrounded by a broad concentration of agricultural land. County-specific material from the Oneida Soil and Water Conservation District identifies Malad City as the county seat and places Oneida County along the Idaho-Utah border. With that context, the compact developed area can be understood as the Malad City center rather than as a countywide urban pattern. The map itself does not draw municipal boundaries, so the colored pixels should not be treated as an exact city-limit outline.
Outside that core, developed land becomes thin and linear. Roads cut across farm blocks and open rangeland, and a few smaller concentrations appear near agricultural areas. This is a very different pattern from a metropolitan county where developed classes merge into broad continuous zones. Here, the 1.96% developed share is visually small against the open landscape, even though the road network remains easy to trace on the impervious map.
The farm pattern around Malad and in other valley bottoms also gives the agriculture percentage more meaning. The conservation district reports that cropland is primarily in valley bottoms and includes dryland wheat and barley as well as irrigated grain, hay, pasture, and other crops. Those facts are useful regional context, but they should not be assigned to individual yellow fields on this map. Annual NLCD groups cropland into a broad land-cover category and cannot tell a viewer which crop occupies a specific field.
Forest is a small share, but its eastern and central clusters still stand out
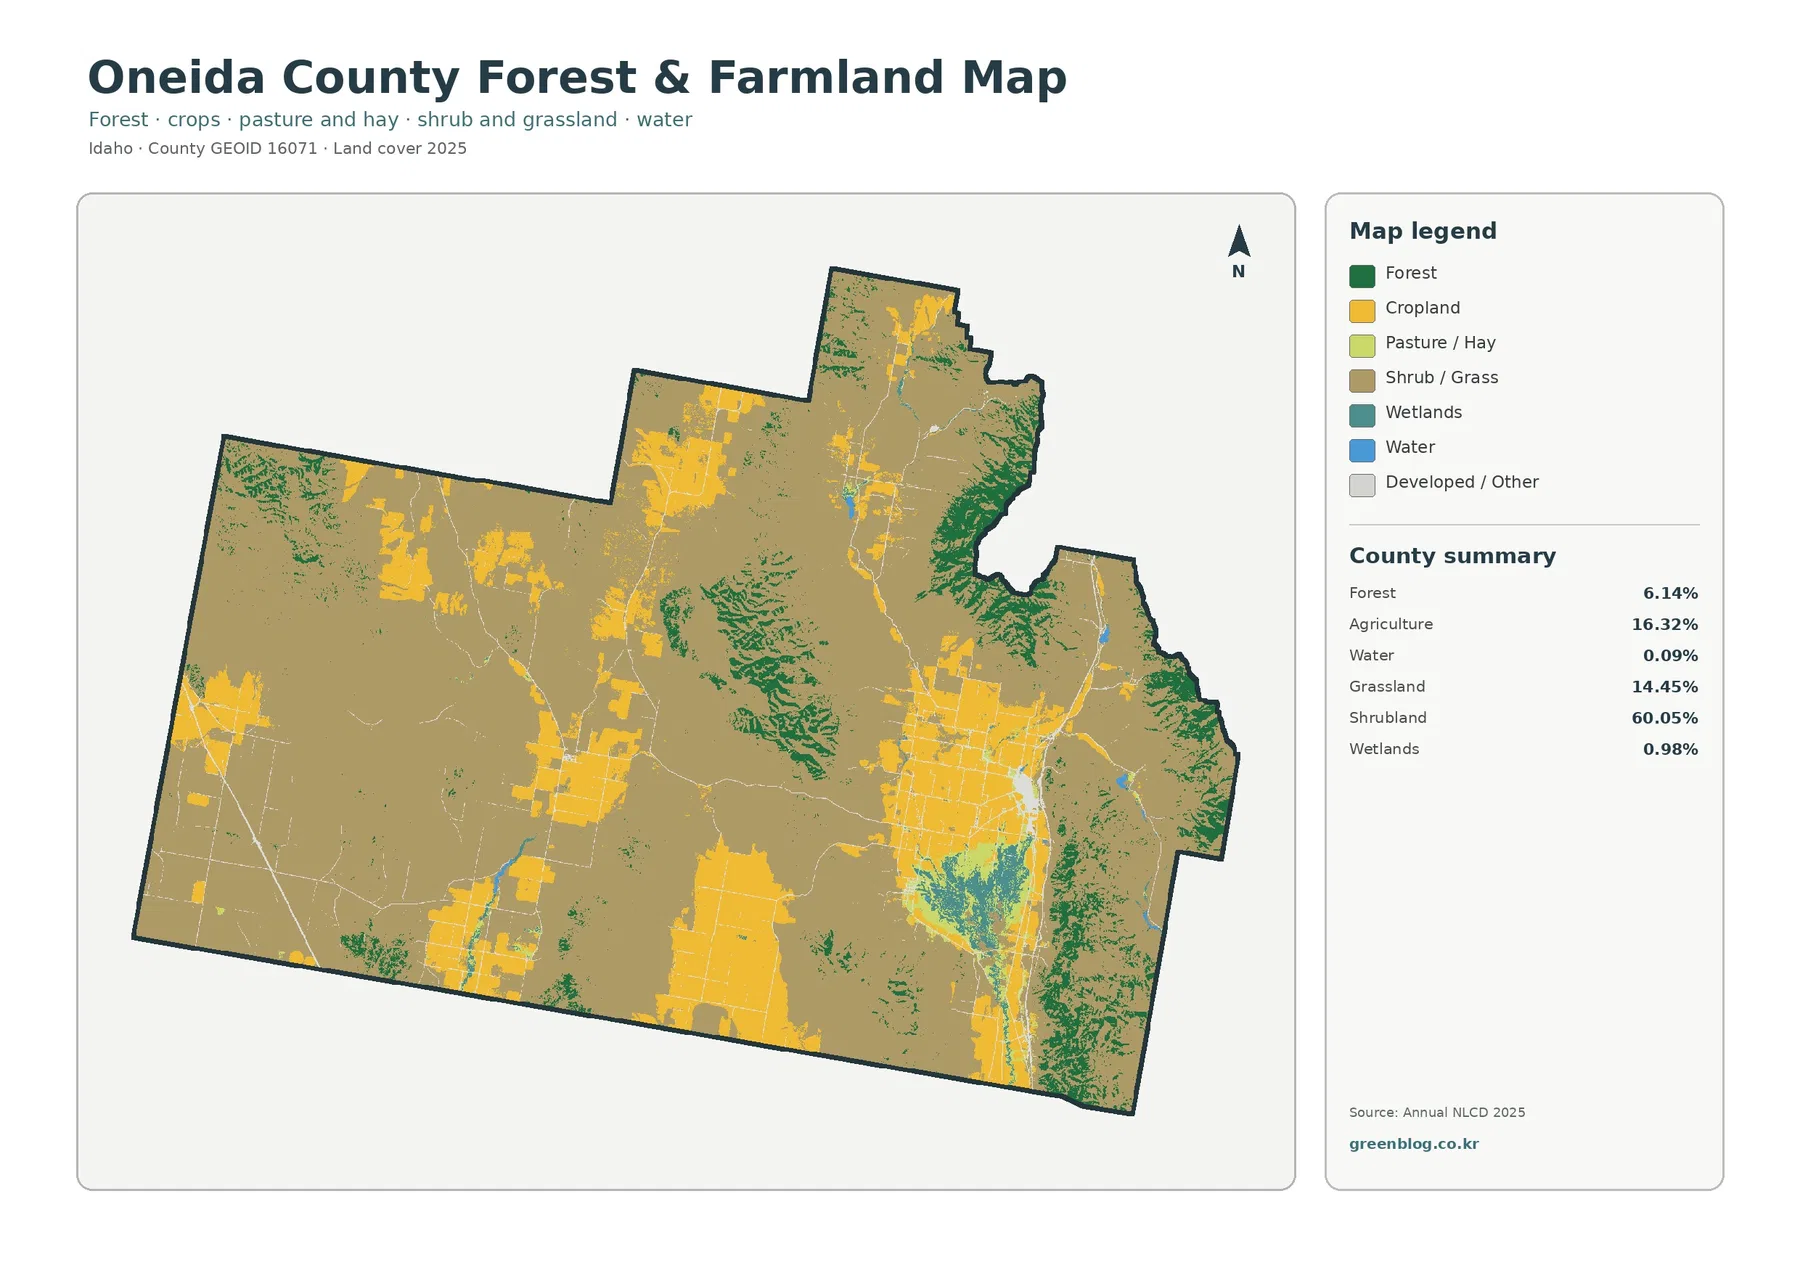
The forest-and-farmland map simplifies the county enough to make the 6.14% forest share easier to locate. Dark green is strongest along the eastern edge and appears in narrower clusters through central and southern parts of the county. The forest pattern is broken rather than continuous across Oneida County, which separates it visually from Idaho counties where forest covers most of the map. In this county, forest is an important local feature within a much larger shrub-and-grass setting.
The same map reports 16.32% agriculture, 14.45% grassland, 60.05% shrubland, 0.98% wetlands, and 0.09% water. Water is so limited that it appears mainly as small blue marks rather than large continuous bodies. Wetlands are more noticeable than open water, especially in low areas south of the main developed cluster and beside some farmed corridors. Their countywide percentage is still below 1%, so a local wetland patch can be visually meaningful even while contributing very little to the total area.
The conservation district also notes that a large portion of the county is managed by the Bureau of Land Management and the U.S. Forest Service, with federal lands used for watersheds, grazing, wildlife, and other purposes. That helps explain why broad open-land and upland settings are important to Oneida County. The land-cover map, however, does not distinguish federal, state, county, or private ownership. A forest or shrubland color should never be used as a shortcut for determining who manages a parcel.
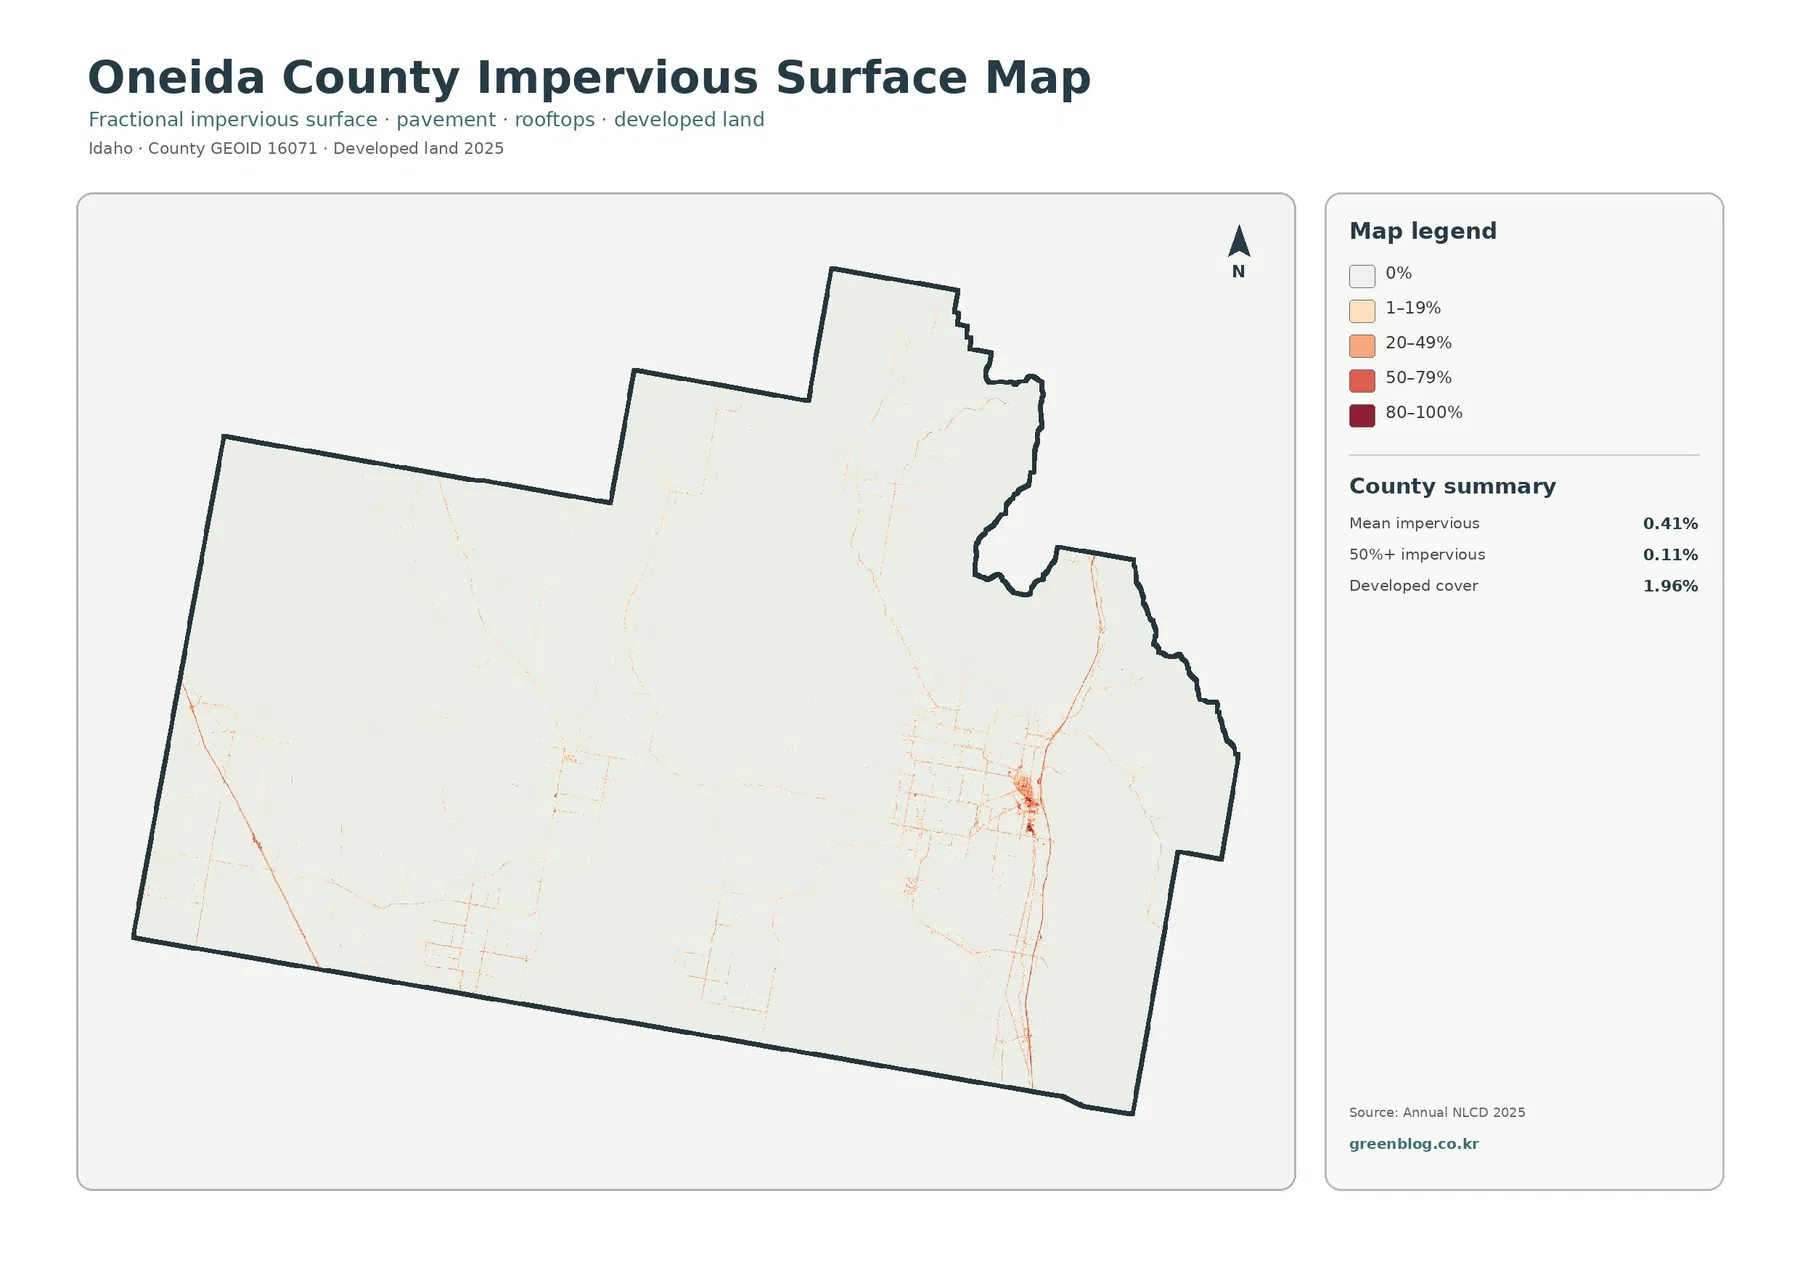
A 0.41% mean impervious value keeps the road network visible without turning the county urban
Impervious surface measures the fraction of a mapped cell covered by hard surfaces such as pavement, rooftops, and parking areas. Oneida County has a mean impervious value of just 0.41%, and only 0.11% of the county is mapped above 50% impervious. Those numbers are lower than the 1.96% developed-land share because developed classes can include yards, soil, trees, and other permeable surfaces around buildings.
Most of the impervious map is nearly white. Against that quiet background, the Malad City area stands out as the strongest concentration, with orange and darker marks at the core and thin lines extending along roads. Secondary road traces are visible across farm country and through the open western and northern areas. The map is particularly useful for seeing how small the hardened surface footprint is compared with the county’s much larger shrubland, grassland, and agricultural areas.
The countywide mean should not be used to describe the surface of a specific town block. A dense commercial site can have a high local impervious fraction even when the county average remains very low. Conversely, a place classified as developed may still contain large permeable areas. For local stormwater, site design, or parcel analysis, viewers would need finer-scale information instead of relying on this county summary.
The 1985–2025 comparison is driven by agricultural and other class differences, not by urban growth alone
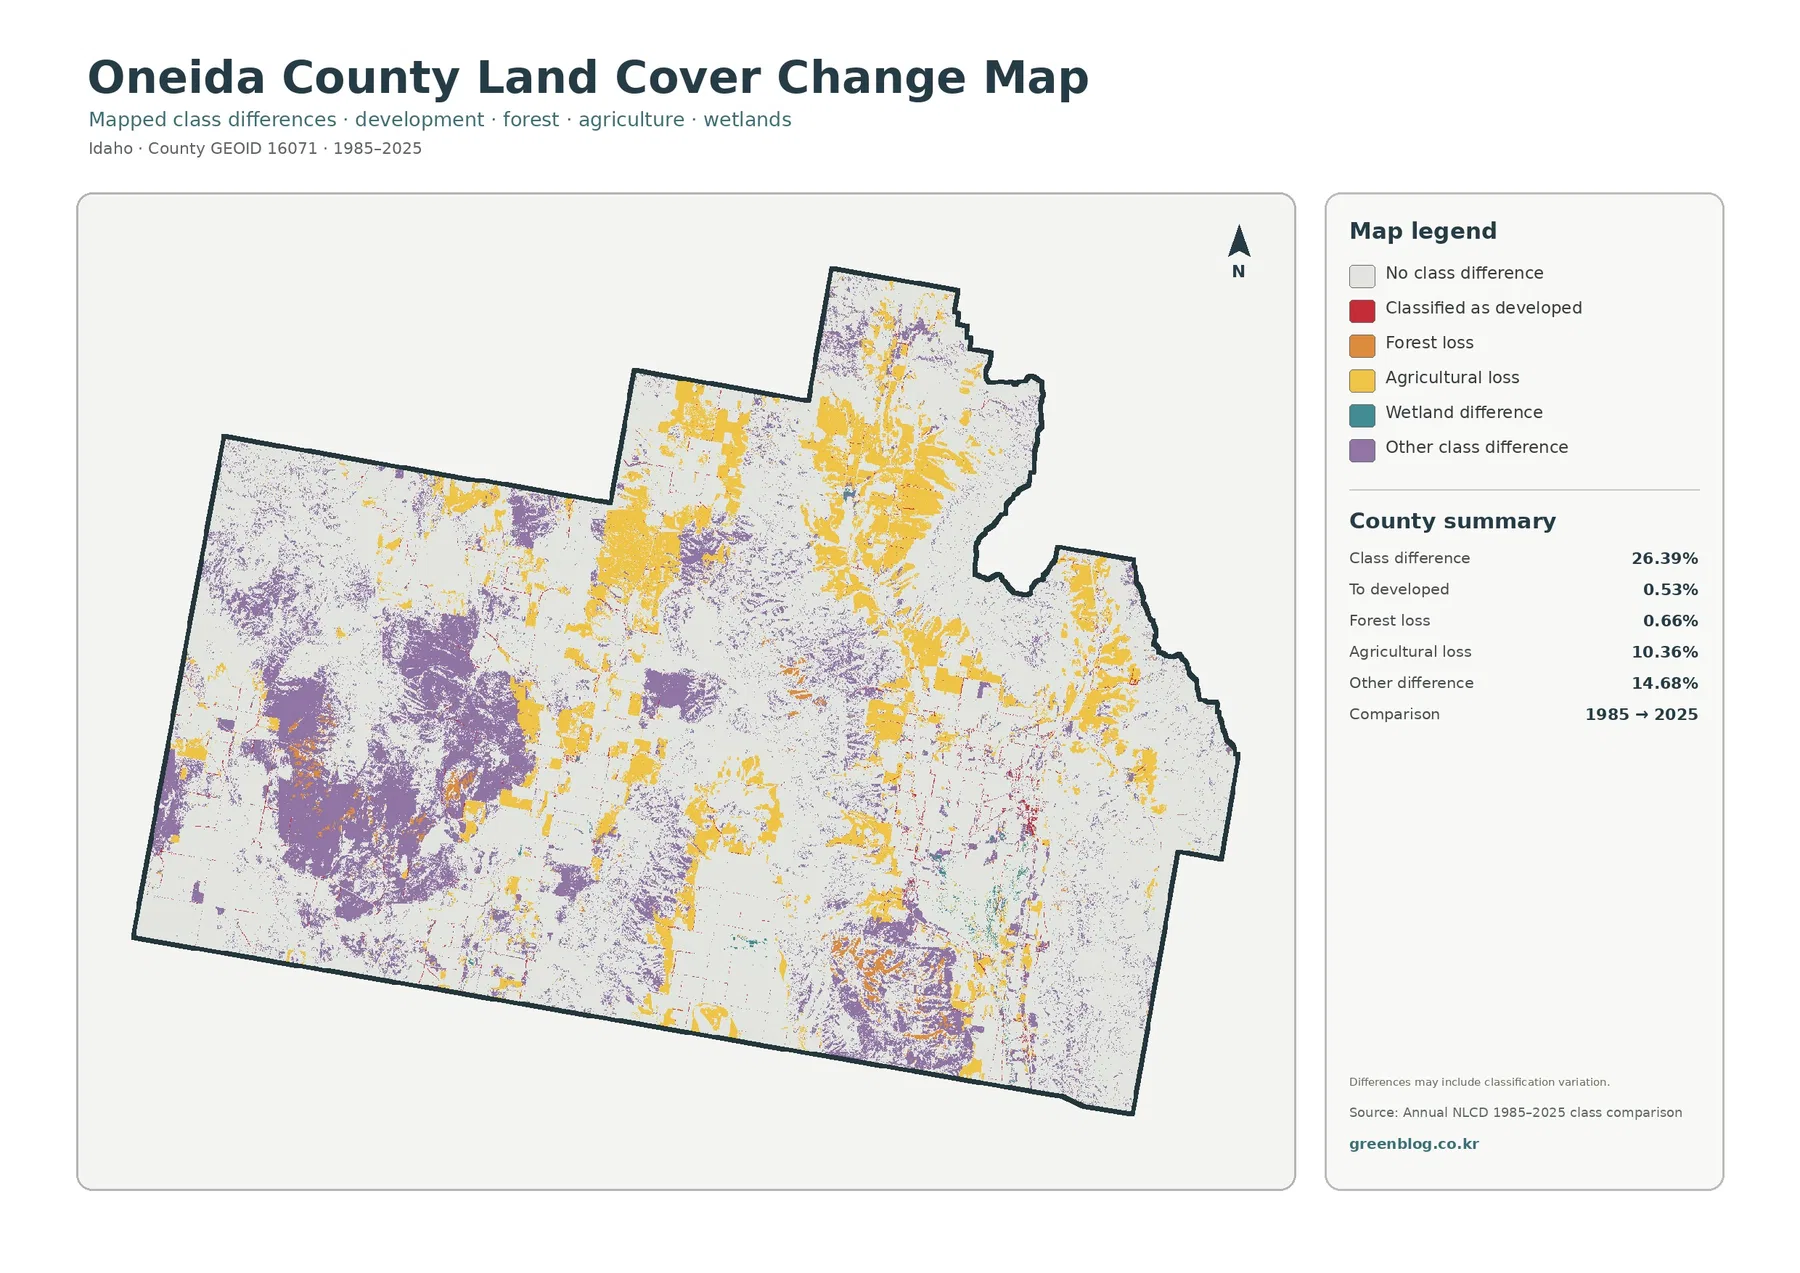
The change map marks cells whose land-cover class differs between 1985 and 2025. The county summary reports a 26.39% total class difference. Within that total, 10.36% is labeled agricultural loss, 14.68% is other class difference, 0.66% is forest loss, and 0.53% is classified as developed. Wetland difference is included in the legend but is not given a separate percentage in the summary, so no unsupported value is added here.
Yellow agricultural-loss areas are widespread enough to shape the map. They occur around present farm blocks in central, northern, eastern, and southern parts of the county. That does not automatically mean every yellow cell represents permanent abandonment or conversion of a working farm. Differences in crop cycles, fallow conditions, boundaries between agriculture and grass or shrub classes, image timing, and classification methods can all influence a two-date comparison.
Purple other-class differences account for 14.68%, the largest single change category in the summary. Large purple patches appear in the western open country and in scattered central and eastern areas. Because this category combines several kinds of class changes, it should not be interpreted as one ecological process. In a county where shrubland and grassland occupy so much area, even shifts between similar open-cover classes can produce a substantial mapped difference.
Red cells classified as developed are much more limited and tend to appear around Malad City and along roads. Forest-loss markings are also small relative to the county total. If a particular site appears important, the safest next step is to check intermediate Annual NLCD years and compare them with aerial imagery or local records. The map is designed to identify places for closer review, not to establish the date or cause of a land-cover change by itself.
Use three visual anchors to move between all four maps without losing your place
A practical way to compare the set is to remember three areas: the compact Malad City development cluster in the east-central county, the large agricultural blocks around the valleys, and the broad shrub-and-grass country to the west. Once those anchors are familiar, it becomes much easier to match the same location across maps with very different legends. This approach also prevents the countywide percentages from becoming detached from the actual distribution on the ground.
Use the general land-cover map when the question is simply what covers the surface in 2025. Switch to the forest-and-farmland view when you want a cleaner contrast between farmed land, forest, open shrub/grass areas, wetlands, and water. The impervious map is best for roads and built-up concentrations. The change map should come last, after the present-day pattern is familiar, because its colors describe differences between two dates rather than current cover.
For printing, keep the legend and year with each map. Shrubland and grassland cover such large areas that they can become hard to distinguish in a poor grayscale print. The change map also depends on separating “No class difference” from “Other class difference,” so color is preferable when possible. Saving the four JPGs together makes it easier to compare maps side by side without mixing them with maps from another county or year.
Read the 30-meter classes as county-scale evidence, not parcel-level facts
Annual NLCD is based on Landsat-derived information summarized in 30-meter cells. A real 30-meter area may contain a road, shrubs, a field edge, a building, and a narrow stream at the same time, but the land-cover layer assigns a representative class. Small features can disappear, and boundaries can look simpler than they do on the ground. That limitation is especially relevant where narrow roads, wetlands, and farm edges occur inside a mostly open landscape.
The percentages on these maps are therefore most useful for describing Oneida County as a whole. The 60.05% shrubland value provides a strong countywide summary, but it cannot answer whether a specific parcel is grazed, protected, irrigated, privately owned, or available for development. Those questions require parcel records, planning documents, ownership maps, water information, or field verification from the appropriate agency.
The same caution applies to the 26.39% change figure. It is a map of class differences between two years, not a single measure of confirmed human-caused conversion. In Oneida County, the large 14.68% other-difference share and 10.36% agricultural-loss category deserve closer inspection before a local conclusion is made. Intermediate-year NLCD layers are valuable because they show whether a difference appears gradually, briefly, or only at one endpoint.
Frequently Asked Questions
What is the dominant 2025 land-cover class in Oneida County?
Shrubland is the dominant class at 60.05%. Agriculture accounts for 16.32%, grassland 14.45%, and forest 6.14%, so the county is defined more by broad shrub-covered country than by a single continuous farm or forest belt.
Which map is most useful for locating the developed core around Malad City?
Start with the general land-cover map to find the developed class, then compare the same area on the impervious-surface map. The countywide mean impervious value is only 0.41%, but roads and the Malad City area stand out clearly against the much larger rural background.
Does the 26.39% class difference from 1985 to 2025 equal confirmed land conversion?
No. The total includes 10.36% mapped as agricultural loss, 0.53% classified as developed, 0.66% forest loss, and 14.68% other class difference. Some differences can reflect classification variation or movement between similar open-land classes, so intermediate years and other records are needed before assigning a cause.
Map File Information
The Oneida County download contains four original JPG land-cover maps in one ZIP file.
- Included Versions: land cover, forest & farmland, impervious surface & developed land, land cover change
- File Type: ZIP containing 4 JPG files
Related Maps
Sources and References
- MRLC – Annual NLCD Data (official land-cover data used for the 2025 and multi-year map views)
- U.S. Geological Survey – Annual NLCD Land Cover Classification (class definitions and Annual NLCD background)
- Idaho Soil & Water Conservation Commission – Oneida SWCD Plan (county-specific information on agriculture, valley-bottom cropland, public land, and local conditions)
- University of Idaho Extension – Oneida County (local agriculture and Extension programs)
- U.S. Census Bureau – TIGER/Line Shapefiles (official county-boundary geography)
Green Map creates custom-edited map images using open geographic data sources such as geoBoundaries, Natural Earth, OpenStreetMap, and government open data.
These maps are edited visual materials, not raw data files, and are provided for education, documents, presentations, and graphic reference.