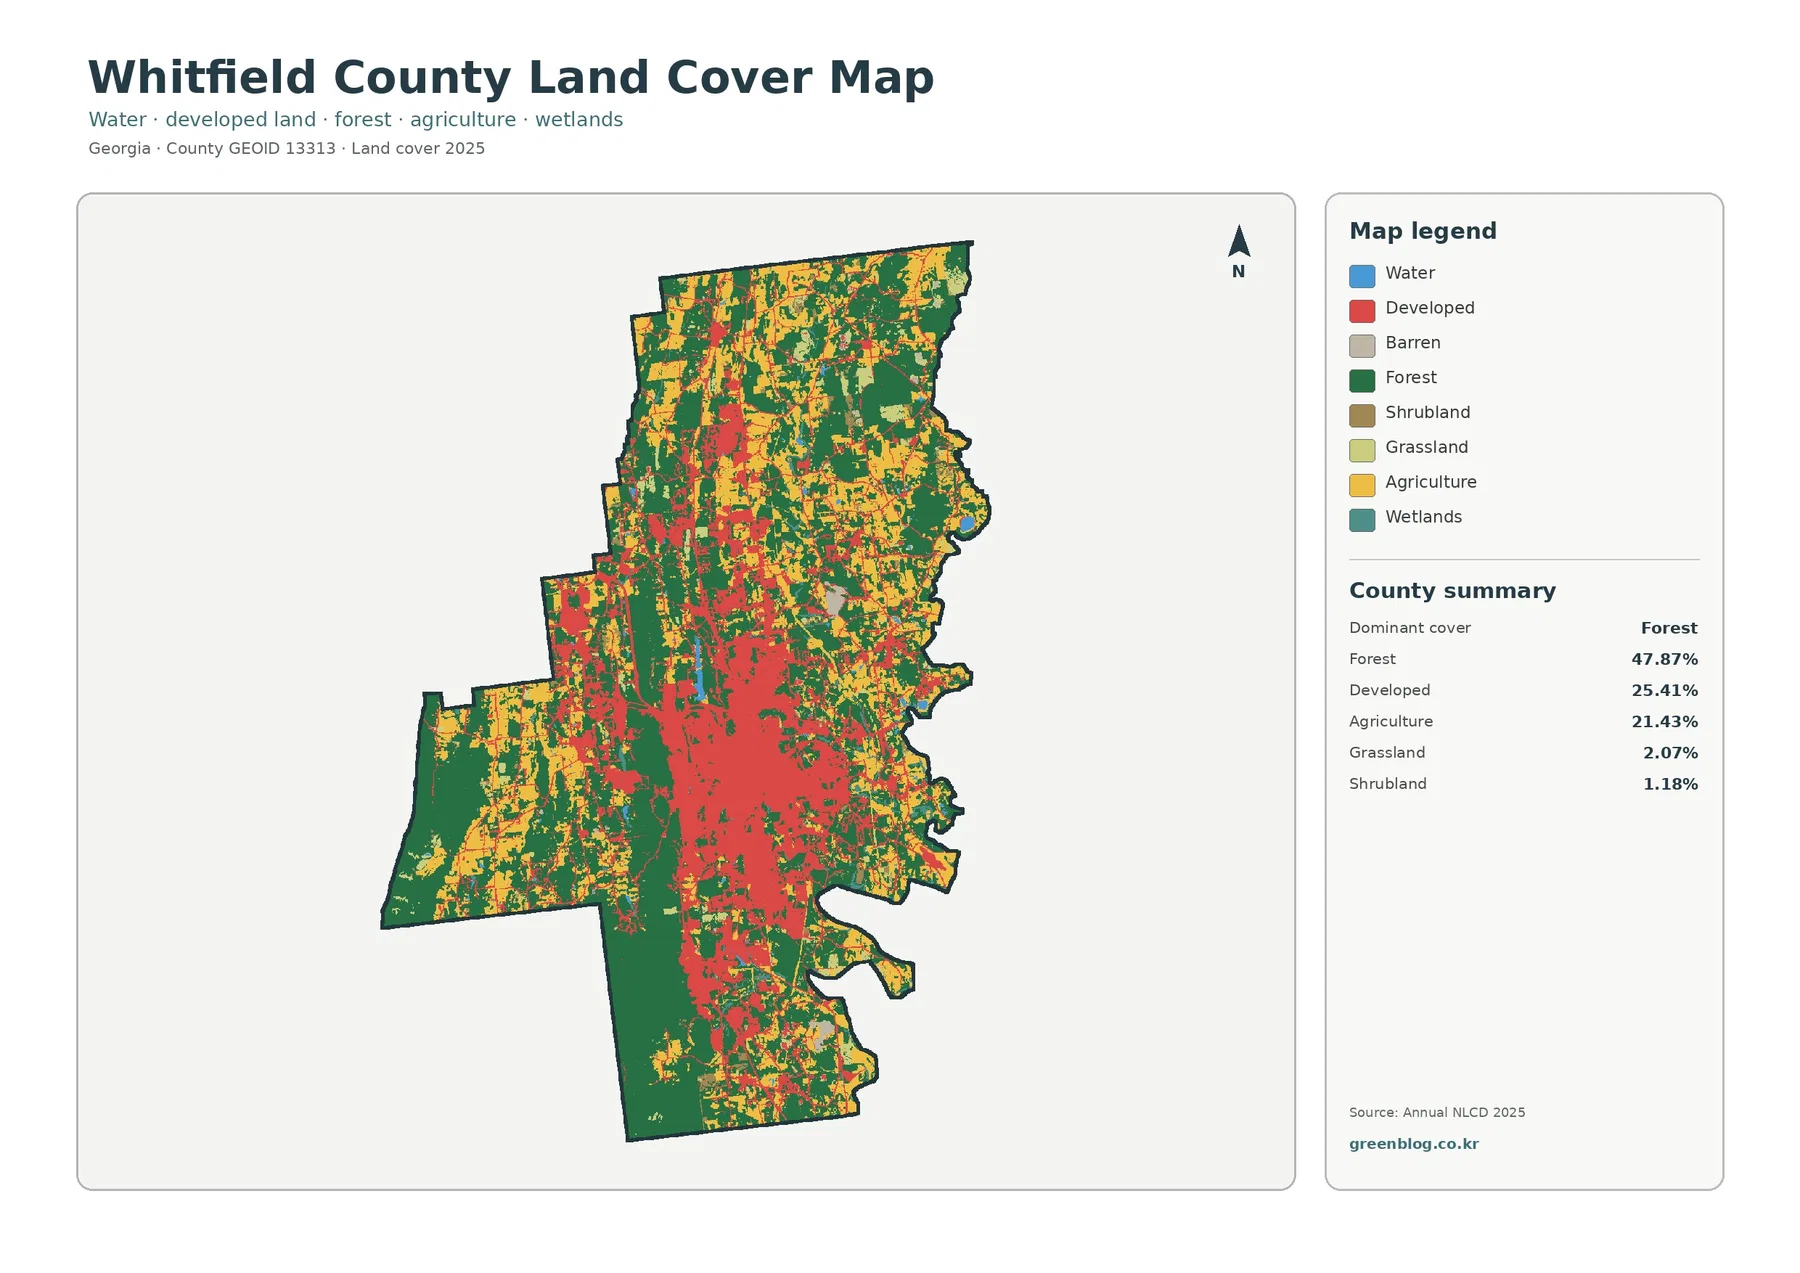
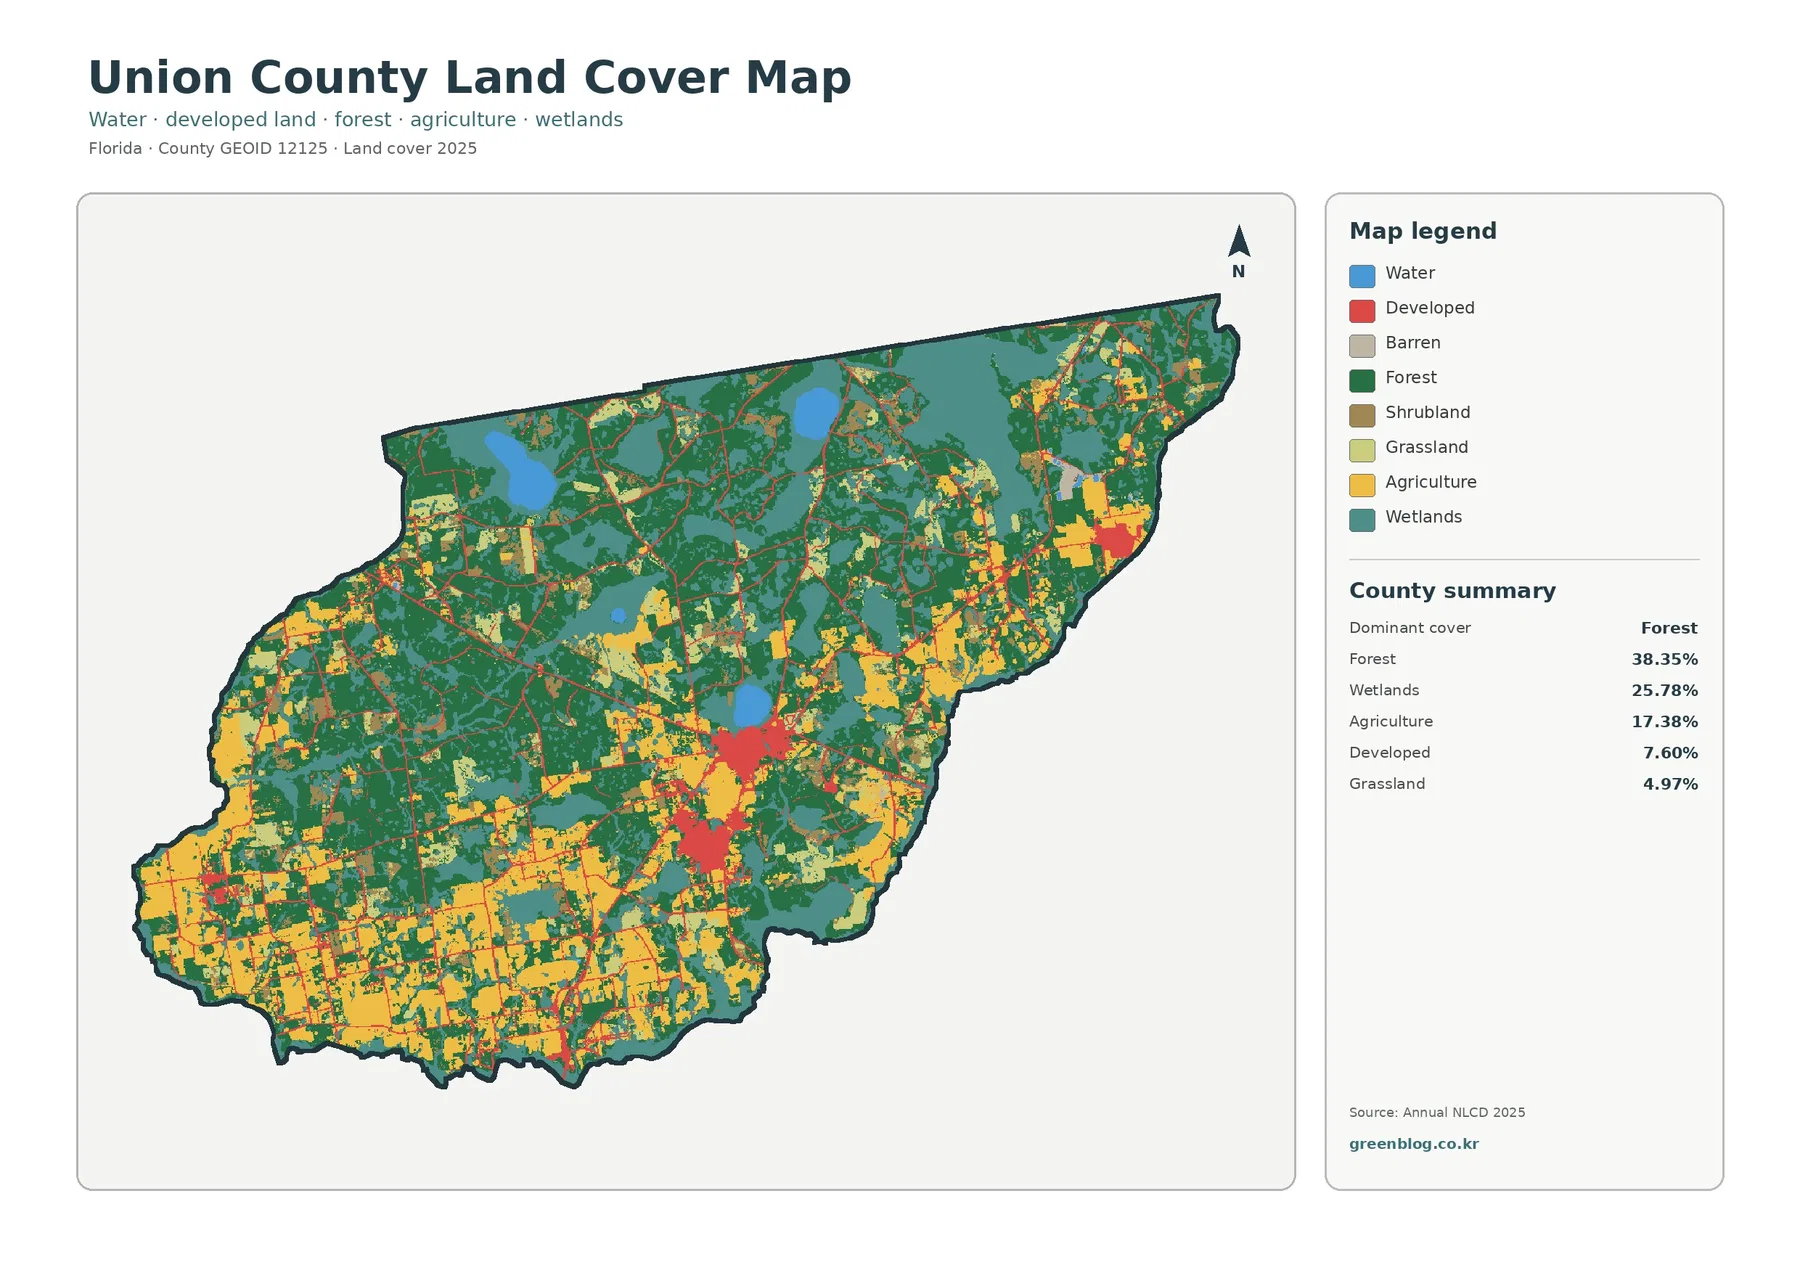
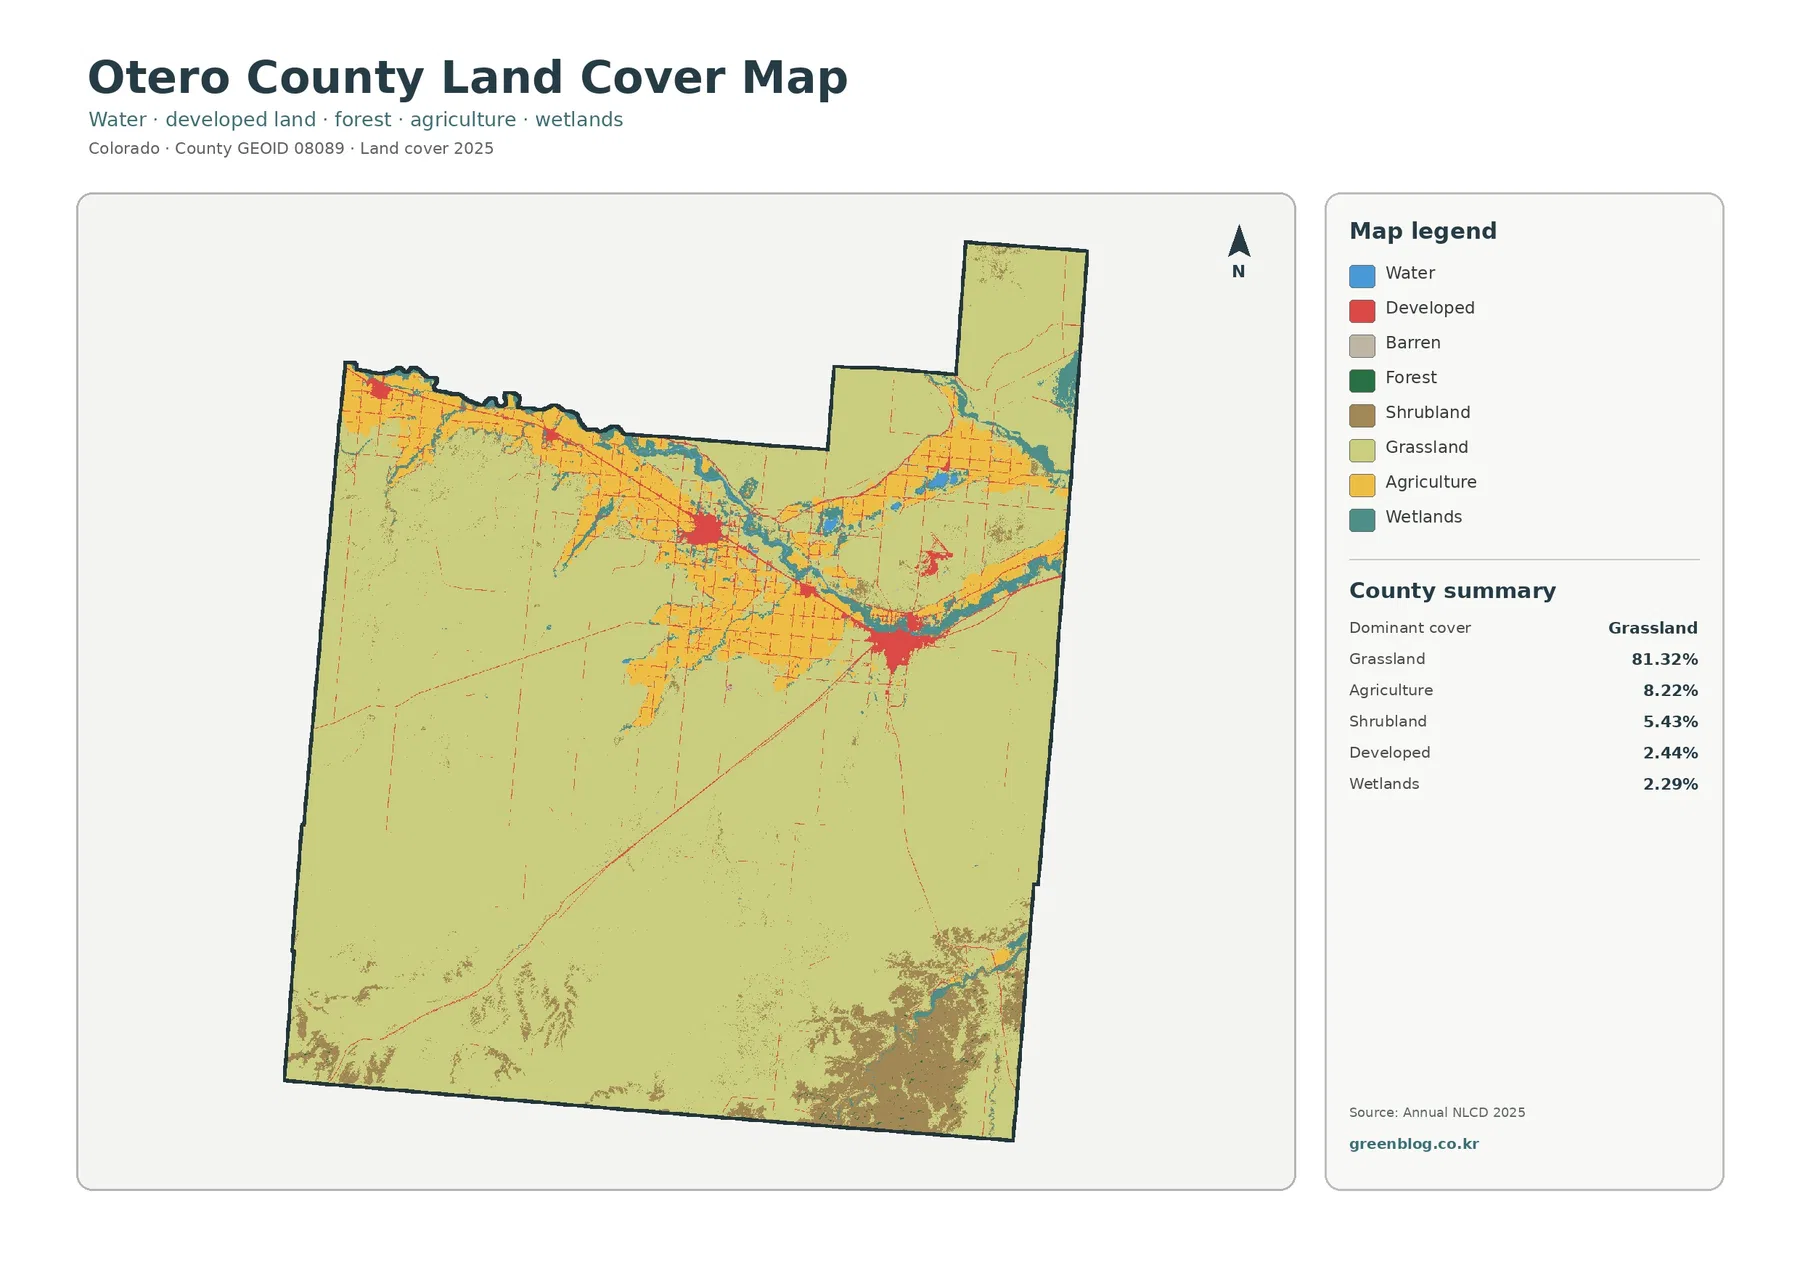
Madison County’s 2025 land-cover pattern is dominated by a broad agricultural plain, while forest and shrubland become much more prominent toward the southeast. Agriculture accounts for 53.01% of the county, followed by forest at 16.94% and shrubland at 15.69%. Developed land covers 6.88%, with the strongest concentration around Rexburg. The four maps on this page let you compare the current cover pattern, the farm–forest contrast, impervious surfaces, and mapped class differences between 1985 and 2025.
All four original JPG maps are available together in one ZIP. They can be used for side-by-side reference, classroom work, presentations, and general regional review. Land cover describes what the ground surface was classified as from satellite-based data. It is not the same as zoning, parcel ownership, legal land use, a building permit map, or a survey of property boundaries.
Table of Contents
A farm-dominated plain gives way to forest and shrubland in the southeast
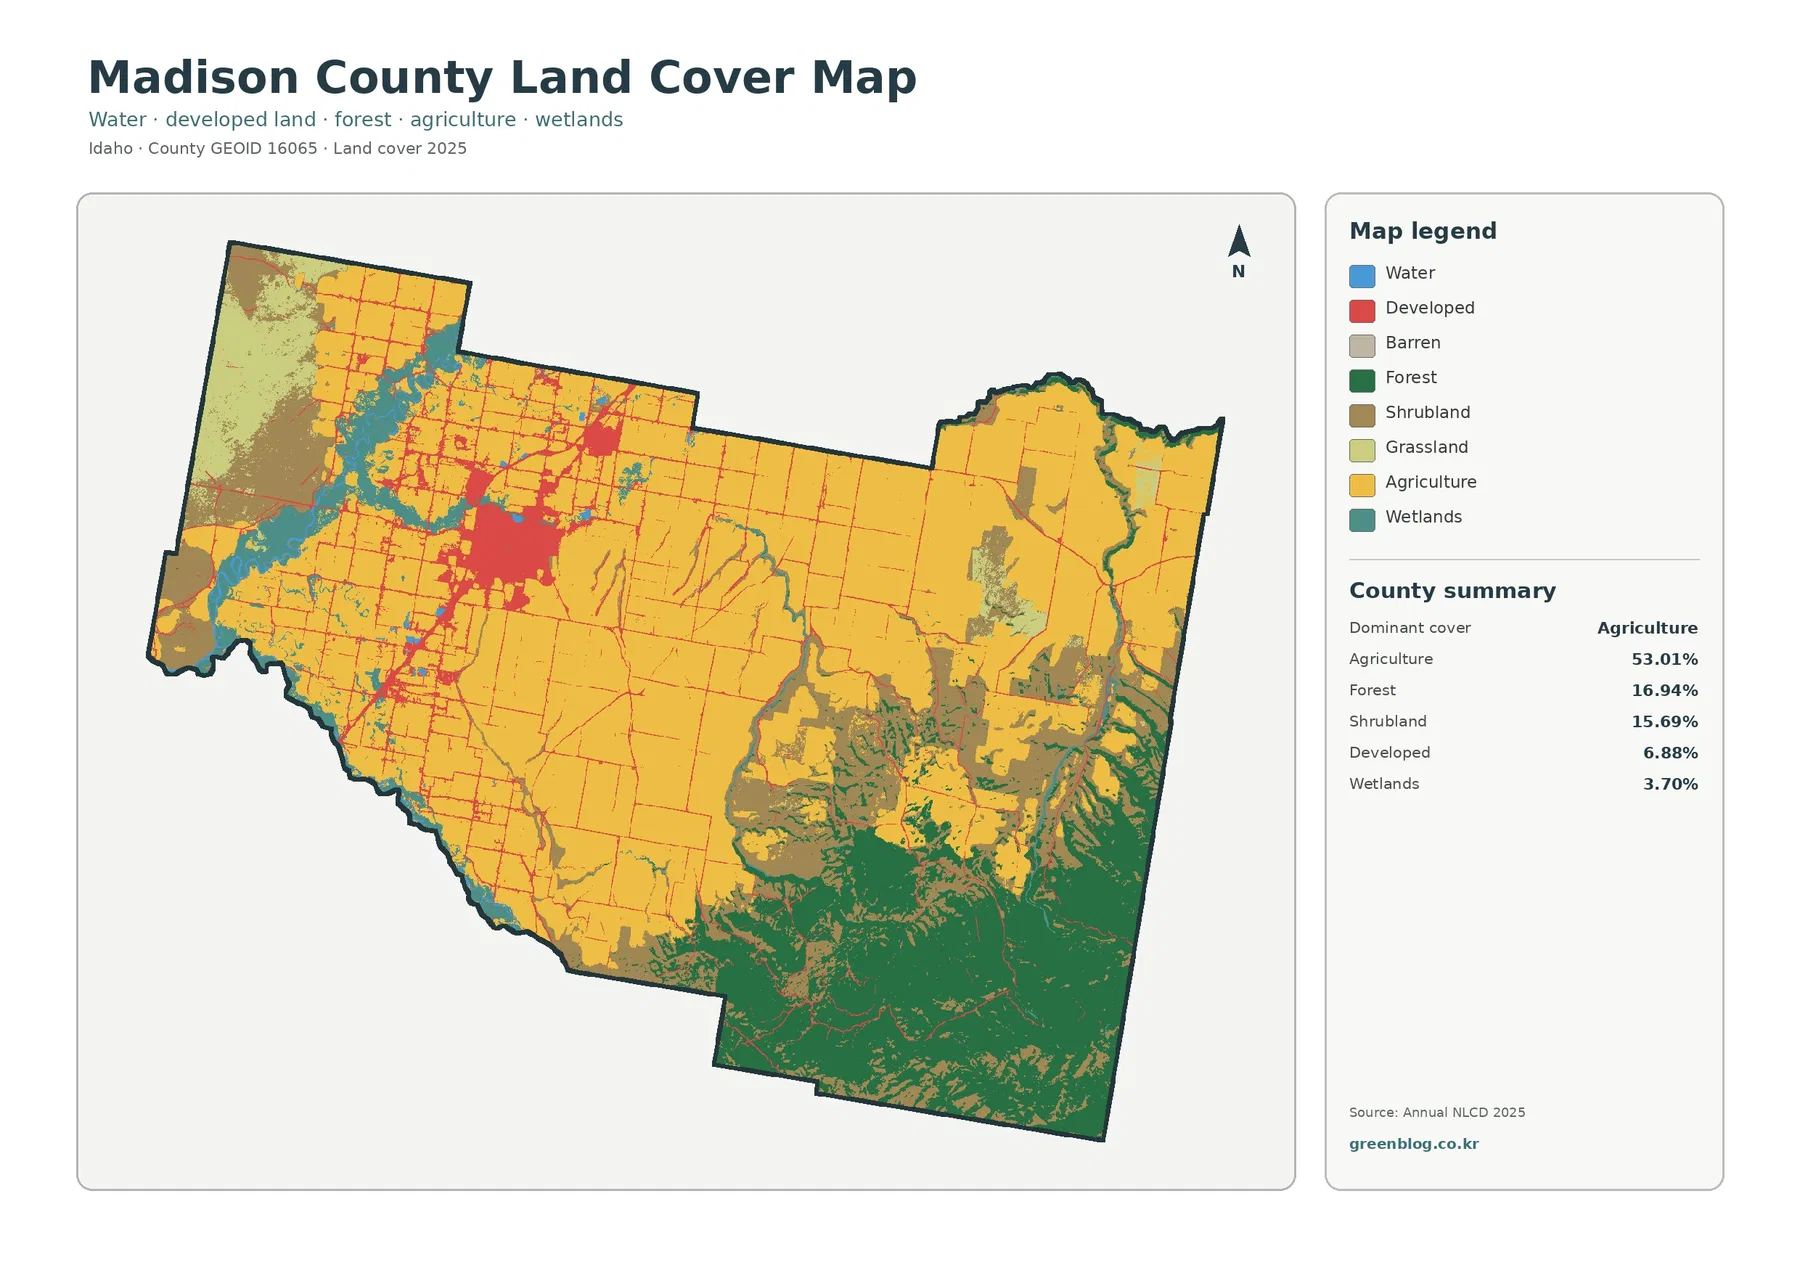
The general land-cover map is immediately defined by the large yellow agricultural blocks that occupy much of western and central Madison County. Agriculture makes up 53.01% of the 2025 summary, so it is the only class that covers more than half of the county. The mapped farm pattern is not evenly scattered. Large blocks form a broad, connected zone, with roads and developed areas breaking the grid around population centers.
Southeastern Madison County looks markedly different. Forest expands across a large contiguous area, and shrubland appears along forest edges, uplands, and transitions toward more open country. Forest accounts for 16.94% of the county and shrubland for 15.69%. Grassland contributes another 3.32%. Seen together, those classes create a sharp visual contrast with the farm-dominated western and central portions of the map.
Wetlands account for 3.70%, which is enough to form visible ribbons and irregular patches even though they cover far less land than agriculture or forest. Water represents 0.46%. Wetland and water colors interrupt some farm blocks and appear along lower areas and drainage features. Because the classification uses generalized raster cells, narrow streams and small wet places may look simplified or discontinuous at this scale.
Rexburg stands out as the main developed concentration inside the agricultural pattern
Developed land covers 6.88% of Madison County, but its visual footprint is more noticeable than that share might suggest because it is concentrated within a much larger agricultural setting. The largest red developed cluster corresponds to the Rexburg area. Smaller developed patches and linear features extend into the surrounding farm grid, where roads, homes, commercial sites, and other built surfaces interrupt the agricultural pattern.
The forest-and-farmland view makes the two largest landscape zones easier to compare
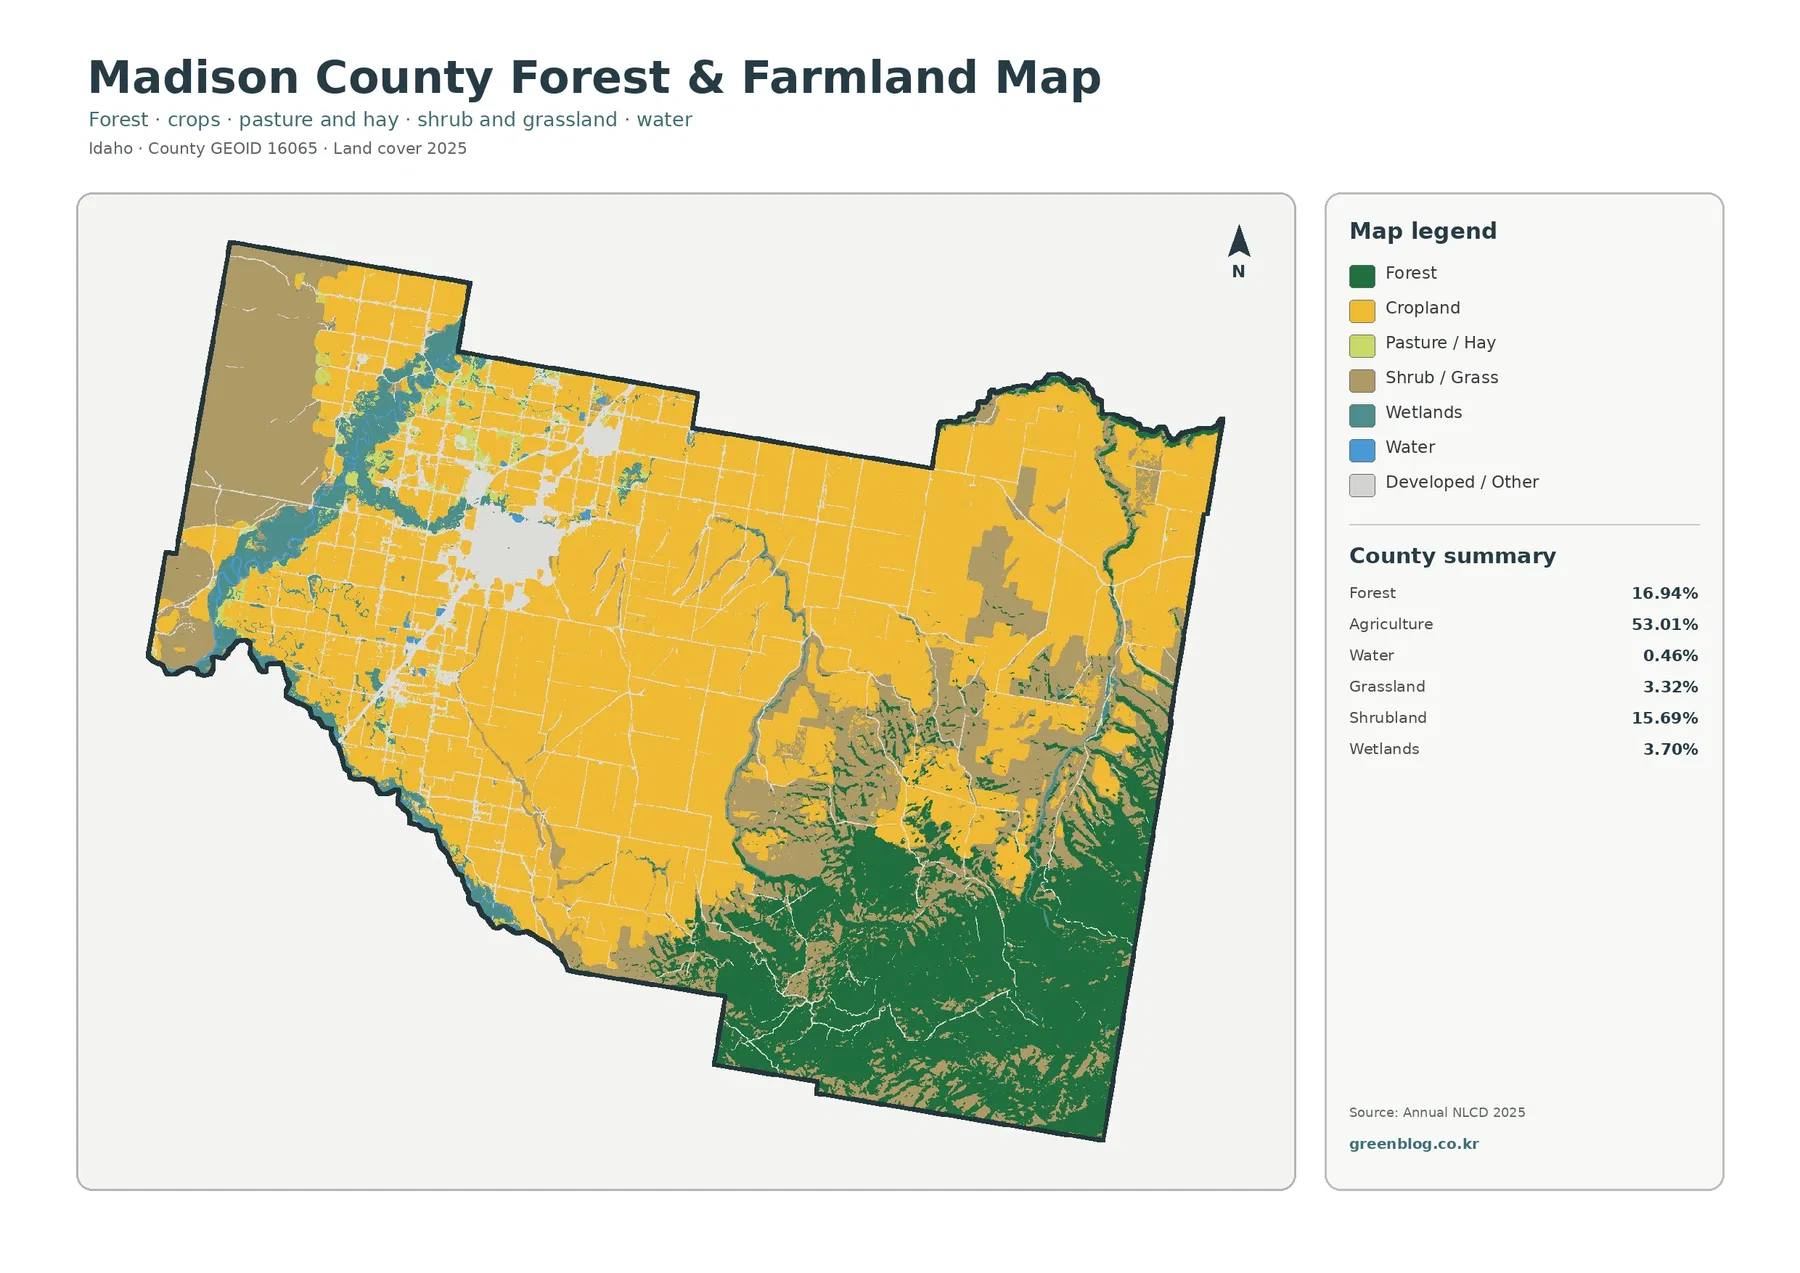
The forest-and-farmland map reduces the number of classes so the relationship between cropland, forest, shrub or grass cover, wetlands, water, and developed or other areas is easier to follow. In Madison County, the simplification highlights a broad agricultural core across the west and center and a forested southeastern section. Between them, shrub and grass cover occupies transitional areas rather than forming one simple straight boundary.
Agriculture remains 53.01% of the county in this view, but the cleaner legend makes interruptions within the farm area more obvious. Around Rexburg, developed or other cover breaks up the crop pattern. Farther west and northwest, wetland colors appear among farm blocks and along drainage features. The result is a landscape that is strongly agricultural without being a single uninterrupted sheet of cropland.
Impervious surfaces reveal the difference between a countywide average and the Rexburg core
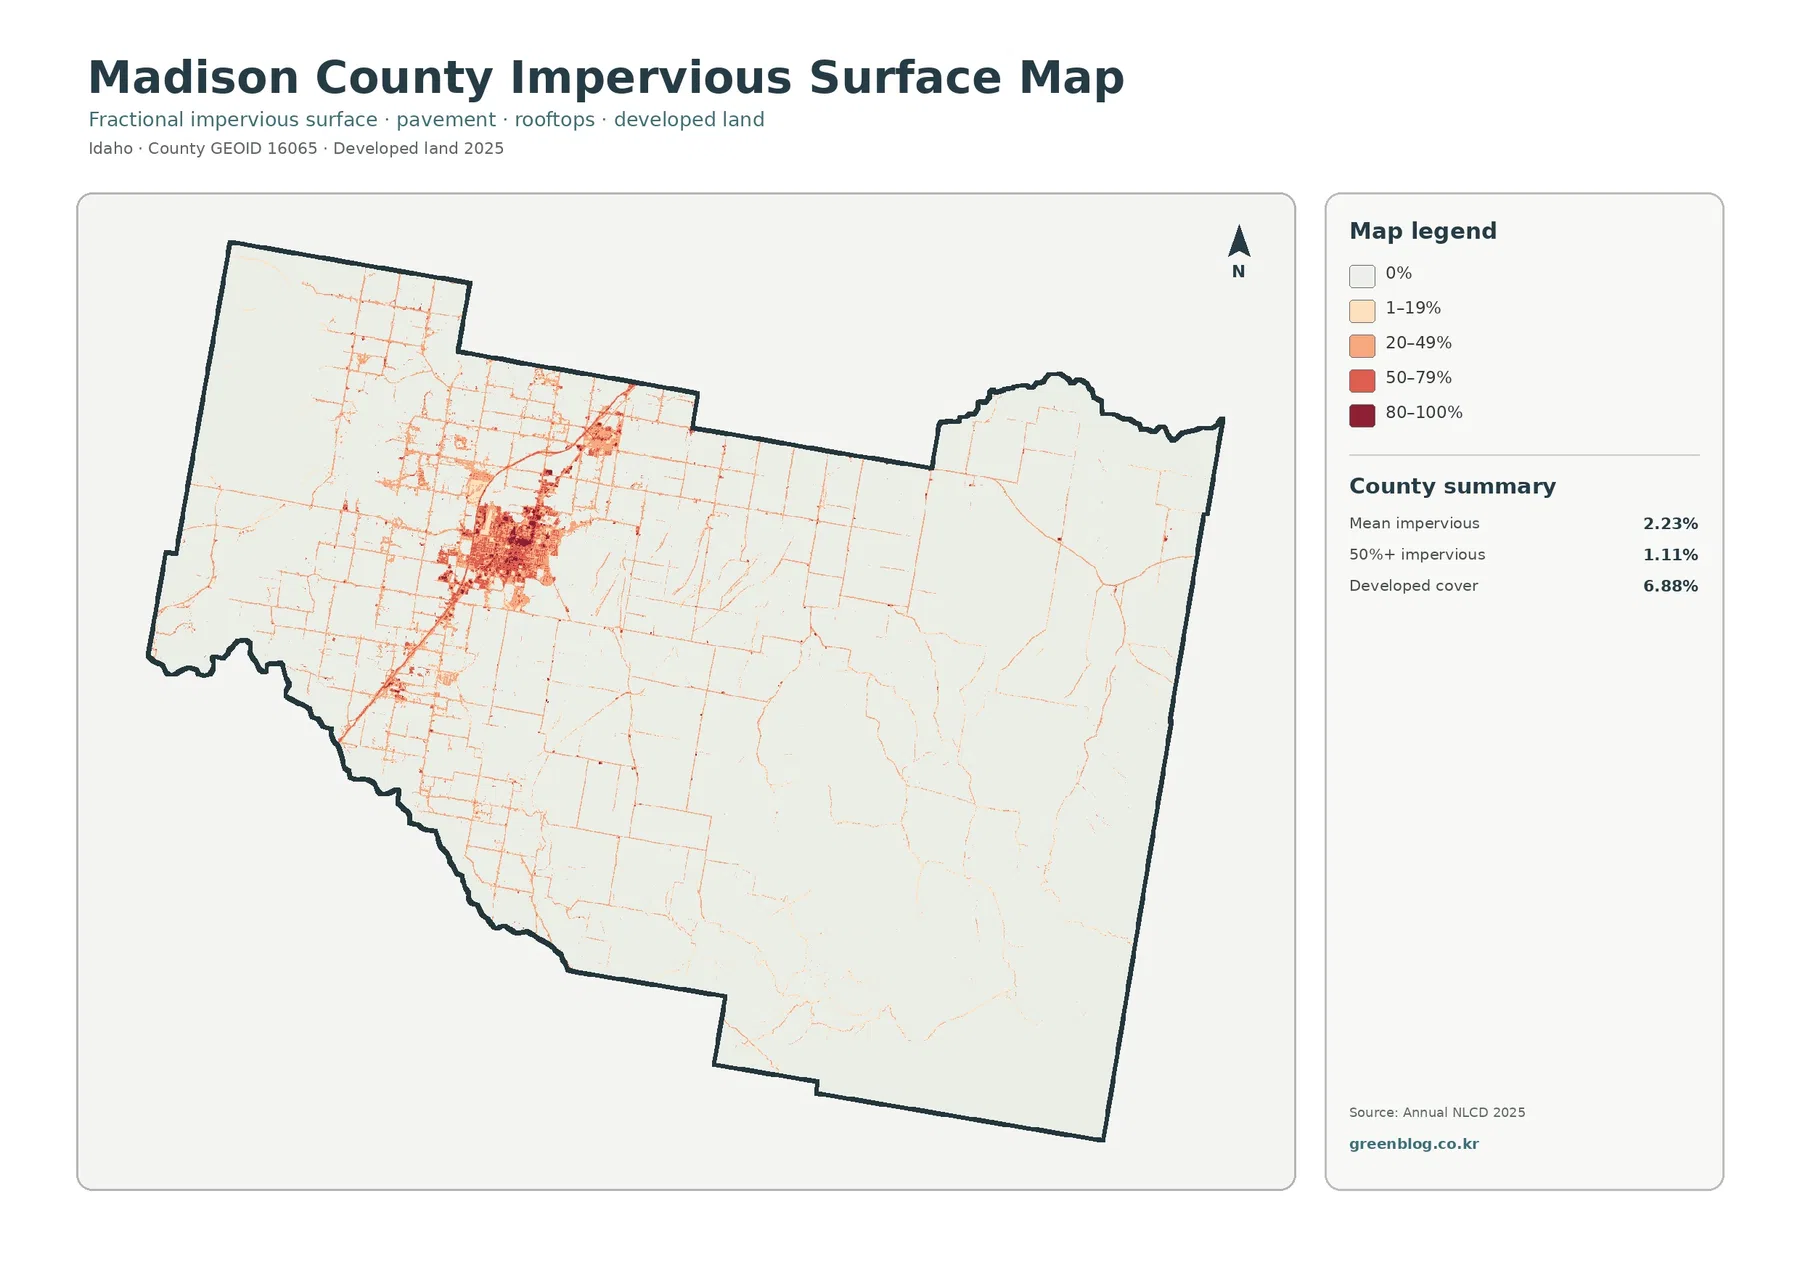
Impervious surface means pavement, rooftops, parking areas, and other hard surfaces that do not readily absorb water. Madison County’s mean impervious value is 2.23%, while 1.11% of the county has imperviousness above 50%. Those figures are lower than the 6.88% developed-land share because the two measures are not identical. A developed cell can contain lawns, trees, bare soil, or other permeable surfaces along with buildings and pavement.
The impervious map is darkest around Rexburg, where the highest-value cells form the clearest concentration in the county. From that core, thinner orange and red lines follow parts of the road network into surrounding agricultural areas. The farm plain itself remains mostly light, while southeastern forest and shrubland are also dominated by low impervious values except along a limited number of roads and developed sites.
The 1985–2025 difference map needs to be read as classification change, not a single measure of development
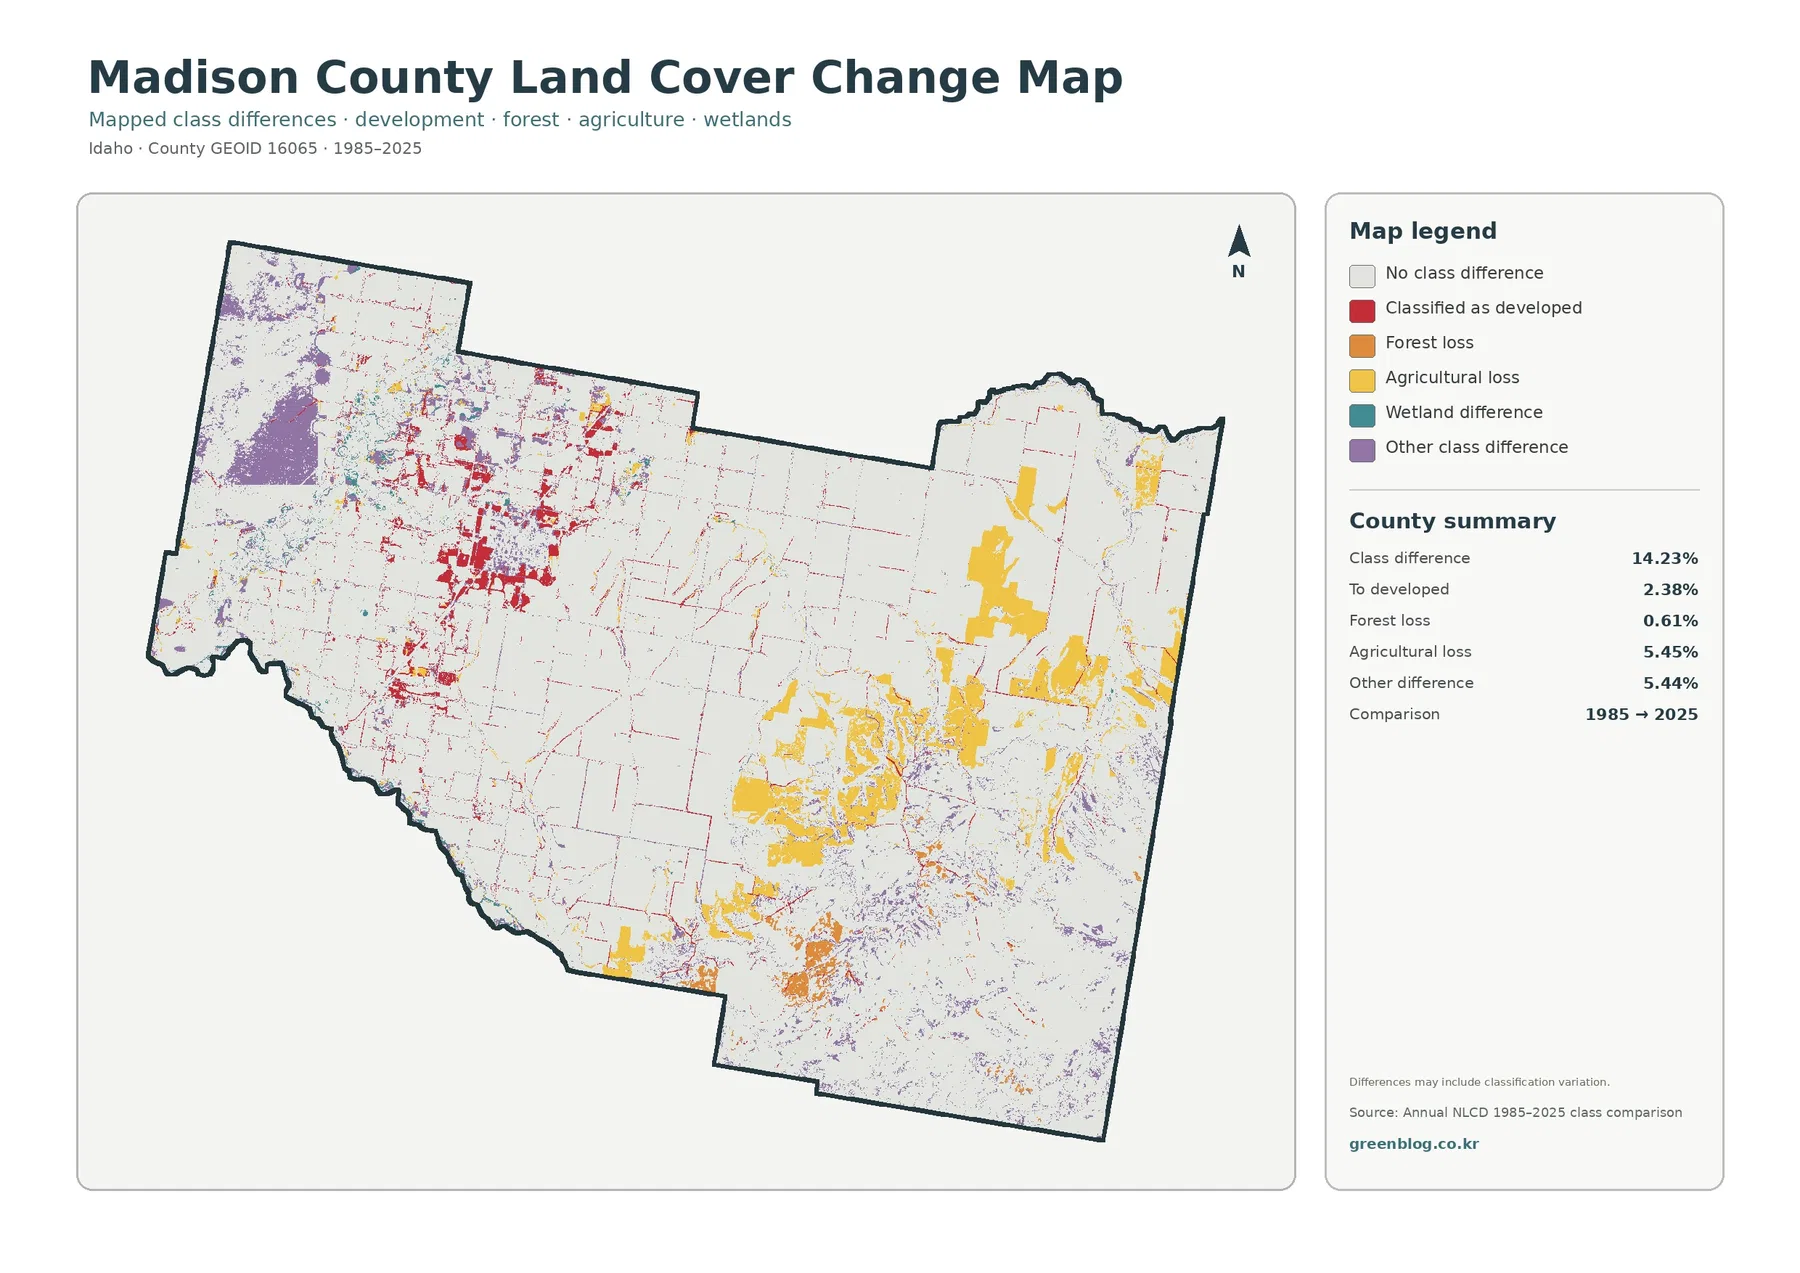
The change map marks raster cells whose land-cover class differs between 1985 and 2025. Madison County’s total mapped class difference is 14.23%. The summary identifies 5.45% as agricultural-loss classification, 5.44% as other class difference, 2.38% as changed to developed, and 0.61% as forest loss. The legend also includes wetland difference, but the visible summary does not provide an exact percentage for that category, so no additional number should be inferred.
Agricultural-loss colors appear in several larger patches in eastern and southeastern parts of the county and in smaller areas across the farm plain. Other-class differences are also widespread, including portions of the northwest and eastern side. Some of those locations fall near boundaries where agriculture, shrubland, forest, or wetlands meet on the 2025 map. A boundary moving by one or more 30-meter cells can therefore contribute to the difference map even when the real-world story is more complicated.
Teton River and Henrys Fork basin context helps explain why wetlands matter within the farm landscape
The Idaho Department of Environmental Quality describes the Teton River subbasin as part of the Henrys Fork Basin and identifies agriculture and recreation among its major land uses. Madison County lies within this broader eastern Idaho watershed setting. That regional context is useful when reading the map’s combination of extensive agriculture, wetland ribbons, and small water areas, although the land-cover map itself does not label individual rivers or irrigation features.
A practical way to use the four maps is to keep three reference areas in view
For a first pass, use the general land-cover map to establish three reference areas: the broad western and central agricultural zone, the Rexburg developed concentration, and the forested southeast. Those landmarks make it much easier to move between map products without getting lost when the legend changes. They also represent the main contrasts that make Madison County different from a uniformly agricultural or uniformly forested county.
The 30-meter classification is designed for broad comparison, not parcel decisions
Annual NLCD is a raster product derived from satellite observations. Raster data divides the landscape into cells, and the land-cover class assigned to each cell represents a generalized surface condition. At 30 meters, one cell can contain a mix of crops, road shoulder, trees, buildings, or wet ground. Boundaries around Rexburg, narrow wetlands within the farm grid, and forest edges in the southeast may therefore look simpler than they do in high-resolution imagery.
Frequently Asked Questions
What is the largest 2025 land-cover class in Madison County?
Agriculture is the largest class at 53.01%. It dominates much of western and central Madison County, while forest at 16.94% and shrubland at 15.69% are much more prominent toward the southeast.
Do the red developed areas and the impervious-surface map measure the same thing?
No. Developed land is a land-cover class and accounts for 6.88% of the county. Impervious surface measures the share of each raster cell covered by hard surfaces such as pavement and rooftops; the countywide mean is 2.23%.
Does the 14.23% change figure mean that 14.23% of the county was physically transformed?
Not necessarily. The figure represents raster cells whose mapped class differs between 1985 and 2025, and the map notes that classification variation may be included. Agricultural-loss classification is 5.45%, other difference 5.44%, change to developed 2.38%, and forest loss 0.61%.
Map File Information
Download the four original Madison County land-cover JPG maps together in one ZIP file.
- File Type: ZIP containing 4 JPG files
Related Maps
Sources and References
- MRLC – Annual NLCD Data (official Annual NLCD data used for current land cover and long-term class comparison)
- U.S. Geological Survey – Annual NLCD Land Cover Classification (official explanation of land-cover classes and the 30-meter classification framework)
- University of Idaho Extension – Madison County (local agriculture and cropping-systems programming in Madison County)
- Madison County – 2019 Multi-Hazard Mitigation Plan (official county background on agriculture, residential and commercial land-use context around Rexburg and Madison County)
- Idaho Department of Environmental Quality – Teton River Subbasin (state information on the Teton River, Henrys Fork Basin, and major land uses)
Green Map creates custom-edited map images using open geographic data sources such as geoBoundaries, Natural Earth, OpenStreetMap, and government open data.
These maps are edited visual materials, not raw data files, and are provided for education, documents, presentations, and graphic reference.