Lewis County in north-central Idaho is dominated by working land rather than one continuous natural-cover type. The 2025 land-cover summary assigns 47.91% of the county to agriculture, while forest covers 21.09% and grassland 18.65%. The broad farm country is most obvious across the middle of the county, but the southwest block and the narrowing eastern side contain much more forest, grass, and shrub cover. That contrast makes the county useful for comparing a cultivated prairie with wooded breaks and small settlement centers in the same map set.
Four views are provided here: current land cover, a simplified forest-and-farmland view, fractional impervious surface with developed land, and mapped class differences between 1985 and 2025. The four original JPG maps are available together in one ZIP for print reference or side-by-side study. Land cover describes what physically covers the ground in the imagery-based classification; it does not establish parcel ownership, zoning, property boundaries, or whether a site can be developed.
Table of Contents
A cultivated prairie fills the middle while wooded land holds the outer breaks
Agriculture is the first pattern to notice because yellow covers nearly half of Lewis County. Large blocks extend across the central area and continue into the long northern section, with a fine network of developed lines crossing the fields. The pattern is broad enough that the county does not look like scattered farms set inside forest. Instead, the map reads as a large farmed plateau whose character changes sharply toward several outer margins.
The southwest portion is different. Forest becomes much more continuous there, and grassland or shrubland fills many openings between the darker green patches. Similar mixtures appear along the eastern side, where the county narrows toward Kamiah. Forest accounts for 21.09% countywide, so it is substantial even though it is not evenly distributed. Grassland at 18.65% also matters because it occupies many places that would be easy to mistake for cropland if every open area were treated as agriculture.
Shrubland contributes another 7.38%, and developed land totals 4.18%. Water and wetlands are much smaller at 0.20% and 0.59%, respectively. Those small shares explain why blue and teal do not dominate the county-scale image, even though streams and wet ground can still matter locally. Reading the percentages together with the map prevents a common mistake: a small countywide share can still be important where it is concentrated, while a large share such as agriculture may have very different surroundings from one part of the county to another.
Small town centers stand out clearly on the impervious surface view
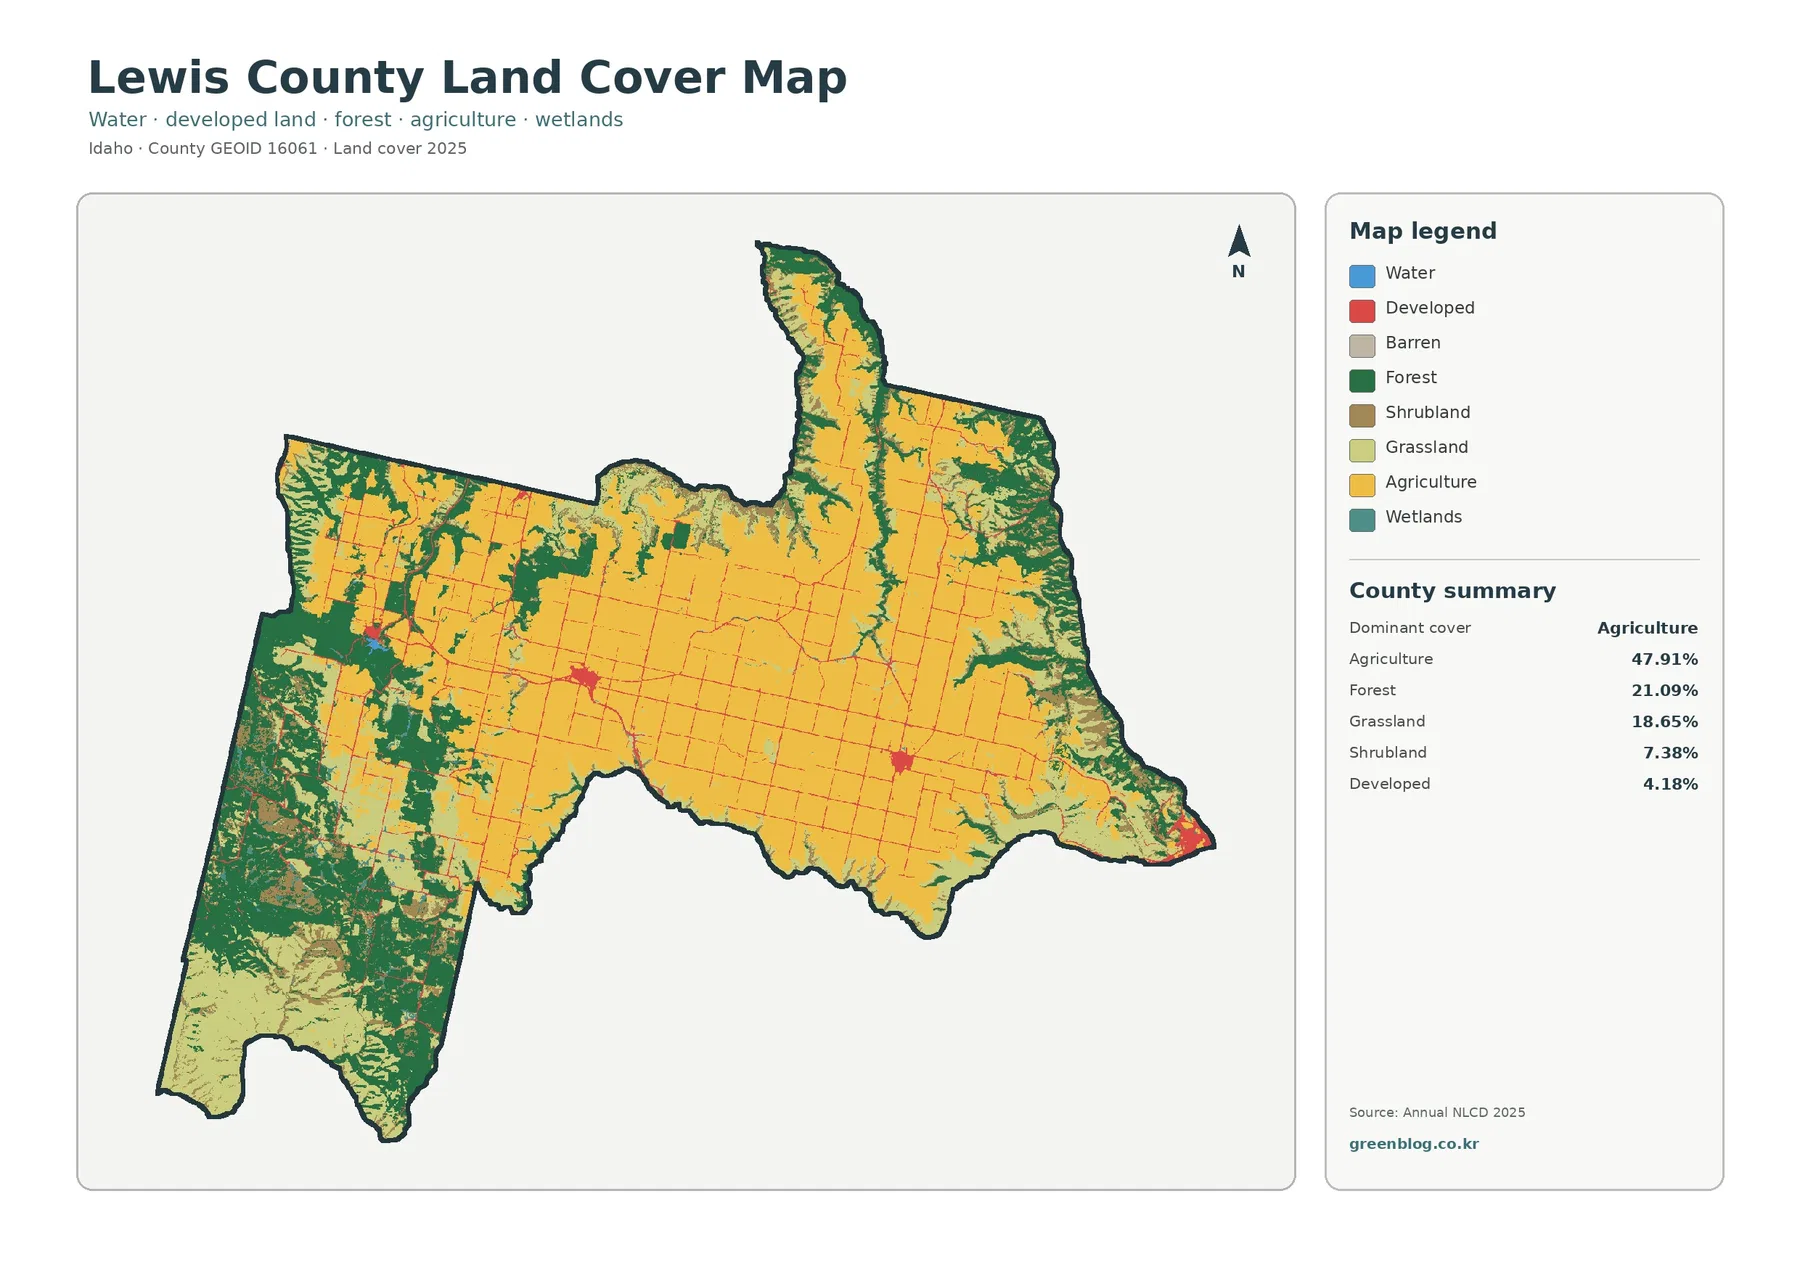
The impervious map strips away most land-cover colors and focuses on hard surfaces such as pavement, rooftops, and parking areas. Lewis County has a mean impervious value of 1.25%, and only 0.18% of its area is summarized above the 50% impervious threshold. Those numbers are low because most of the county is field, forest, or open ground. The map still reveals distinct clusters where buildings and paved surfaces are concentrated.
The U.S. Census Bureau reference map identifies Nezperce, Craigmont, Winchester, Reubens, and the Lewis County portion of Kamiah. Using those places as orientation points makes the impervious image much easier to read. Nezperce and Craigmont appear as compact centers set within the farmed prairie, while the eastern tip near Kamiah carries another stronger concentration. Thin orange lines connect and branch away from these centers, reflecting hard-surface corridors at a scale where individual road lanes are far too small to measure directly.
Developed cover and impervious percentage should not be treated as interchangeable. A low-density developed cell can contain grass, trees, bare soil, a house, and a driveway, so it may count as developed while remaining mostly permeable. Impervious data instead records the fraction of a cell covered by hard surfaces. Comparing the 4.18% developed-cover statistic with the 1.25% countywide impervious average therefore gives a more useful picture than expecting the two numbers to match.
The forest-and-farmland map makes the Camas Prairie contrast easier to see
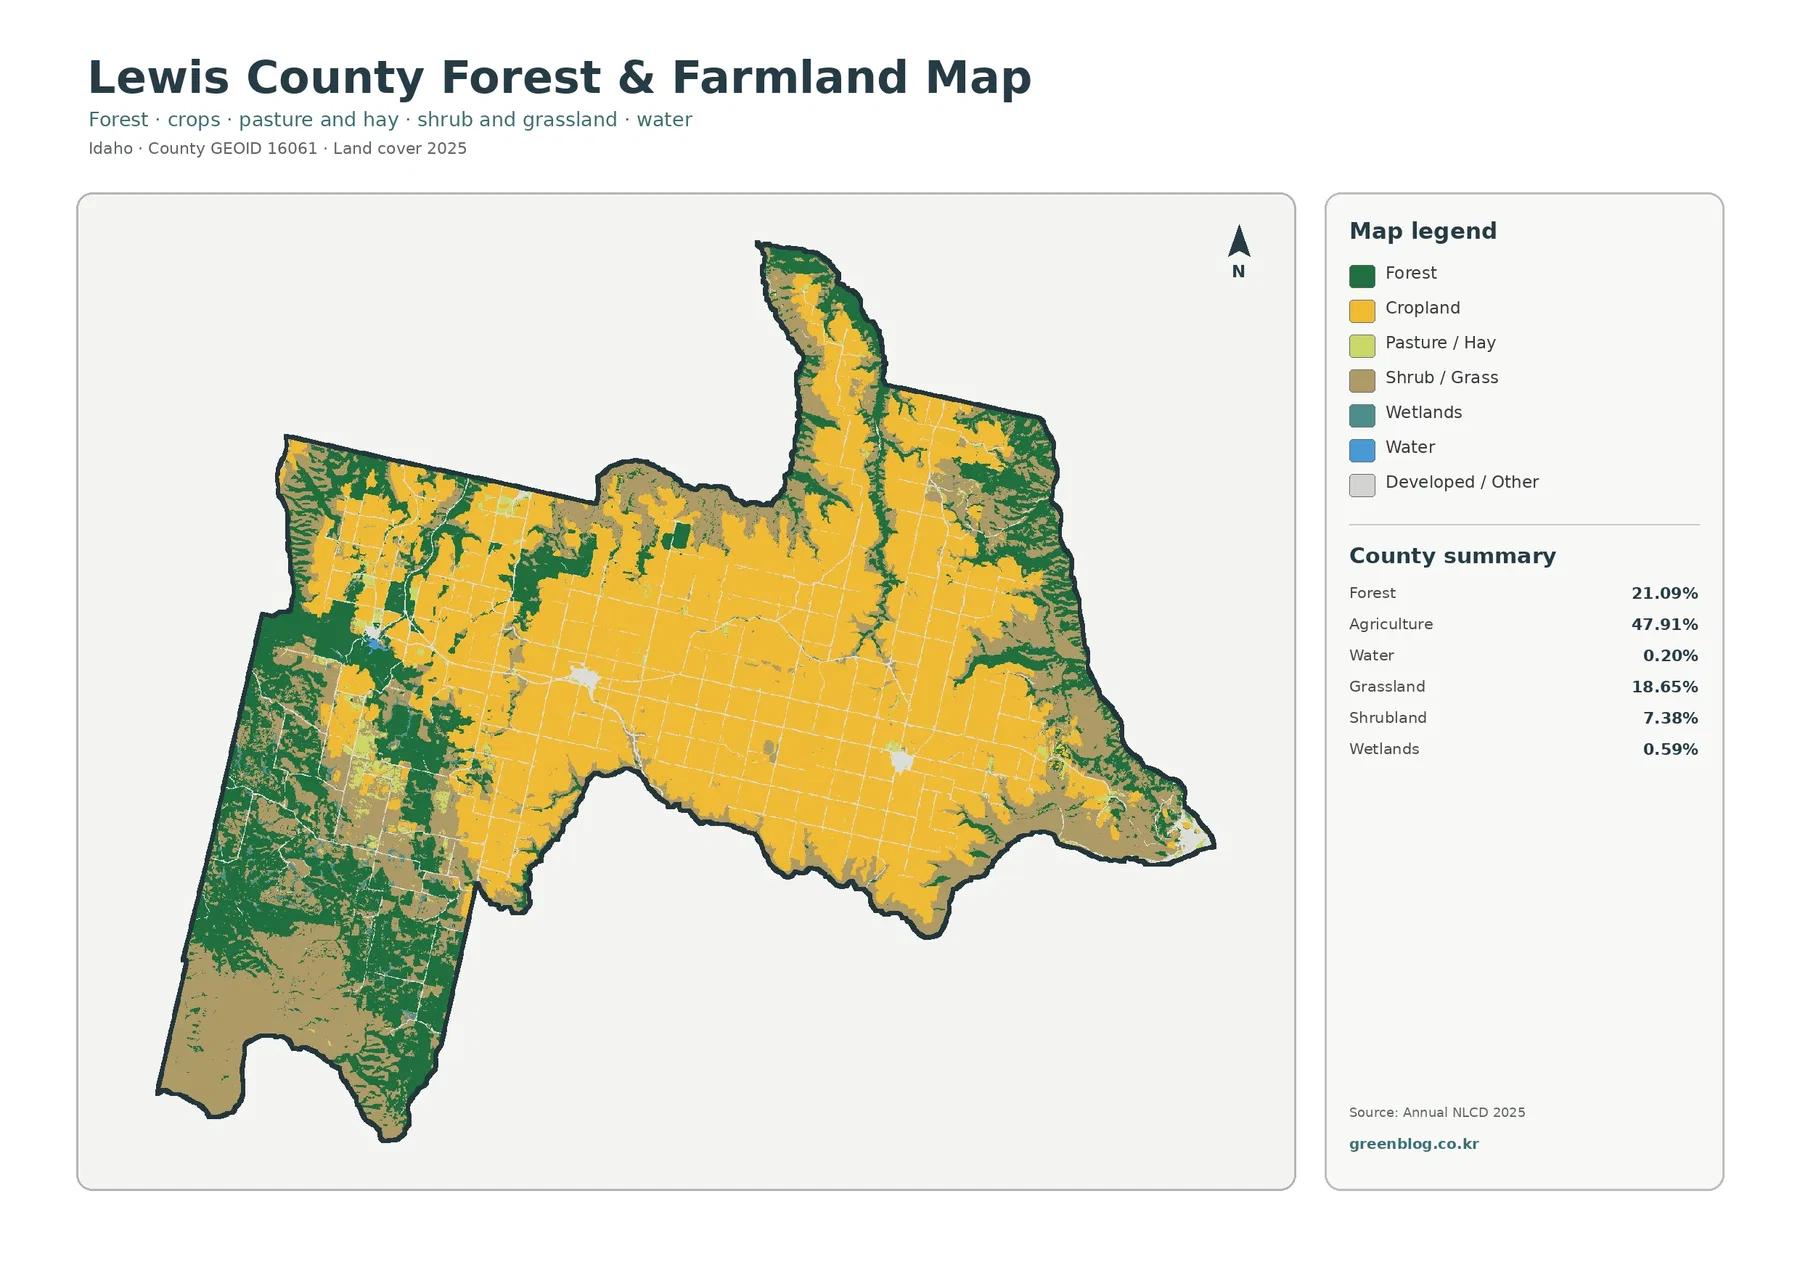
A simplified legend is helpful when the main question is where farming gives way to forest. Cropland forms a wide, almost continuous field across the central prairie, while forest occupies much larger blocks to the southwest and along parts of the eastern edge. Pasture or hay, shrub and grass cover, wetlands, and water remain visible without competing with the full set of land-cover classes. The result is a clearer boundary between working fields and the more wooded or open terrain around them.
This pattern matches the county’s agricultural context. University of Idaho Extension describes Lewis County programming around prairie-area field crop production, variety trials, applied research, and producer education. A University of Idaho account of a winter canola tour also describes a variety trial on the Camas Prairie outside Craigmont. Those sources support the importance of field crops in the local landscape, but the land-cover map does not identify wheat, canola, barley, or any other crop in a specific field. Yellow should be read as agricultural cover, not as a crop inventory.
The map is also useful for avoiding an opposite mistake: not every pale or open-looking patch is farmland. Grassland and shrub/grass classes remain extensive, especially around the southwest and eastern margins. Forest edges are irregular rather than forming a simple straight border against cropland. For habitat comparison or classroom work, it is often better to trace these transitions first and then return to the full land-cover map to see which open-cover class occupies a particular area.
Mapped differences from 1985 to 2025 are scattered rather than concentrated in one band
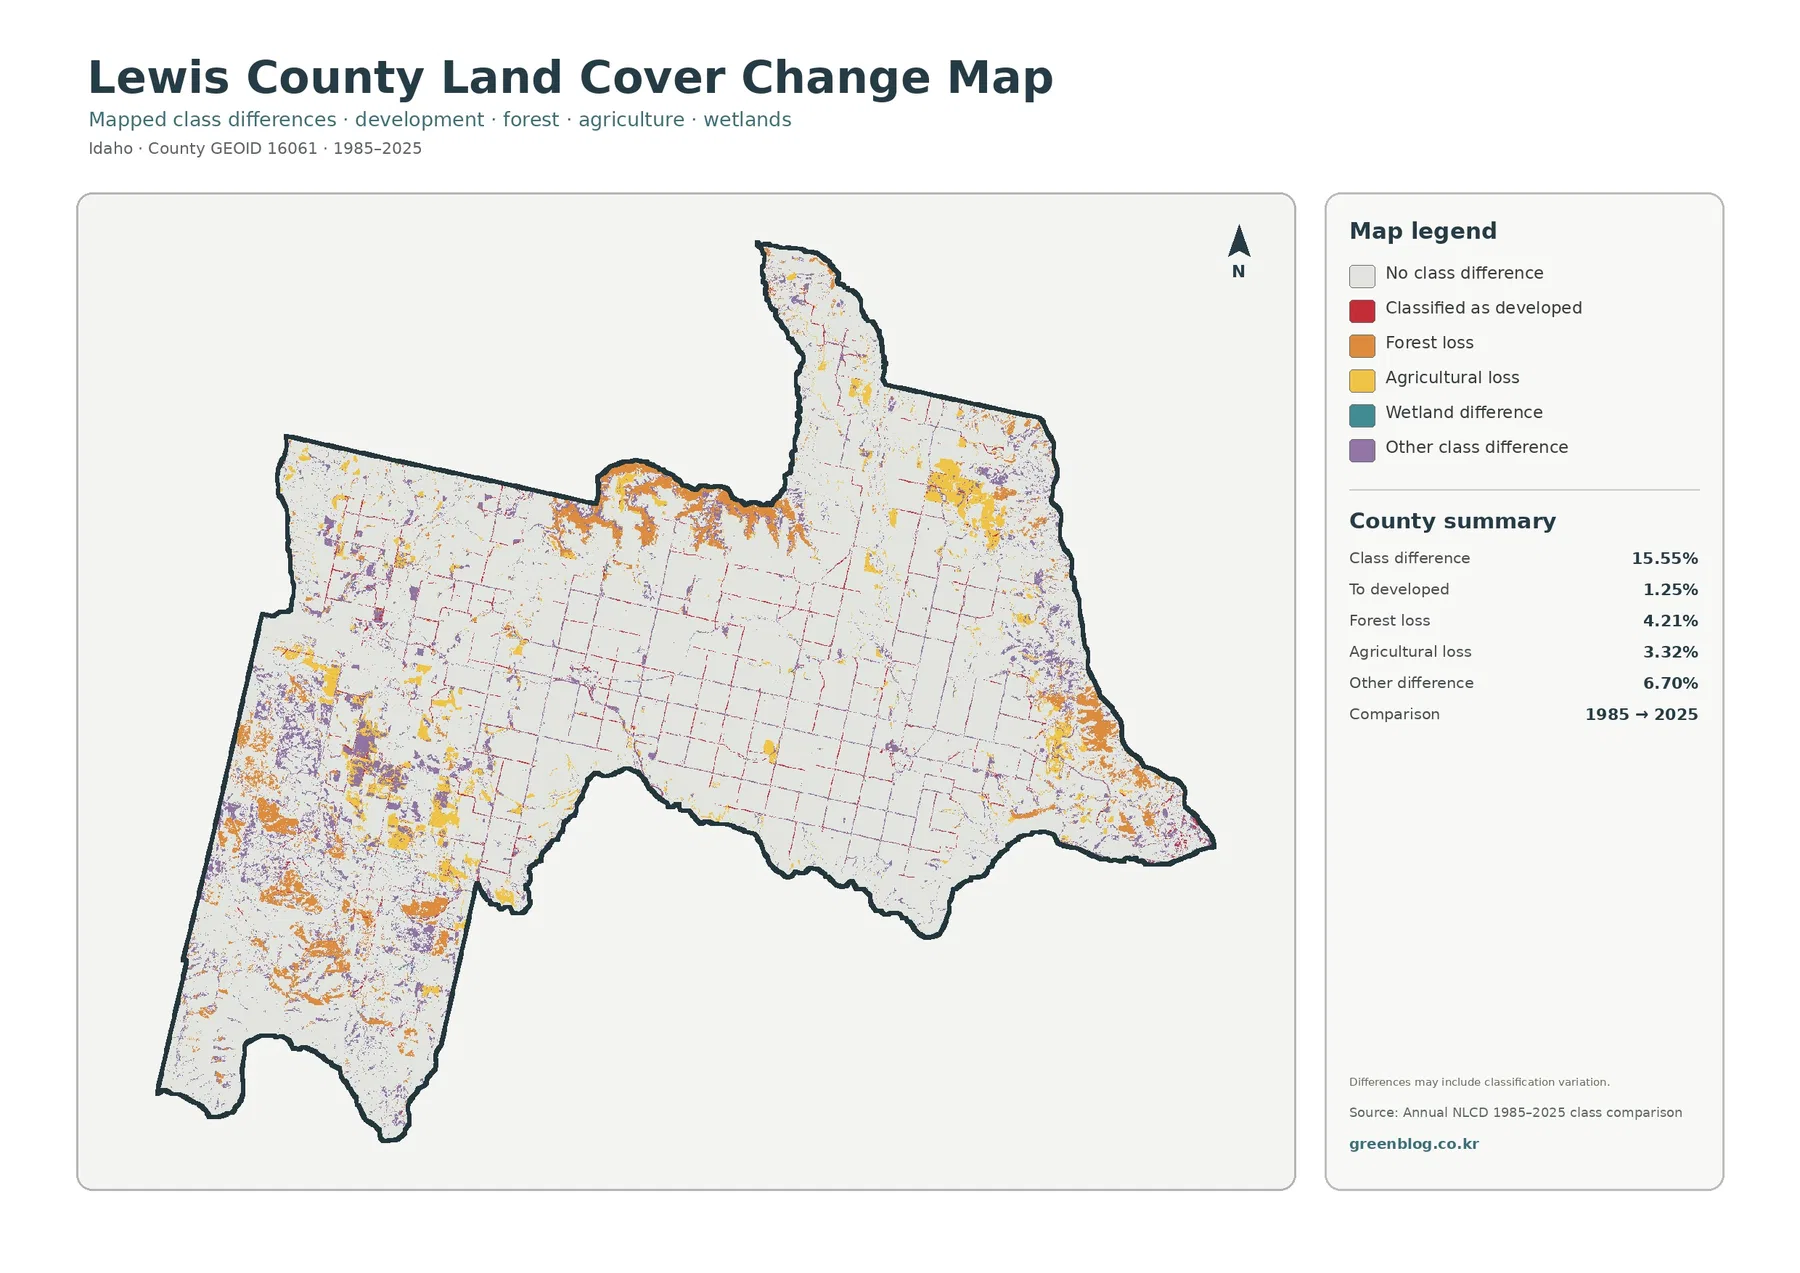
The change map compares class assignments at the same locations in 1985 and 2025. Lewis County has a 15.55% overall class difference. The summary lists 6.70% as other class difference, 4.21% as forest loss, 3.32% as agricultural loss, and 1.25% as classified to developed. These are comparison categories, not direct measurements of acres permanently lost or gained. A cell can be marked as different because its mapped class changed between the two selected years, and classification variation can contribute to the result.
Orange forest-loss patches are most noticeable in portions of the southwest and along several outer wooded areas, but they also appear in smaller pieces elsewhere. Yellow agricultural-loss marks occur around farm blocks rather than covering the entire cultivated center. Red developed differences are thin and localized, often appearing where the impervious map already shows towns or road corridors. Purple other-class differences are more widely scattered and make up the largest single category in the summary.
A useful reading method is to start with a changed patch and then locate the same spot on the 2025 land-cover map. That separates two questions: what the cell is classified as now, and whether its class differs from 1985. The map itself warns that differences may include classification variation, so orange should not automatically be labeled logging or wildfire, and yellow should not automatically be labeled farm abandonment. Year-by-year Annual NLCD layers, aerial imagery, or local records are needed when the cause and timing matter.
Lawyer Creek and the Clearwater edge help orient the narrow eastern end
Lewis County’s eastern shape can be hard to understand from land-cover colors alone. Nez Perce Tribe Water Resources describes Lawyer Creek as flowing east through Lewis and Idaho counties to its confluence with the Clearwater River at Kamiah. That named watershed provides a useful geographic reference for the narrow eastern part of the county, where agriculture, forest, grass or shrub cover, and developed land occur close together. The land-cover map is not a stream-navigation or flood-hazard map, but a verified river and creek framework makes the pattern easier to place on the ground.
State law describing the Lewis County boundary also uses the Clearwater River, Salmon River, and several creeks and canyons as boundary segments. This helps explain why parts of the outline follow irregular drainage features instead of a simple rectangular survey grid. The outer breaks also contain more forest and open cover than the broad agricultural center. That is a spatial association visible in the maps; it should not be turned into a simple claim that one topographic factor alone caused the present vegetation.
Water covers only 0.20% and wetlands 0.59% in the county summary, so narrow channels can be visually minor at this scale. Annual NLCD uses 30-meter raster cells, and a small stream may share a cell with vegetation or another surface. For watershed work, the map is best used to compare the surrounding cover of a drainage area rather than to trace an exact channel edge. A dedicated hydrography layer and recent aerial imagery are better choices for detailed stream geometry.
Choose the map by the question, then compare the same location across views
For a quick county overview, begin with the full land-cover map. It answers the broadest question: where are agriculture, forest, grassland, shrubland, developed land, wetlands, and water in 2025? Once the farmed center and wooded margins are clear, the forest-and-farmland map reduces the legend and makes the boundary between major working-land and forest classes easier to follow. This two-step approach is especially useful for Lewis County because agriculture and grassland are both extensive and should not be merged simply because both look open on the ground.
Use the impervious map when the question shifts to towns, roads, and hard surfaces. A developed class on the land-cover map can cover a larger footprint than the truly impervious parts inside it, so the fractional surface map adds detail. Nezperce, Craigmont, and the Kamiah area are convenient reference points when comparing the two views. For presentations, placing the current land-cover map beside the impervious map can show how small the built footprint is relative to the surrounding agricultural and forest land without relying on population statistics.
The change map works best after the present-day maps, not before them. It highlights where the 1985 and 2025 classes differ, but it does not replace either year’s full classification or explain the cause. In a classroom or local reference project, one practical sequence is current land cover, simplified forest/farmland, impervious surface, and finally change. Keep the legend, date, and county outline visible when printing so that a color used in one map is not accidentally assigned the meaning it has in another.
Thirty-meter classification is good for landscape patterns, not parcel decisions
Annual NLCD is a raster product built from satellite-based information at 30-meter spatial resolution. In plain terms, the county is divided into grid cells and each cell receives a representative class or percentage. Field edges, narrow tree rows, small buildings, and creek banks can fall inside the same cell. The mapped boundary between two classes is therefore generalized and should not be treated as a surveyed property line or a precise measurement of a single farm field.
The date matters as much as the cell size. The current maps use 2025 land-cover information, so construction, harvest, regrowth, crop conversion, or other changes after that observation period may not appear. The change map compares 1985 with 2025, which means it can miss a sequence in which a place changed more than once between the endpoints. If a project depends on when a change occurred, intermediate Annual NLCD years and recent aerial photography are necessary.
These maps are strongest as county-scale reference material: comparing the farmed prairie with forested margins, locating the small developed centers, seeing where impervious surfaces cluster, and flagging areas with mapped class differences. They are not substitutes for Lewis County parcel records, zoning information, ownership data, engineering surveys, or site inspections. Keeping that boundary between landscape reference and legal or site-specific evidence makes the four-map set more useful rather than less useful.
Frequently Asked Questions
What is the largest 2025 land-cover class in Lewis County?
Agriculture is the largest class at 47.91%. Forest follows at 21.09% and grassland at 18.65%. The map places the broadest agricultural cover across the county interior, with larger forest blocks around the southwest and parts of the eastern margin.
Why do Nezperce, Craigmont, and Kamiah stand out on the impervious map?
They are settlement areas where pavement, rooftops, and other hard surfaces are more concentrated than in surrounding fields or forest. The countywide mean impervious value is only 1.25%, so compact town centers and road corridors remain visually distinct even though they occupy a small share of Lewis County.
Does 4.21% forest loss on the change map mean 4.21% of the county was definitely logged?
No. The value represents cells placed in the forest-loss comparison category between 1985 and 2025, and the map notes that classification variation may be included. Confirming a cause such as harvest or fire requires intermediate land-cover years, aerial imagery, or local land-management records.
Map File Information
The four original Lewis County land-cover maps are provided together in one ZIP file.
- Included Versions: land cover, forest and farmland, impervious surface and developed land, land-cover change
- File Type: ZIP containing four JPG files
Related Maps
Sources and References
- MRLC – Annual NLCD Data (official Annual NLCD data access used for current land cover and long-term comparison)
- U.S. Geological Survey – Annual NLCD Land Cover Classification (official descriptions of land-cover classes and the 30-meter raster product)
- University of Idaho Extension – Agriculture in Lewis County (prairie-area field crop production, research, and producer education in Lewis County)
- Nez Perce Tribe Water Resources – Reservation Watersheds (Lawyer Creek watershed geography and its confluence with the Clearwater River at Kamiah)
- U.S. Census Bureau – Idaho Geographic Areas Reference Map (Lewis County boundary and mapped places including Nezperce, Craigmont, Winchester, Reubens, and Kamiah)
Green Map creates custom-edited map images using open geographic data sources such as geoBoundaries, Natural Earth, OpenStreetMap, and government open data.
These maps are edited visual materials, not raw data files, and are provided for education, documents, presentations, and graphic reference.