Kootenai County has one of the clearest land-cover contrasts in northern Idaho: a heavily forested eastern and southern landscape, a chain of large water bodies centered on Lake Coeur d’Alene, and a much more developed northwestern prairie. The 2025 summary classifies 61.75% of the county as forest, followed by 10.71% developed land, 9.06% shrubland, 7.13% agriculture, and 5.25% water. The four maps on this page separate those patterns so you can compare present cover, forest and farmland, impervious surfaces, and mapped class differences from 1985 to 2025.
The four original JPG maps are also available together in one download. They are useful when you want a county-wide reference rather than a parcel map: the general map is best for the full mix of cover types, the simplified forest-and-farmland view makes the prairie and agricultural blocks easier to see, the impervious map isolates paved and built surfaces, and the change map highlights places where the classified cover differs between the two comparison years. None of these maps shows zoning, ownership, property lines, or development rights.
Table of Contents
An urban prairie beside a much larger forested landscape
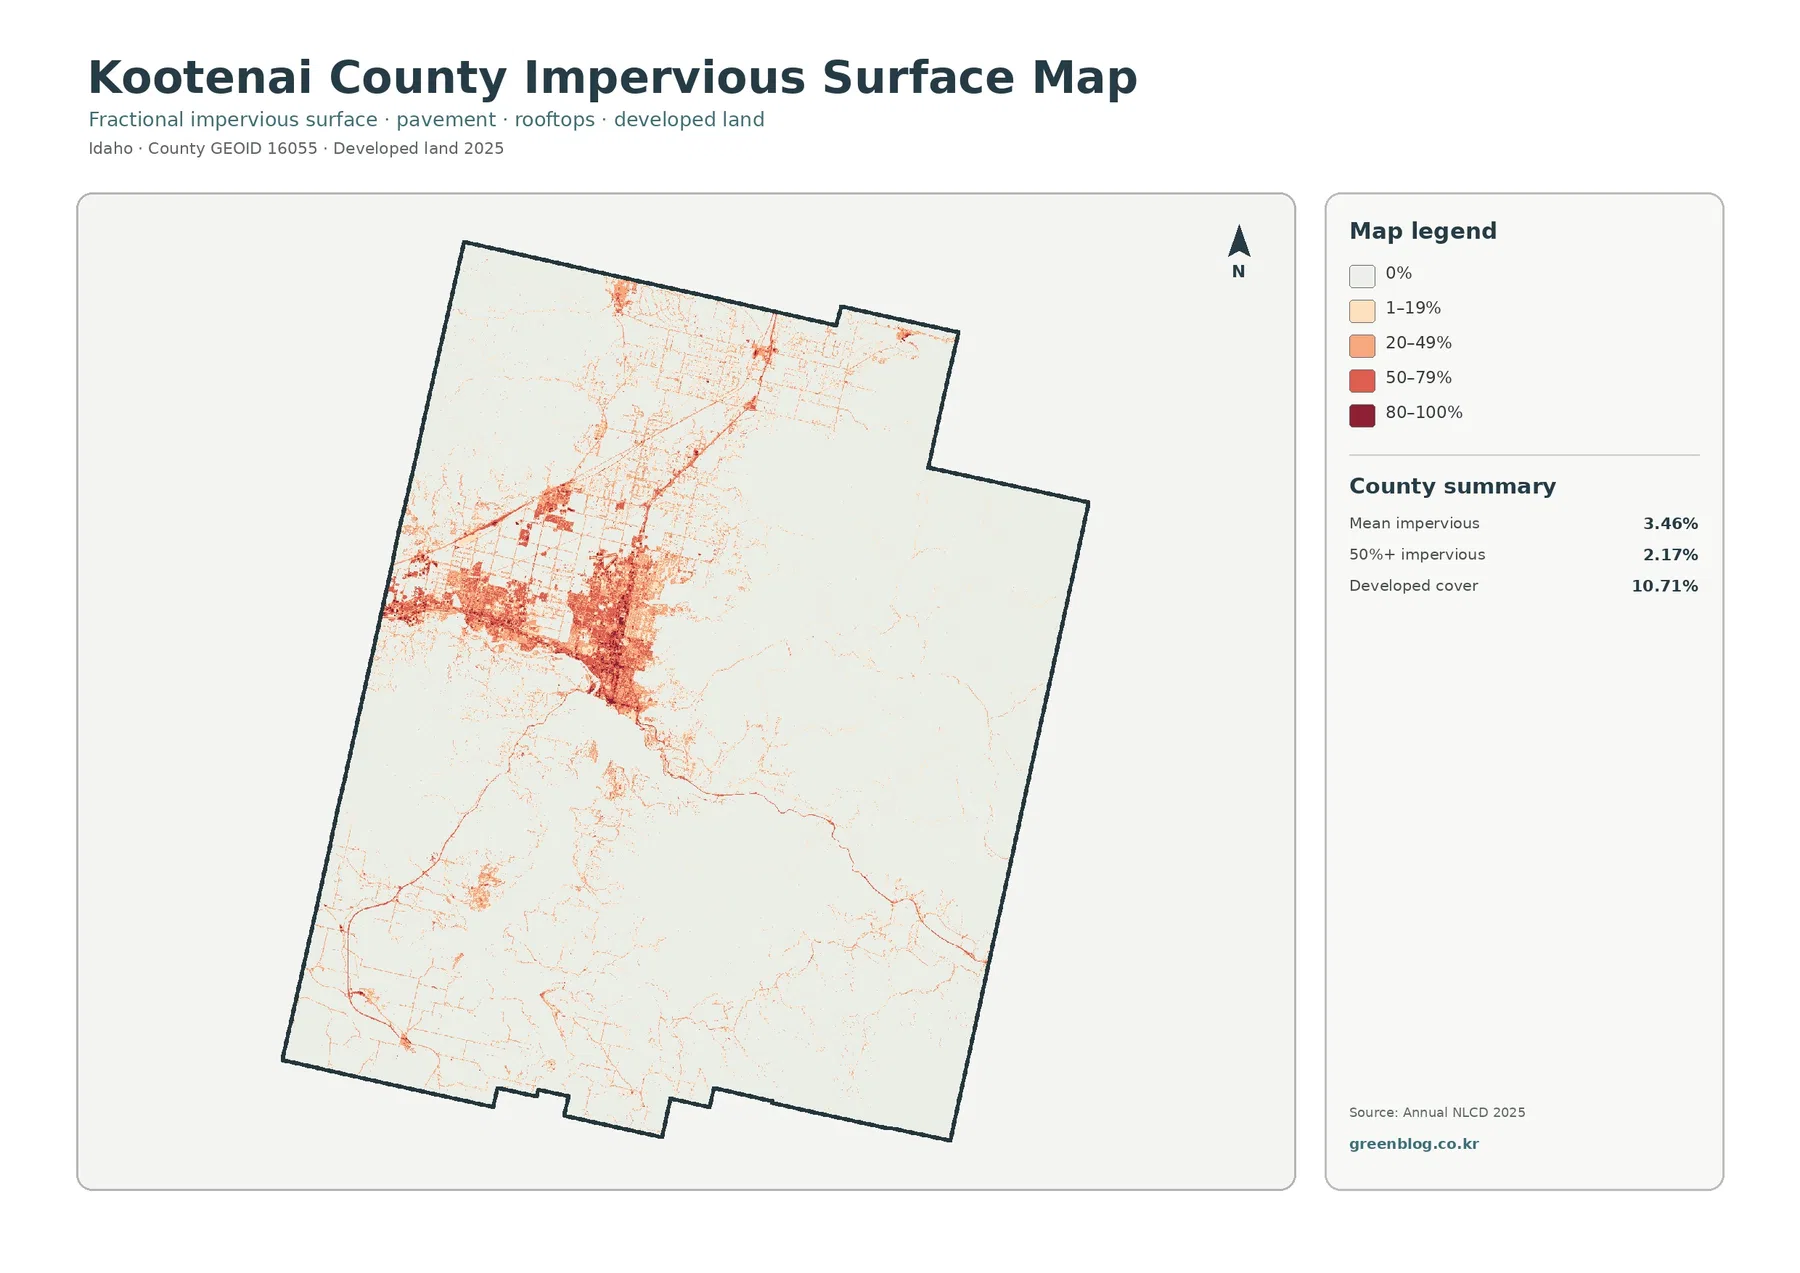
The general land-cover map is dominated by dark green across the county’s eastern half and much of the south. That broad forest is not a thin belt around the county edge; it forms large connected blocks around the eastern and southeastern sides of Lake Coeur d’Alene and continues through much of the interior away from the northwestern population centers. The 61.75% forest share therefore matches what the eye sees immediately. Forest is the background against which most of the county’s other cover types appear.
The northwestern part of the map looks very different. Developed cover forms a large, irregular red area around Coeur d’Alene and Post Falls, with additional development extending toward Hayden and Rathdrum and along the road network that connects those communities. The Idaho Department of Environmental Quality describes the Rathdrum Prairie as the Idaho portion of the Spokane Valley–Rathdrum Prairie system extending through Coeur d’Alene and Post Falls toward the Washington line. That geographic context helps explain where the flatter, more intensively settled portion of the county sits, although the land-cover map by itself does not identify the cause or date of development.
Water provides a second strong organizing feature. Lake Coeur d’Alene occupies a large central-to-southern area, while several smaller lakes appear farther north. Water accounts for 5.25% of the county in the 2025 summary, a large enough share to shape the map visually even though forest is far more extensive. Along lake margins, the colors change rapidly from water to forest, wetland, developed land, and occasional agricultural or open-cover classes. Those edges are worth examining closely because county-wide percentages cannot show how quickly land cover changes around shorelines.
Impervious surfaces isolate the Coeur d’Alene–Post Falls footprint
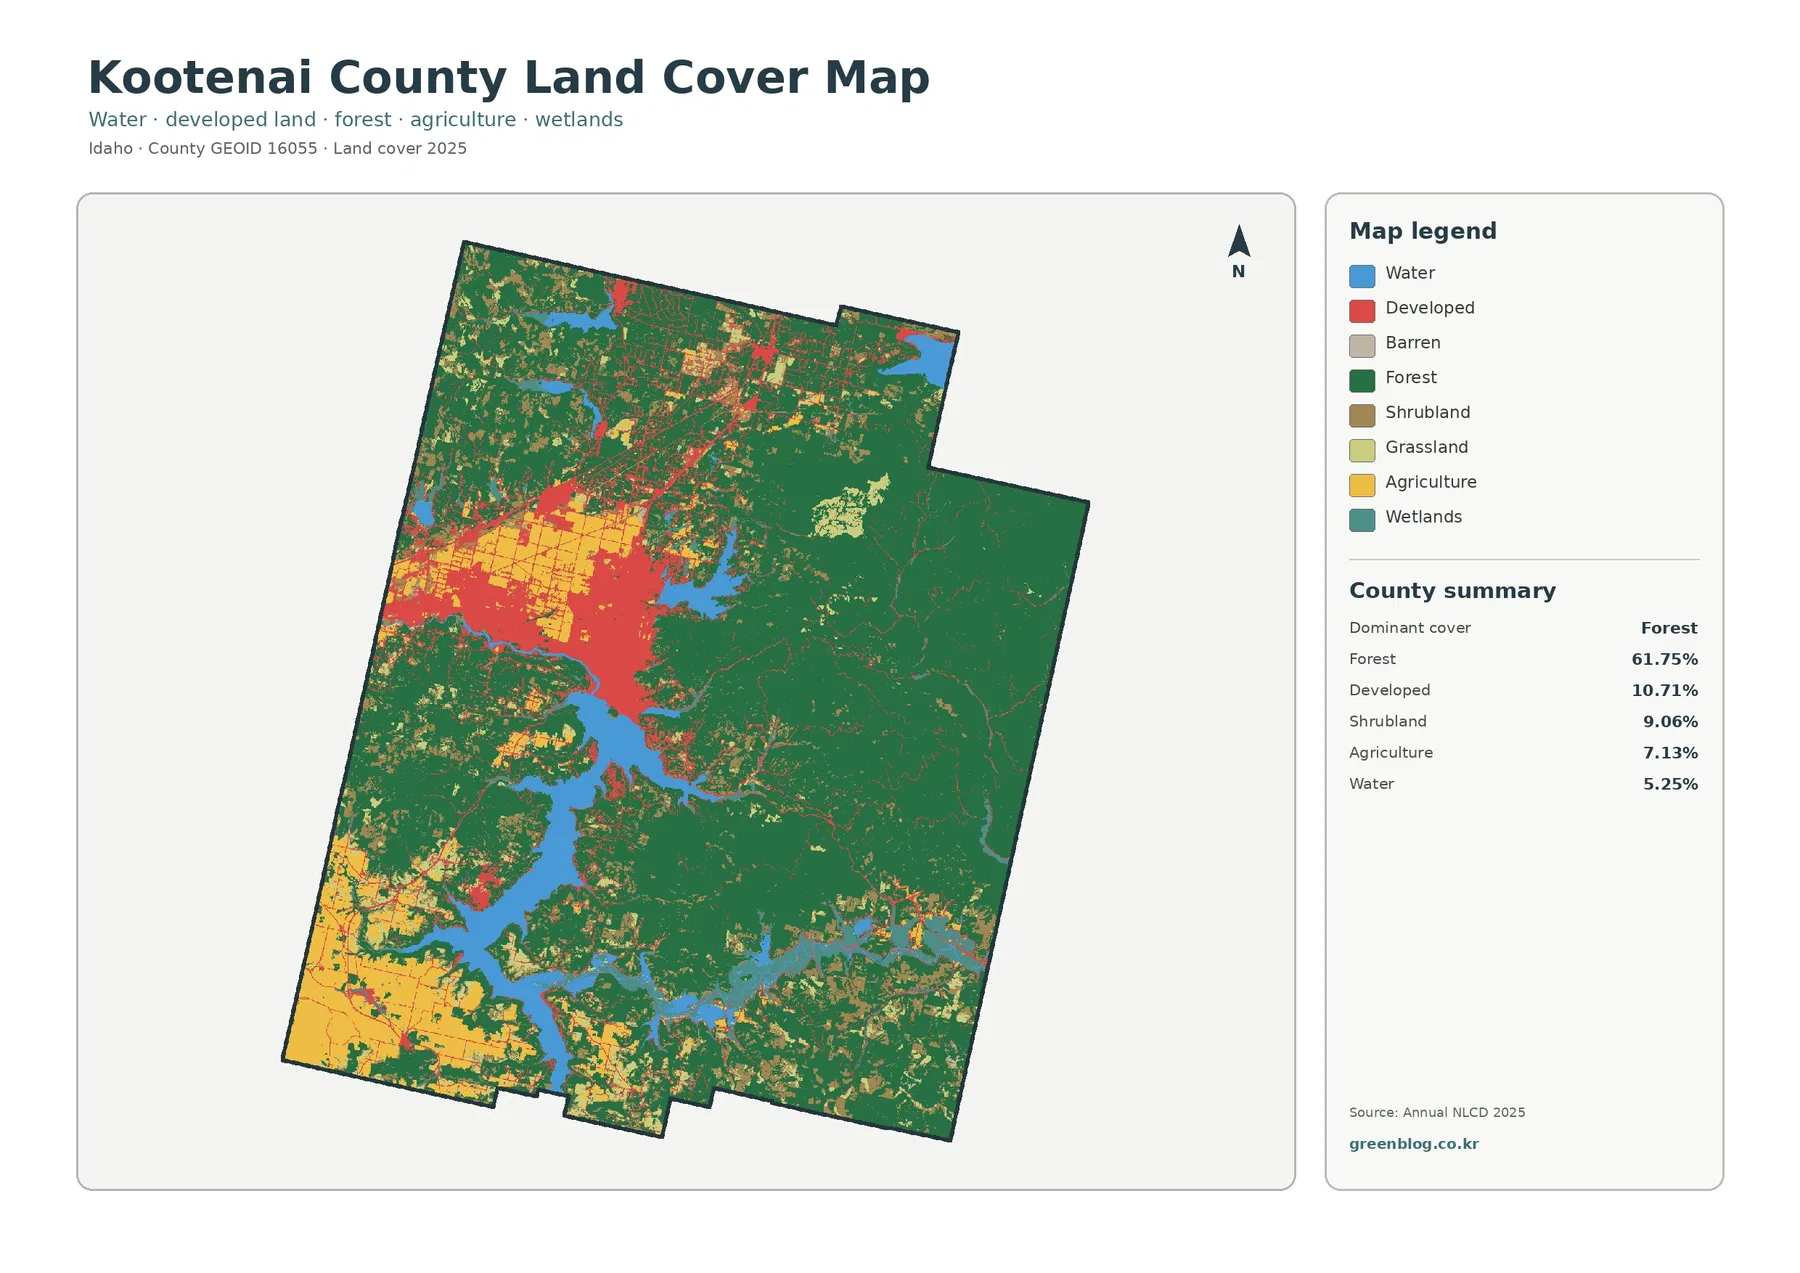
The impervious-surface map strips away most land-cover categories and asks a narrower question: where are roofs, pavement, parking areas, and other surfaces that shed water rather than letting it soak into the ground? Kootenai County’s mean impervious value is 3.46%, and 2.17% of the county falls in cells with at least 50% impervious surface. Those averages are low because forest occupies such a large share of the county, but the map contains a very strong local concentration in the northwest.
The darkest tones cluster around Coeur d’Alene and Post Falls and continue through the surrounding street network. Linear marks extend toward Hayden, Rathdrum, and other developed areas, while small concentrations also appear near settlements farther north and along parts of the lakeshore. In contrast, the broad forested east and southeast remain nearly blank on this map except for thin road traces and isolated developed sites. The difference between the urban prairie and the forested interior is sharper here than on any of the other three maps.
Developed cover and impervious surface should not be treated as the same measurement. The 10.71% developed figure comes from land-cover classes that include development at different intensities, including places where lawns, trees, and other pervious ground remain inside a developed setting. The 3.46% mean impervious value measures the share of hard surface within raster cells. A low-density residential cell can therefore count as developed without being mostly pavement or roof. Looking at both maps together gives a better sense of the extent of settlement and the intensity of its hard surface.
The forest-and-farmland view reveals where open land is concentrated
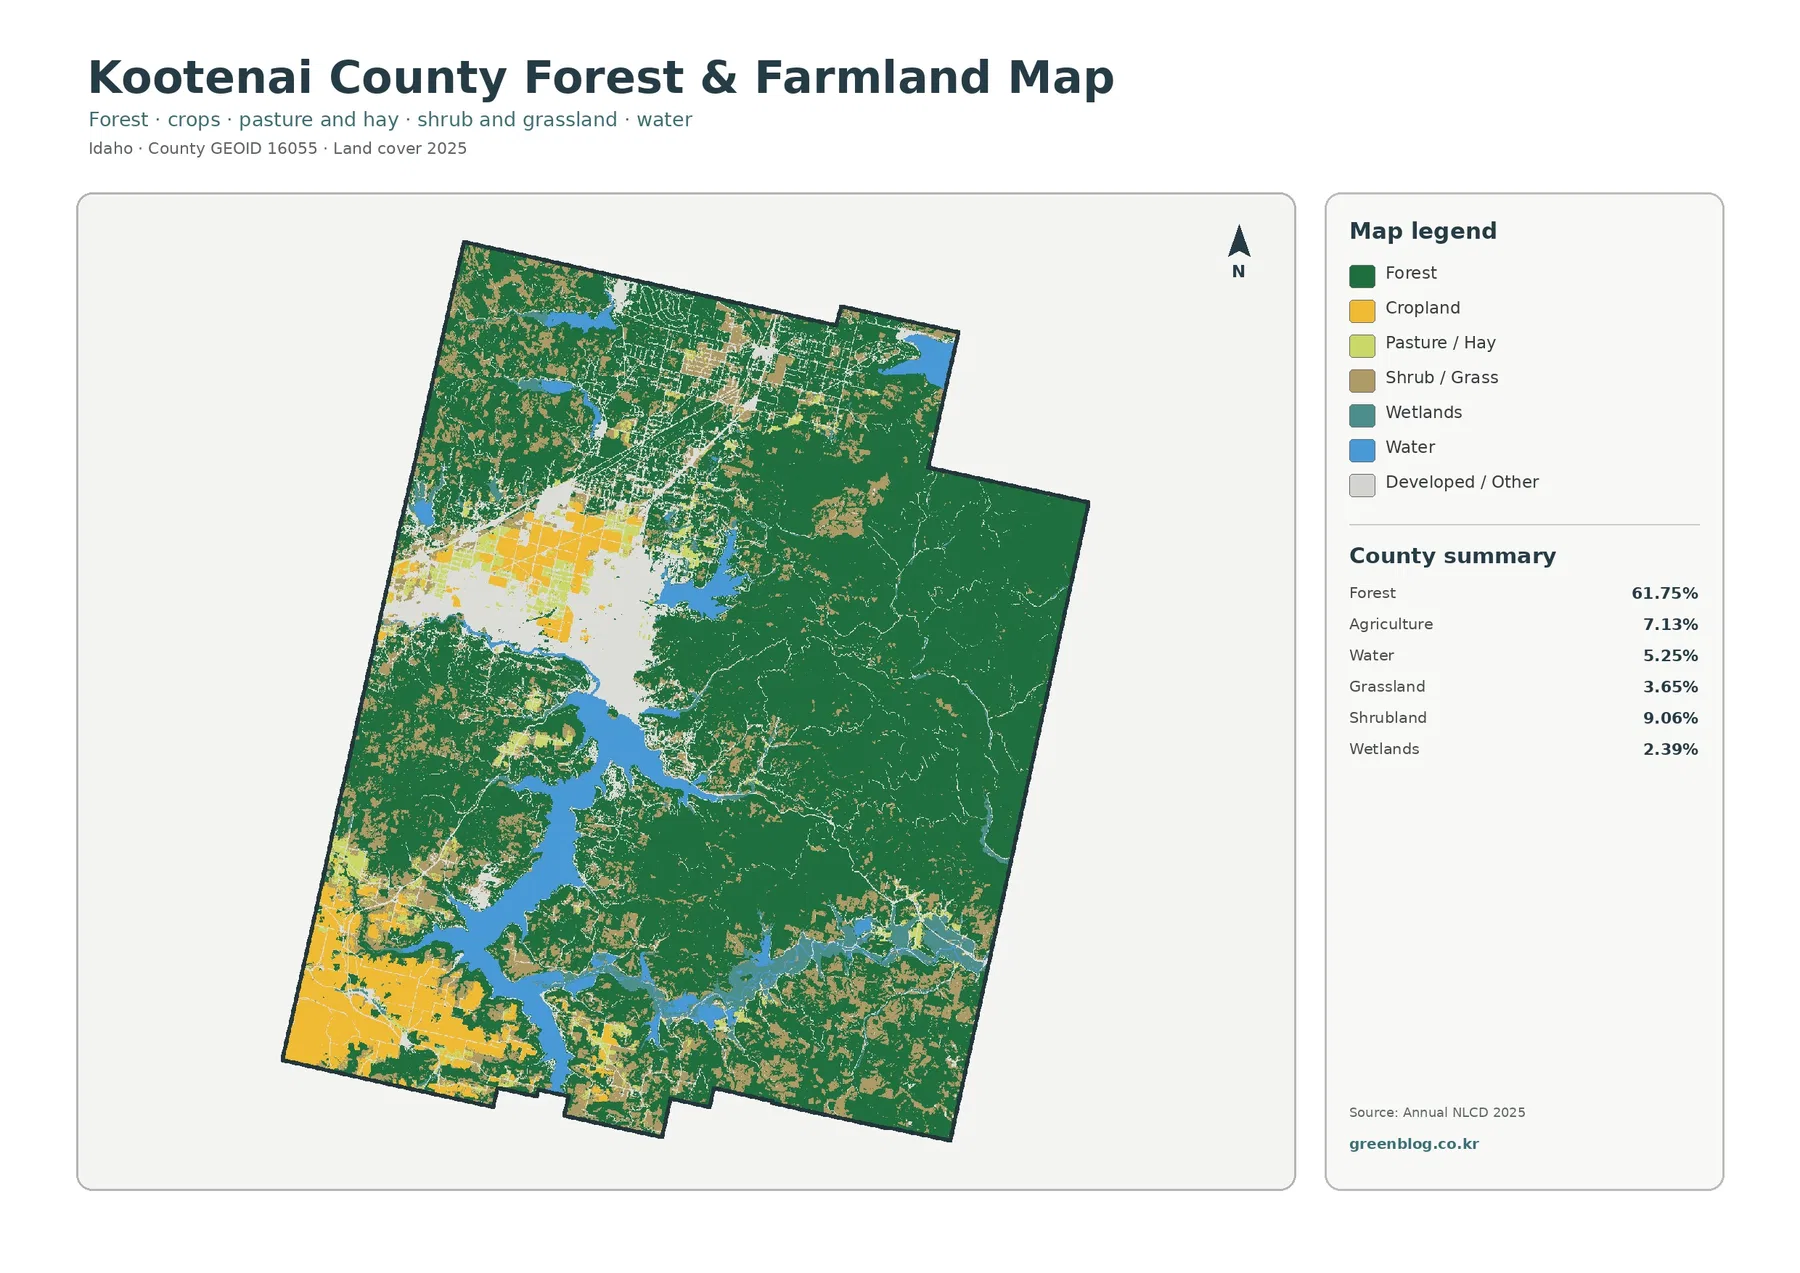
When the map is simplified to forest, cropland, pasture or hay, shrub and grass, wetlands, water, and developed or other land, the western side becomes easier to interpret. Agriculture is not spread evenly across Kootenai County. The strongest cropland blocks appear in the southwest and western portions of the county, with smaller agricultural areas around and beyond the developed prairie. East and southeast of Lake Coeur d’Alene, those yellow blocks become much less common and forest takes over again.
The summary lists agriculture at 7.13%, grassland at 3.65%, shrubland at 9.06%, and wetlands at 2.39%. The map shows why a modest county-wide agricultural percentage can still matter locally: farms are clustered rather than scattered uniformly. In the southwest, large adjoining agricultural areas stand out against surrounding forest and open cover. Near the northwestern urban area, agriculture appears in smaller pieces among developed land, creating a patchwork that is quite different from the forest-dominated east.
This is also a useful map for avoiding a common mistake. A yellow agricultural cell describes the surface cover that was classified as agricultural in the dataset; it does not tell you who owns the land, whether it is protected farmland, or what zoning applies. Likewise, a forest cell does not mean the land is public timberland or legally restricted from development. Kootenai County’s comprehensive planning documents handle land-use policy separately from environmental and natural-resource conditions, so the two kinds of information should be checked independently when a decision depends on legal land use.
The 1985–2025 map separates long-term class differences from present cover
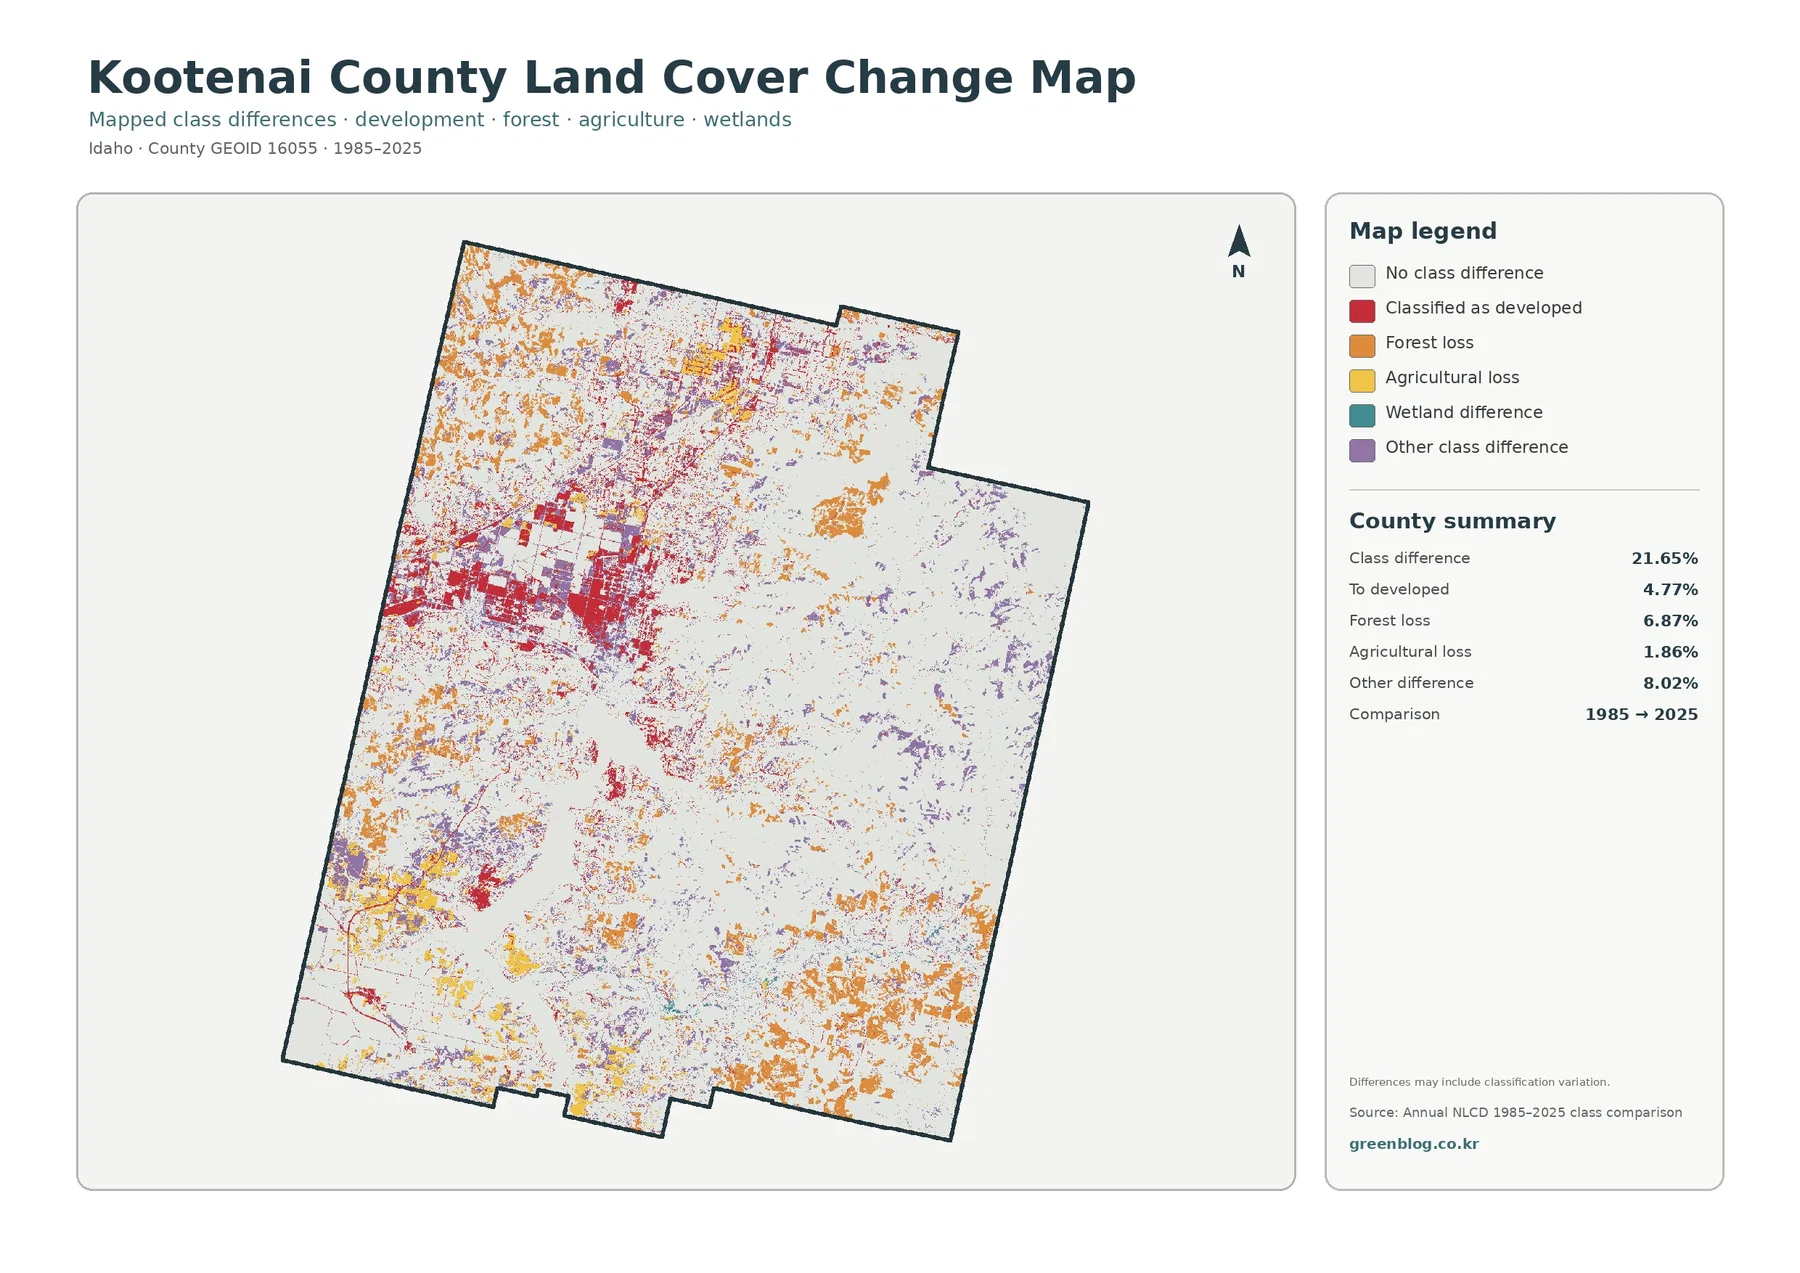
The change map compares the classified land cover in 1985 with the classification in 2025. It marks a class difference across 21.65% of Kootenai County. Within that summary, 4.77% is mapped as change to developed, 6.87% as forest loss, 1.86% as agricultural loss, and 8.02% as other class difference. These numbers do not mean that 21.65% of the county experienced one single type of physical transformation. The legend itself warns that mapped differences can include classification variation.
Red change-to-developed areas are most concentrated in the northwest, where the current land-cover and impervious maps also show the county’s largest developed footprint. That overlap makes the northwestern urban area an obvious place for further investigation. Yet the map cannot tell you which subdivision, road, commercial site, or annexation produced a particular red patch, and it cannot establish a cause. To answer those questions, the correct next step would be to compare dated aerial imagery, local development records, and year-specific land-cover products.
Orange forest-loss patches are more dispersed. They appear along forest edges and in scattered blocks in the north, west, south, and southeast rather than forming one continuous zone. Purple “other difference” also occurs widely, while agricultural-loss colors are more limited and tend to appear within or near agricultural areas. Because forest, shrubland, grassland, wetland, and agricultural classes can meet along irregular boundaries, a 30-meter raster can record class changes even where the ground pattern is complex. Treat the map as a locator for change signals, not as a final explanation of what happened.
Lake Coeur d’Alene is the easiest reference point for reading the county
For a reader who does not already know Kootenai County, Lake Coeur d’Alene is the most useful landmark on the maps. East and southeast of the lake, forest dominates. Moving north and northwest brings a quick increase in developed cover, agricultural pieces, open land, and impervious surfaces. Southwest of the lake, larger agricultural blocks become more visible. Using the lake as a fixed reference makes it much easier to compare the same part of the county across all four map products without relying on a detailed road map.
The county’s official comprehensive plan treats lakes, rivers, wetlands, vegetation, topography, growth, and development as important planning subjects. That does not turn this land-cover map into a planning decision map, but it explains why the juxtaposition of water, forest, and developed land matters when studying the county. A practical workflow is to use these maps to identify a broad pattern first—such as a developed lakeshore, a forest edge, or an agricultural block—and then move to the county’s official GIS, planning, water-quality, or parcel resources for the detailed question.
Which map should you use first?
Use the general land-cover map when your question is broad. It gives the best single-page comparison of forest, developed land, shrubland, grassland, agriculture, water, and wetlands. For Kootenai County, that means you can immediately see the forested east, the lake system, the urbanized northwest, and the agricultural west and southwest. If your question is specifically about the boundary between forest and farm or open land, the forest-and-farmland version removes much of the visual competition and is easier to read.
Choose the impervious map when hard surfaces are the main subject. It is better for comparing the built core of Coeur d’Alene and Post Falls with lower-density surroundings and with the largely non-impervious forested interior. Use the change map when you need to locate areas where the 1985 and 2025 classifications differ. A useful check is to place a change location beside the 2025 general map so you do not confuse “change category” with “current cover category.”
For classroom work, reports, or presentations, the set works well as a sequence rather than four competing graphics. Start with current land cover to establish the county pattern, simplify to forest and farmland, move to impervious surface to focus on the urban footprint, and finish with the long-term comparison. For printing, keep each legend and year label attached to the map. Cropping away the legend may make the graphic look cleaner, but it also removes the information needed to interpret the colors correctly.
Important limits: 30-meter classification, not parcel-level land use
Annual NLCD is a raster product derived from Landsat imagery at 30-meter resolution. Each cell represents an area roughly 30 meters across, so small features can be mixed with the surrounding cover. A narrow road, a small building, a thin shoreline wetland, or a clearing inside forest may not appear as a separate class if it does not dominate the cell. This is especially important along the northwestern urban fringe and around lake edges, where developed land, trees, lawns, water, and wetlands can occur close together.
The maps also describe land cover rather than legal land use. A forest classification does not reveal ownership, timber status, zoning, or development eligibility. An agricultural classification does not establish a protected farm designation, and a developed class is not a substitute for a city boundary. Kootenai County planning and parcel resources should be used for those questions. The land-cover set is best treated as a county-scale environmental reference that helps you decide where more detailed research is needed.
Time matters as well. The current maps summarize 2025, while the change map compares 1985 with 2025. It does not show every intermediate transition during those four decades. MRLC also cautions that comparisons across different releases or methods can introduce apparent differences caused by methodology rather than real ground change. If a project depends on the date of a specific change, compare consistent annual products and add recent aerial imagery or local records before reaching a conclusion.
Frequently Asked Questions
What is the dominant land cover in Kootenai County?
Forest is the dominant 2025 class at 61.75%. It is especially extensive east and southeast of Lake Coeur d’Alene, while the northwest contains a much larger mix of developed land, agriculture, and open cover.
Why is developed land 10.71% while mean impervious surface is only 3.46%?
Developed land is a set of land-cover classes that can include lawns, trees, and other pervious ground. Mean impervious surface measures the hard-surface fraction within 30-meter cells, so it is expected to be lower than the total area classified as developed.
Does the 21.65% class difference mean that one fifth of the county was physically transformed?
Not necessarily. The change map records differences between the 1985 and 2025 classifications, and the product warns that classification variation can be part of that total. Specific causes should be checked with consistent annual data, aerial imagery, and local records.
Map File Information
The Kootenai County land-cover set is provided as one ZIP containing all four original JPG maps.
- Included Versions: land cover, forest and farmland, impervious/developed land, land-cover change
- File Type: ZIP containing 4 JPG files
- Intended Use: screen comparison, print reference, classroom and presentation use, regional environmental review
Related Maps
Sources and References
- MRLC – Annual NLCD (Annual land-cover, change, and impervious products through 2025)
- U.S. Geological Survey – Annual NLCD spatial resolution (30-meter raster resolution)
- Idaho Department of Environmental Quality – Rathdrum Prairie Aquifer (geographic and water-resource context for the northwestern prairie)
- Kootenai County – Comprehensive Plan (county natural-resource and long-range planning context)
- University of Idaho Extension – Kootenai County (local forestry, water-quality, and horticulture resources)
Green Map creates custom-edited map images using open geographic data sources such as geoBoundaries, Natural Earth, OpenStreetMap, and government open data.
These maps are edited visual materials, not raw data files, and are provided for education, documents, presentations, and graphic reference.