Forest is the largest 2025 land-cover class in Benewah County at 52.43%, but the county does not appear uniformly wooded. Broad agricultural blocks occupy much of the west, shrubland breaks up the central and eastern forest, and a concentrated developed area stands out near the north-central water features. This Benewah County Idaho Land Cover Map set separates those patterns into current cover, forest and farmland, impervious surface, and 1985–2025 class differences.
The four WebP maps are shown with the discussion below, while the original 2480 × 1754-pixel JPG files are available together in one ZIP. A reader can start with the countywide 2025 view, then switch to the simplified vegetation map, the hard-surface layer, or the endpoint-change map depending on the question.
Table of Contents
The 2025 map separates a western farm area from a forest–shrub interior
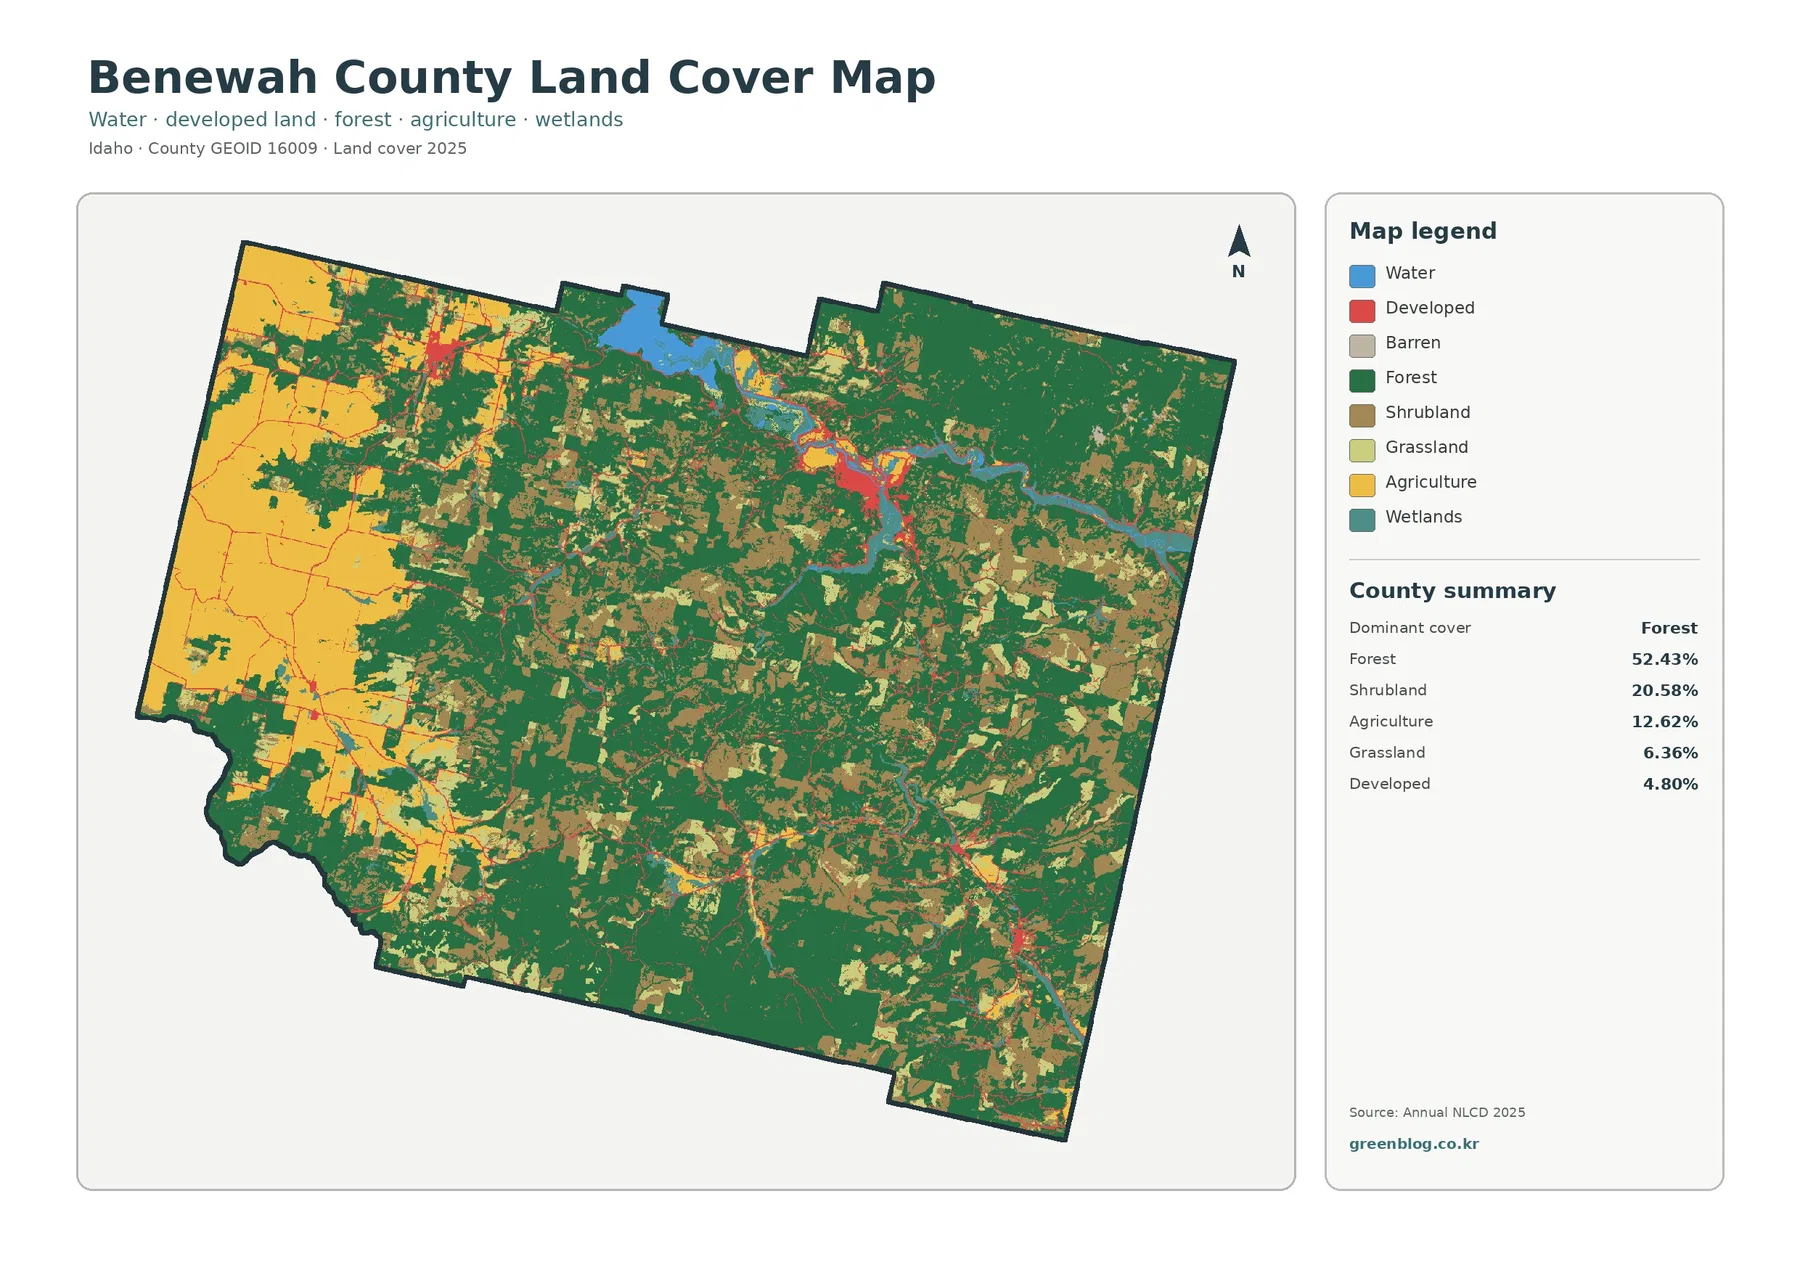
The western side contains the clearest agricultural concentration. Large yellow blocks extend across much of that area, with forest remaining along edges and between some fields. Moving toward the center, the agricultural blocks become smaller and less continuous. Forest expands across the interior, while shrubland forms many tan patches that interrupt the green cover rather than occupying one isolated corner.
The eastern half is more strongly dominated by forest and shrubland. Green forest remains the largest visible surface, yet the shrub patches are extensive enough to keep the landscape from looking like one continuous forest mass. Southward, forest, shrubland, grassland, and a few developed or agricultural traces produce a finer mosaic. The map therefore supports a more specific description than the countywide forest percentage alone.
Open water accounts for 0.91% of the supplied summary and wetlands for 2.24%. Their percentages are small, but the north-central water body and connected blue features are prominent because they contrast sharply with the surrounding vegetation. Wetland colors occur in narrower areas around water-connected or low-lying parts of the county. Water and wetlands should be treated as related but different surface classes, not merged into one category.
Forest covers more than half the county, while shrubland fills many of the gaps
Forest reaches 52.43% in the 2025 summary, making it the dominant class by a wide margin. Shrubland follows at 20.58%. Together they explain most of the green-and-tan pattern across the central and eastern portions of Benewah County. The two classes do not form clean, straight boundaries; instead, they meet along irregular edges and alternate in many smaller patches.
Grassland adds another 6.36%. On the general map, some open areas that might initially look agricultural are actually grassland or shrubland. That distinction matters because agriculture is concentrated much more strongly in the west. A broad light-colored opening in the interior should not be labeled farmland without checking the legend or the simplified vegetation map.
Land cover is a classification of the surface, not a legal land-use, ownership, or zoning map. A forest-colored cell indicates tree-dominated cover in the source classification; it does not identify who owns the land or whether it lies inside a particular public forest boundary. Likewise, agricultural color is not a parcel outline. The maps are designed for county-scale pattern comparison rather than property decisions.
The vegetation map makes the western cropland blocks easier to isolate
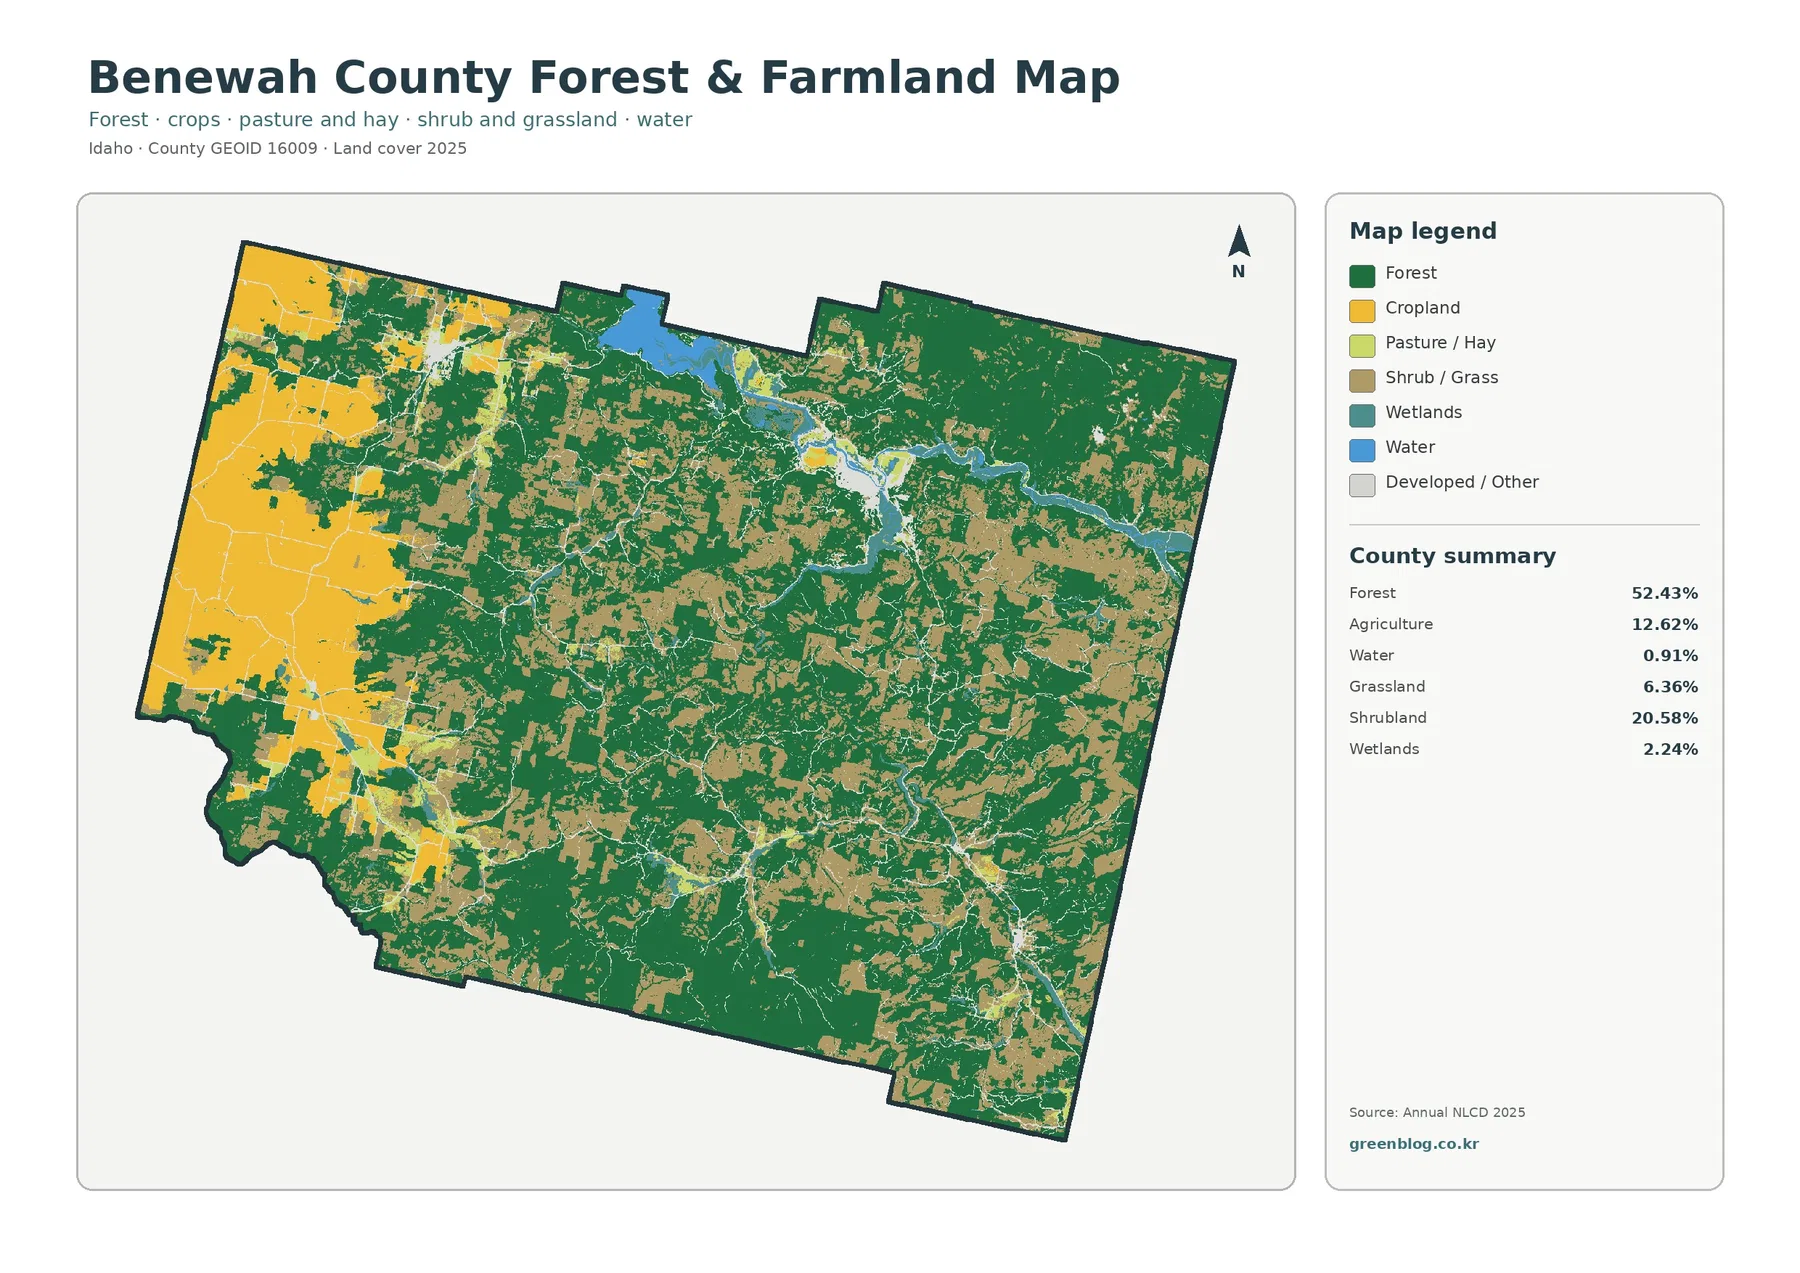
Once the smaller land-cover classes are grouped, the western agricultural area becomes even more distinct. Cropland occupies large connected blocks there, while forest surrounds and divides some of the fields. Farther east, cropland becomes much less common and the image is dominated by forest plus shrub-and-grass cover. The 12.62% agricultural share is therefore concentrated geographically rather than spread evenly across the county.
Pasture or hay appears in smaller pieces than the major cropland blocks. It is useful to keep those lighter agricultural surfaces separate from shrub-and-grass cover because both can look open compared with forest. The simplified map shows that many open areas in the central and eastern county belong to natural or semi-natural shrub and grass classes rather than the broad farm pattern visible in the west.
The north-central water features also provide a useful reference point. Forest extends close to the shoreline in several places, while developed or other light-colored surfaces cluster more strongly near one part of the water system. Narrow wetland areas are visible along portions of the water-connected landscape. This relationship can be described spatially, but the map alone does not establish why a particular wetland, field, or developed patch occurs there.
Hard surfaces are sparse countywide but concentrated in a few nodes
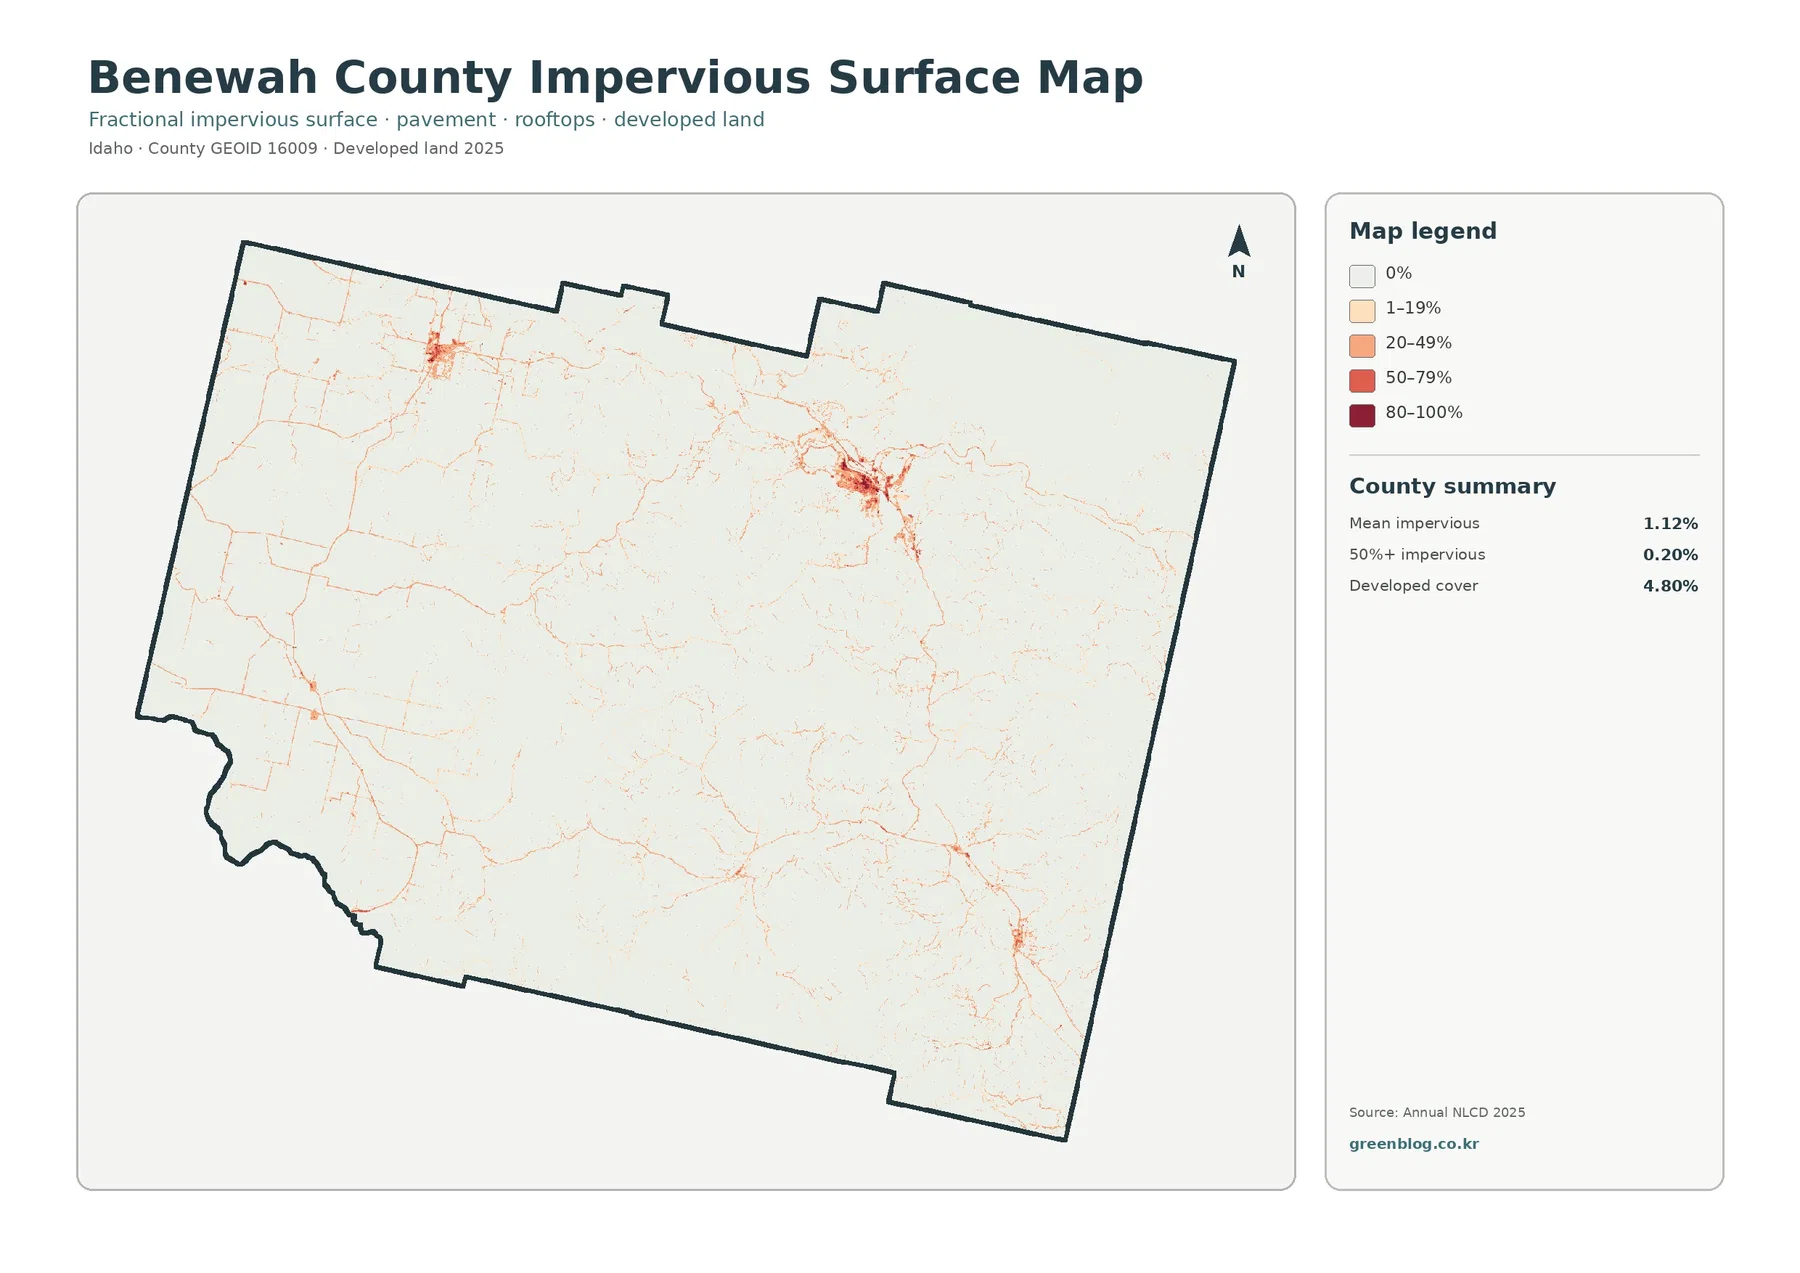
Impervious surface means rooftops, pavement, parking areas, and other hard surfaces that do not readily absorb water. Benewah County has a countywide mean of 1.12%, while the area mapped at 50% or greater impervious cover is only 0.20%. Those values are much lower than the 4.80% developed-land share because developed classes can include lawns, trees, soil, and other permeable ground around buildings and roads.
The strongest hard-surface concentration appears near the north-central part of the county. A smaller cluster is visible toward the northwest, and another developed node appears in the southeast. Thin lines connect or extend from these centers, but most of the county remains very light on the impervious map. That pattern matches a landscape where developed surfaces occupy limited locations within much larger forest, shrubland, and agricultural areas.
This layer should not be used as a street map. It does not label route names, legal access, parcel boundaries, or public and private roads. The narrow lines only indicate where hard-surface fractions are detected within the raster cells. A property, transportation, or permitting question requires more detailed current records.
The 1985–2025 comparison is dominated by cells classified as forest loss
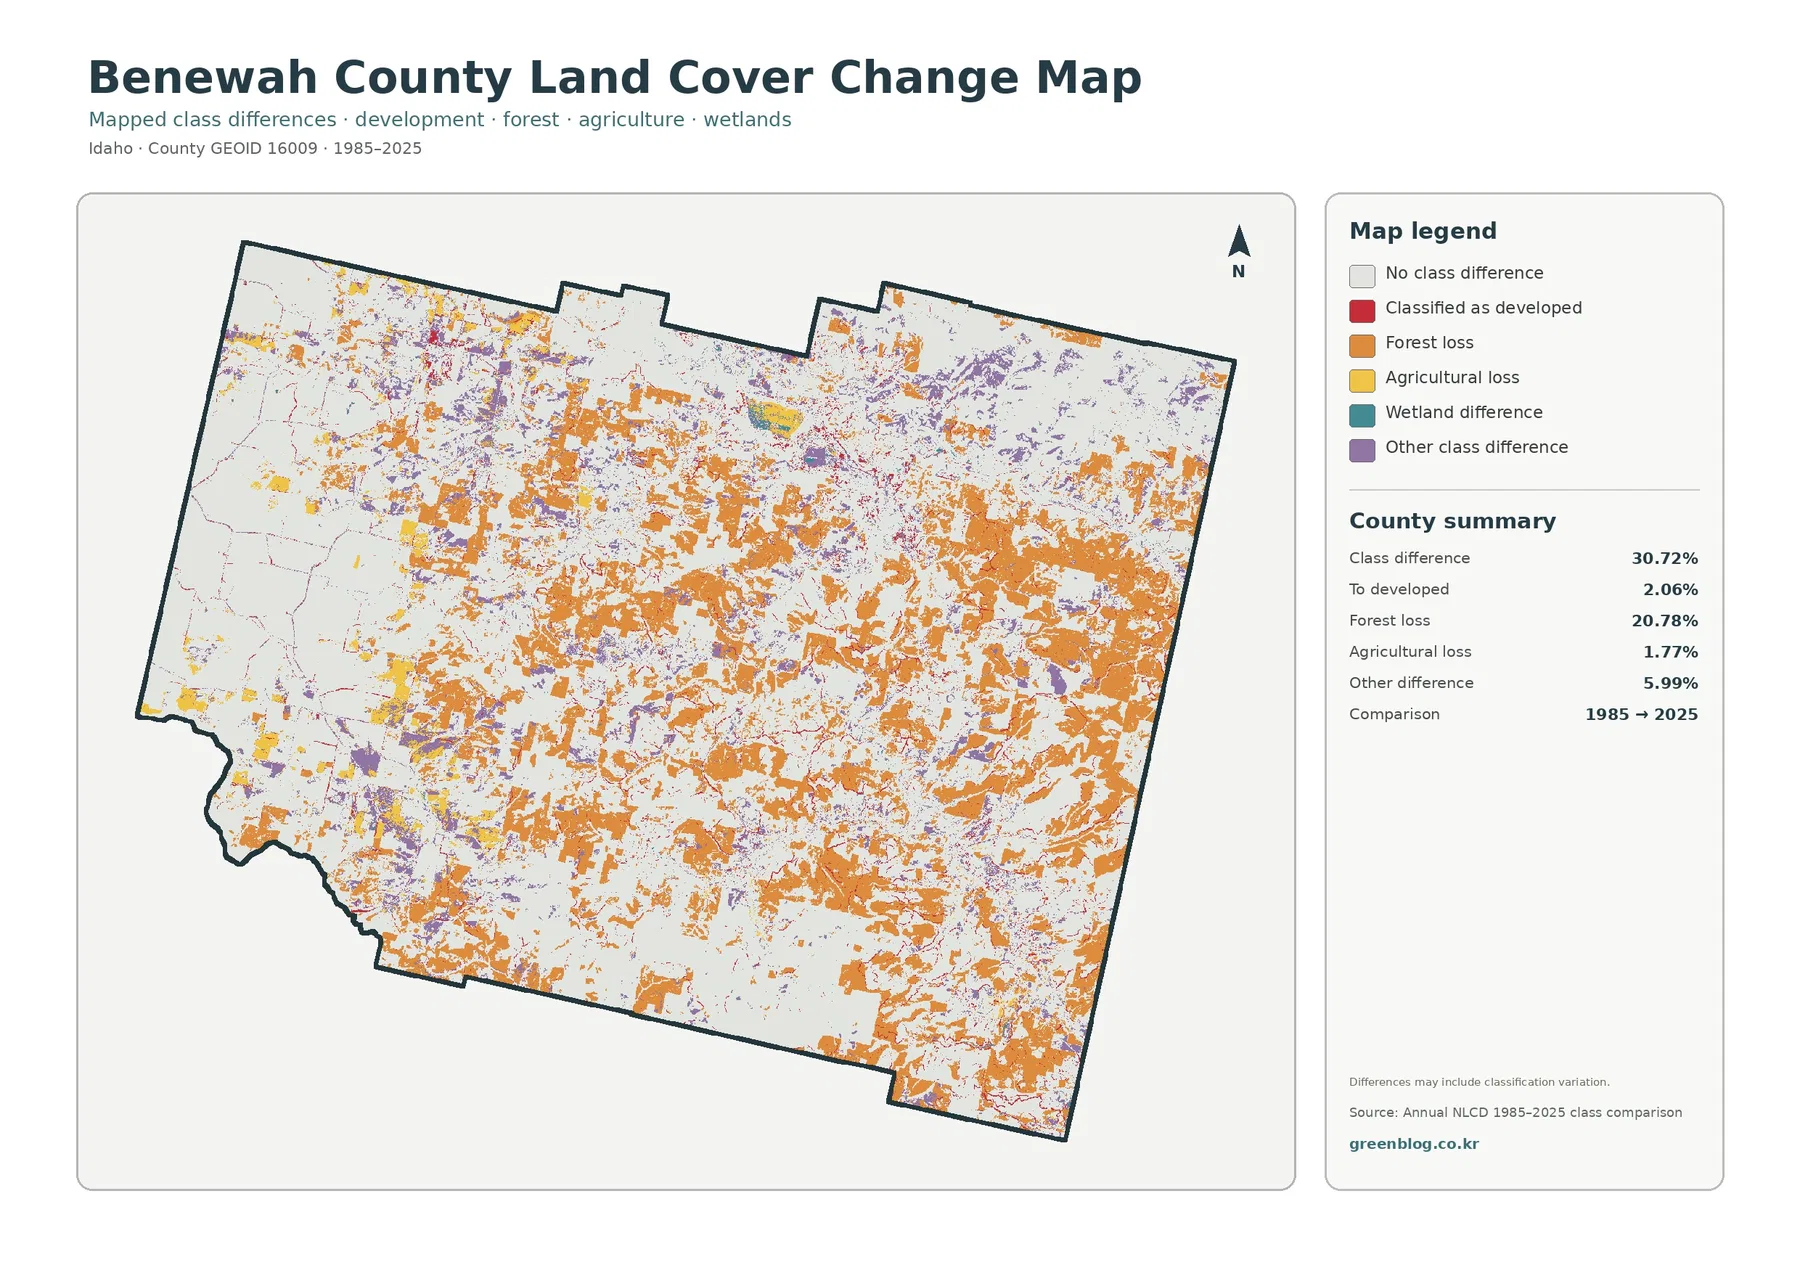
The change layer reports that 30.72% of the county has a different class at the 1985 and 2025 endpoints. Forest loss is the largest listed category at 20.78%. Orange patches are widespread through the interior and eastern parts of the county and also occur in the south. Their distribution is much broader than the compact developed concentrations visible on the impervious map.
A forest-loss color does not prove permanent clearing or identify a cause. It means that a cell classified as forest at one endpoint is classified differently at the other endpoint under the supplied comparison. Timber harvest, regrowth, fire, agricultural activity, development, or classification variation cannot be separated with this two-date graphic alone. Intermediate imagery or additional records are needed before assigning a reason to a particular patch.
Only 2.06% is listed as classified to developed, while agricultural loss is 1.77% and other class difference is 5.99%. Those values make it clear that the 30.72% total should not be described as a development rate. Most of the mapped difference belongs to forest loss and other changes. The red developed-conversion marks can be compared with the current developed pattern, but spatial overlap by itself does not establish when or why a site changed.
Frequently Asked Questions
What is the largest land-cover class in Benewah County?
Forest is the largest 2025 class at 52.43%. Shrubland follows at 20.58%, agriculture at 12.62%, grassland at 6.36%, developed cover at 4.80%, wetlands at 2.24%, and water at 0.91%. The broad western agricultural blocks contrast with the more forested central and eastern county.
Why is developed cover 4.80% while mean impervious cover is only 1.12%?
Developed land can contain both hard and permeable surfaces. Lawns, trees, bare soil, and other ground may occur within developed classes, while the impervious layer isolates rooftops, pavement, and similar hard surfaces. That is why the countywide impervious average can be much lower than the developed-land percentage.
Does 20.78% forest loss mean that all of that area was permanently cleared?
No. The value refers to cells classified as forest at one endpoint and another class at the other endpoint in the 1985–2025 comparison. The two-date map cannot identify whether a particular difference resulted from harvest, regrowth, fire, development, another land-cover transition, or classification variation.
Thirty-meter raster cells limit parcel-level interpretation
Annual NLCD is a raster product built from 30-meter cells. Each cell receives a predominant class even when several surfaces occur inside the same square. A narrow road, small wetland, tree line, building, field edge, and grass strip can therefore be simplified or combined at this scale. Enlarging the JPG makes the symbols easier to see, but it does not create detail that is absent from the source cells.
The current map represents the supplied 2025 observation year. Construction, vegetation recovery, timber activity, agricultural conversion, or water changes after that date may not appear. The 1985–2025 layer is also an endpoint comparison rather than a year-by-year history. A place could change several times between those dates and still finish in a class that looks similar to an earlier condition.
These limits define the appropriate scale of use. The maps can describe the western agricultural concentration, the countywide forest and shrub pattern, the low hard-surface average, and broad endpoint differences. They cannot determine ownership, zoning, wetland jurisdiction, legal access, building permission, or exact field boundaries. Those questions require current local or site-specific records.
How the four original JPG files can be used
Each original JPG measures 2480 × 1754 pixels. The supplied asset manifest does not identify the files as meeting an A3 high-resolution reference, so a proof print should be checked before producing a large poster. Preserve the original aspect ratio when resizing; stretching the image would distort the county boundary and make the internal land-cover shapes less reliable visually.
For a county profile, the 2025 map provides the broadest single summary. A forestry or agriculture discussion can use the vegetation map to emphasize the strong west-to-east difference. A settlement section can use the impervious layer to show the limited hard-surface nodes, while the change layer is suited to a clearly labeled comparison of the 1985 and 2025 classifications. The original files are grouped in one ZIP so the same county can be shown at several levels of detail without mixing unrelated graphics.
Map File Information
The ZIP contains the four original JPG maps used to compare Benewah County's 2025 land cover, western agriculture, forest and shrubland, concentrated hard surfaces, and 1985–2025 class differences.
- Included Files: Use only the versions confirmed in the article and supplied images
- File Type: Use the confirmed download contents
- Intended Use: Printing, education, presentations, and map-based projects
Related Maps
Sources and Reference Data
- MRLC Annual NLCD Data – official access point for the 2025 land-cover and annual comparison products
- USGS Annual NLCD Land Cover Classification – definitions for forest, shrubland, agriculture, developed land, wetlands, and other classes
- U.S. Census Bureau TIGER/Line Shapefiles – official county boundary data reference
Green Map creates custom-edited map images using open geographic data sources such as geoBoundaries, Natural Earth, OpenStreetMap, and government open data.
These maps are edited visual materials, not raw data files, and are provided for education, documents, presentations, and graphic reference.