Forest covers most of Walker County in the supplied 2025 land-cover summary, accounting for 60.25% of the county. Agriculture adds 24.21%, while developed land makes up 12.27% and is concentrated in several distinct clusters rather than spread evenly across the county. This Walker County Georgia Land Cover Map page compares the present cover, hard surfaces, working land, and the mapped differences between 1985 and 2025.
The four original JPG maps are available together in one download. They are useful when a lesson, county profile, presentation, or regional comparison needs more than a single land-cover view. The maps describe surface cover, not parcel ownership, zoning, building rights, or legal land use, so those questions require separate official records.
Table of Contents
A forest-majority county with agriculture and development broken into smaller bands
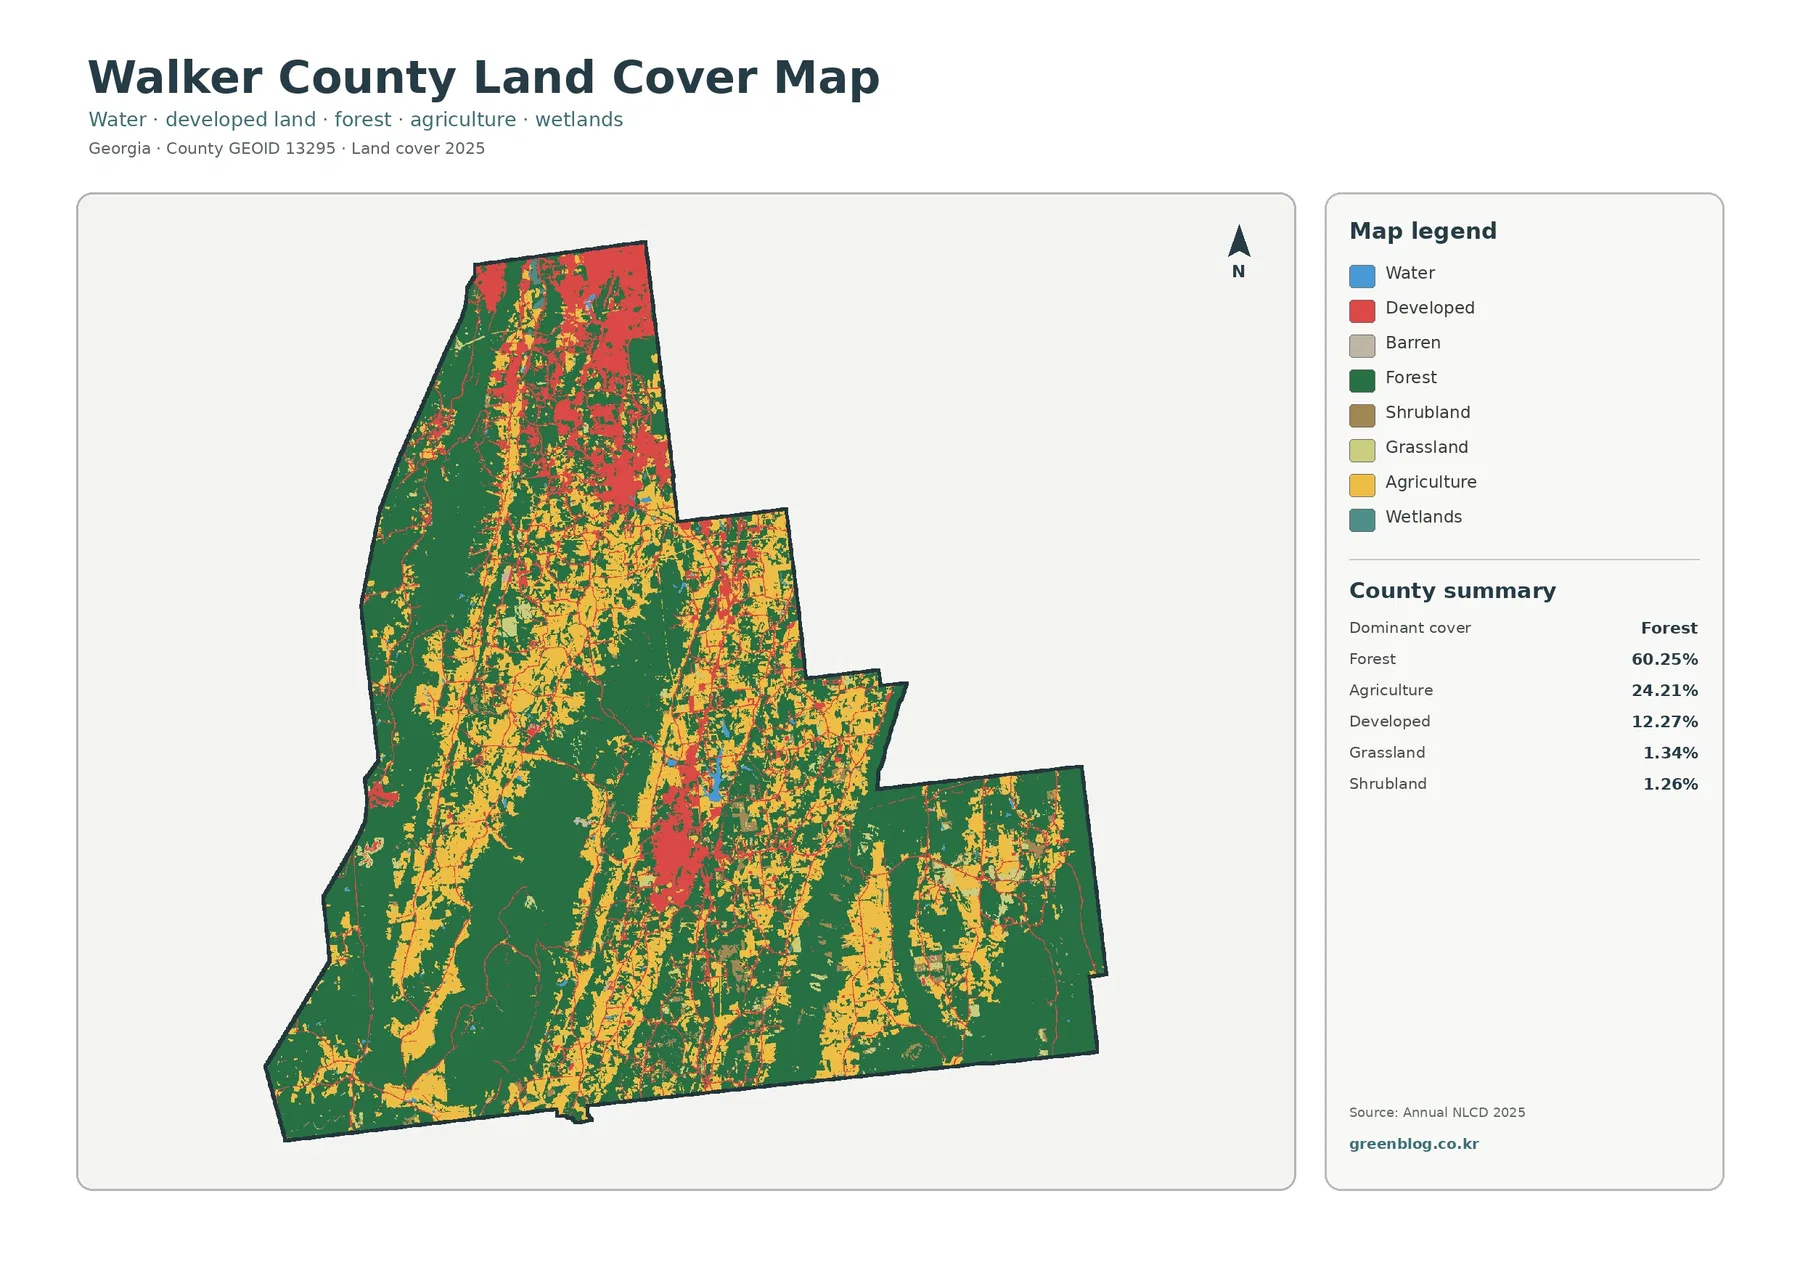
The countywide image is dominated by forest green, especially across broad western and southern areas and through several large central blocks. Agriculture is the second-largest class at 24.21%, but it does not form one continuous farm belt. Yellow agricultural areas appear in long openings, patches, and narrow bands between wooded sections. Developed land is 12.27%. Its red pattern is visually strong because much of it is grouped into compact areas rather than diluted across the entire county.
Smaller classes occupy far less area in the supplied summary: grassland is 1.34%, shrubland 1.26%, open water 0.36%, and wetlands 0.20%. Those low percentages should not be read as a complete inventory of every stream, pond, wet hollow, or narrow riparian strip. Annual NLCD assigns a predominant class to 30-meter cells, so small linear features can be generalized into the surrounding cover at this scale.
Walker County’s official government lists five incorporated cities: LaFayette, Rossville, Chickamauga, Lookout Mountain, and a portion of Fort Oglethorpe. The land-cover image does not label municipal boundaries, so a red patch cannot be assigned to a city from this graphic alone. Still, the presence of several communities helps explain why the developed pattern is divided among more than one center instead of appearing as a single compact urban area.
Hard surfaces reveal where the built footprint is most concentrated
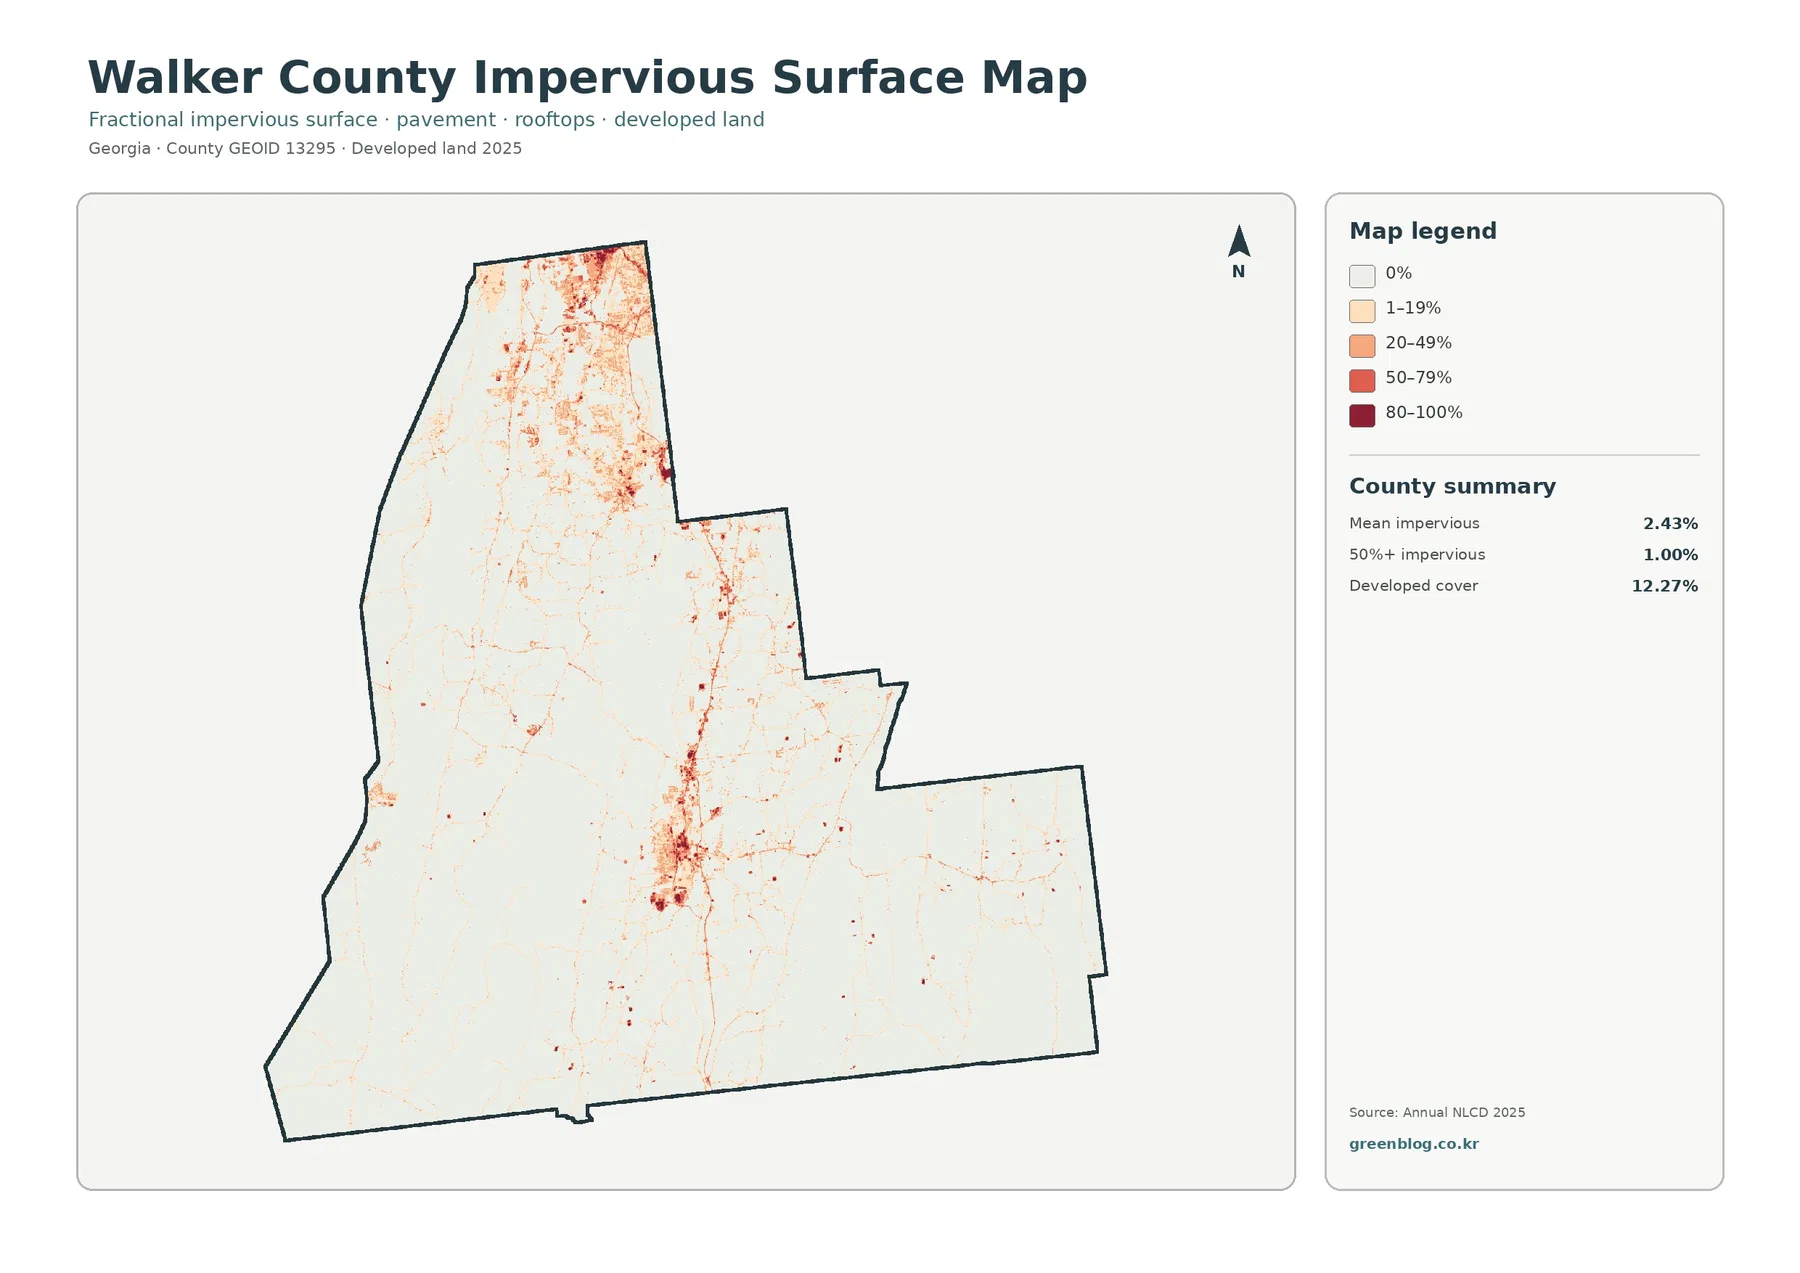
Impervious surface means roofs, pavement, parking areas, and similar materials that do not readily absorb rainfall. Walker County’s mean impervious value is 2.43%, and only 1.00% of the county is in cells with at least 50% impervious cover. Those figures are much lower than the 12.27% developed-land share because a developed land-cover class can include lawns, trees, bare soil, and other permeable surfaces around buildings and roads.
The strongest hard-surface concentration appears in the northern part of the county, with another prominent concentration farther south and a chain of thinner lines and small nodes between them. Walker County’s 2022–2032 comprehensive plan identifies LaFayette as the county seat in the south-central part of the county along U.S. Highway 27. The map itself does not label the highway or city limit, but that official location provides useful context for the central impervious cluster. The northern pattern should likewise be read as a group of built areas rather than as one municipal boundary.
This layer is especially helpful when the question is not simply “where is developed land?” but “where are the hardest surfaces within developed areas?” A residential area with trees and lawns may fall into a developed class while still having modest impervious cover. A commercial block, major roadway, or dense building cluster can have a much stronger impervious signal. That distinction is useful for explaining runoff concepts, comparing settlement intensity, or identifying places that deserve closer study with current local data.
The 1985–2025 comparison spreads across the county instead of following one expansion front
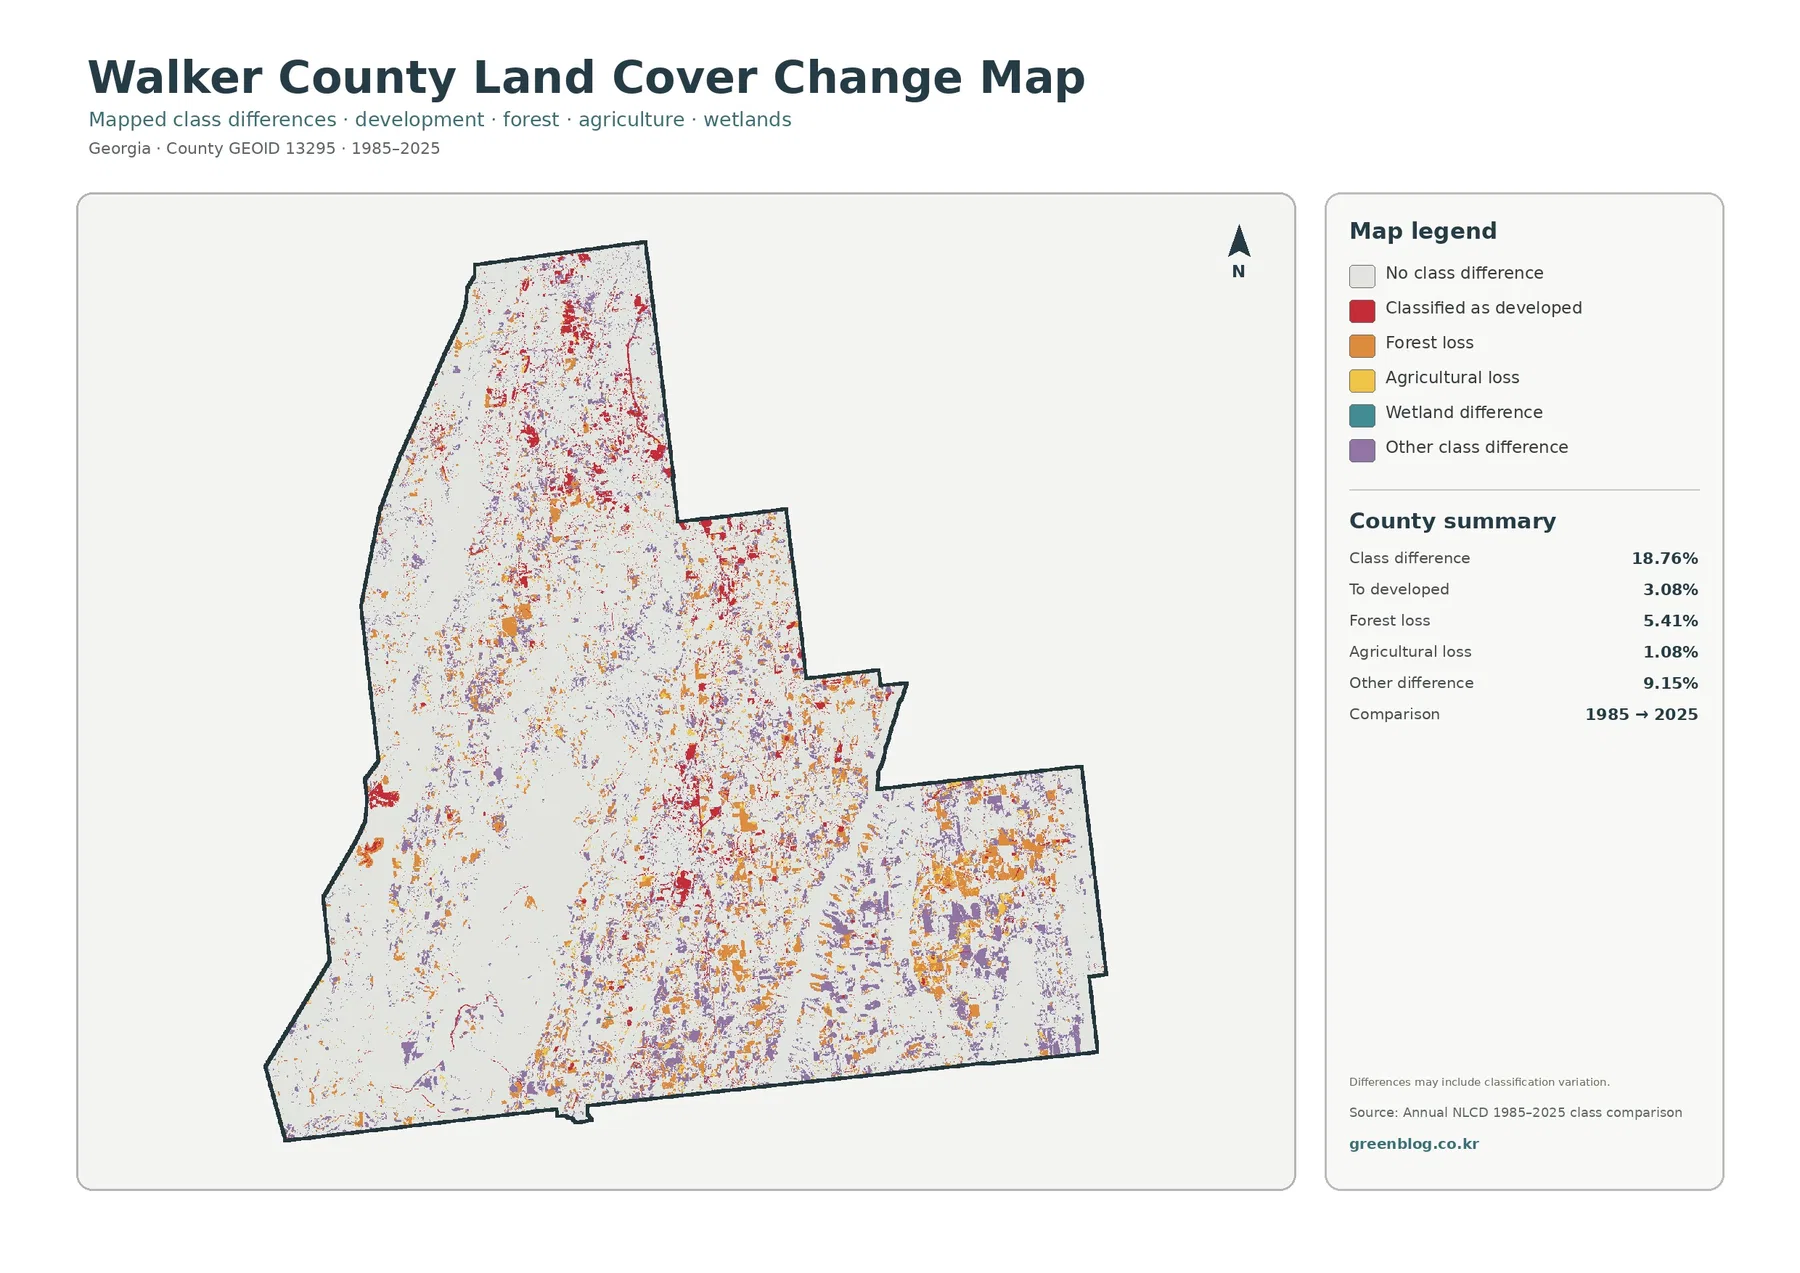
The supplied change summary reports that 18.76% of cells have a different class at the 1985 and 2025 endpoints. Within the listed categories, 3.08% is classified as developed at the 2025 endpoint, 5.41% is mapped as forest loss, 1.08% as agricultural loss, and 9.15% as other class difference. A wetland-difference color is present in the legend, but the summary does not provide a separate verified percentage for it, so no value should be inferred.
Red, orange, and purple change cells occur in many parts of the county. The north has a noticeable concentration, but the map also contains substantial scattered change through the center, east, and southeast. That pattern matters because it does not support a simple story in which all long-term change moved outward from one city. Forest-class differences, developed conversion, agricultural differences, and other classification changes are distributed through multiple landscapes.
The word “change” needs a careful definition here. This is a two-date class comparison, not an annual record of every event between 1985 and 2025. A cell could have changed several times and returned to its original class by 2025, or a difference could partly reflect classification variation. To determine when a forest patch was cleared, when development occurred, or why an agricultural cell changed class, intermediate imagery and local records are needed.
Forest and working land form a patchwork around the built areas
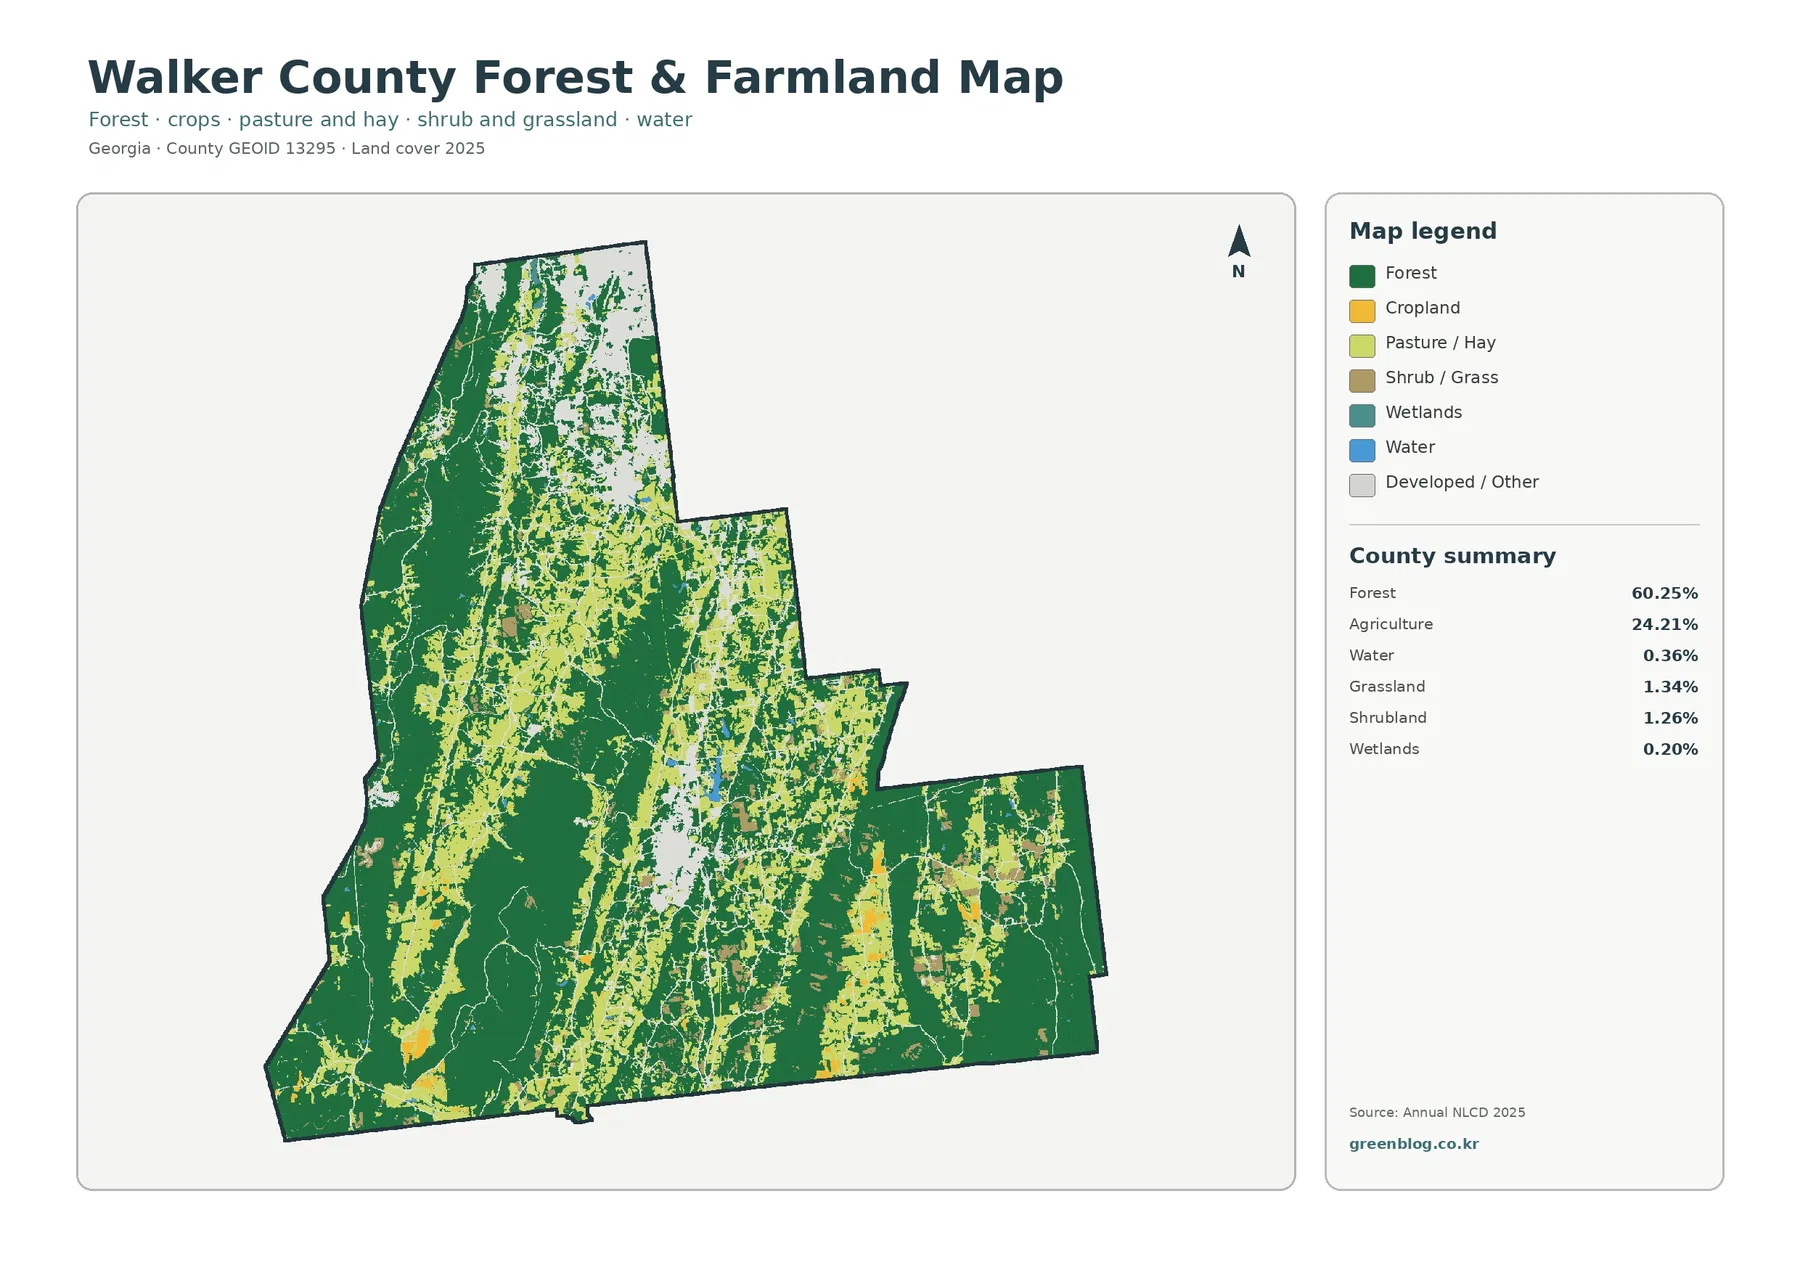
Removing the stronger developed colors from the general view makes the relationship between forest and working land easier to see. Broad forest blocks remain prominent in the west and south, while agricultural and pasture-related classes form a much more broken pattern through central and eastern parts of the county. Some open areas are long and narrow, while others form wider patches surrounded by woods. The result is not a clean divide between a forest half and a farm half; the two types repeatedly meet across the county.
The 24.21% agricultural share therefore deserves nearly as much attention as the forest majority. It represents a substantial part of the county surface even though forest is more than twice as large. For classroom or regional comparisons, this view can help explain how a county can be strongly forested while still containing extensive working land and pasture. It also prevents a common mistake: treating every pale or open-looking area on the general map as development.
Local planning material adds useful context without replacing the map. Walker County’s joint comprehensive plan names Crockford-Pigeon Mountain Wildlife Management Areas and Johns Mountain Wildlife Management Area among its examples of greenspace and conservation lands. Those references should not be used to trace protected boundaries from the land-cover image, but they help explain why conservation and large wooded areas are an important part of the county’s landscape discussion.
Mountains, parks, and incorporated communities provide useful context for the color pattern
Walker County lies in northwestern Georgia, and county information notes that parts of Chattahoochee National Forest and Chickamauga and Chattanooga National Military Park are within the county. The National Park Service also identifies Walker County as one of the Georgia counties included in the military park. That context is relevant to a land-cover discussion because large protected or public landscapes can remain heavily vegetated, but the NLCD colors do not show ownership or management status.
Lookout Mountain and the Pigeon Mountain area are useful geographic reference points for understanding why the county is not a uniform plain. Even so, these four images are not elevation maps. A forest-colored cell should not automatically be labeled as mountain terrain, and an agricultural cell should not automatically be called a valley floor. Anyone studying the relationship between elevation and cover should add a separate topographic or elevation layer rather than infer height from land-cover color.
Choose one map for the main question, then use a second for comparison
A county profile can start with the general 2025 image because it gives the fastest overview of forest, agriculture, development, water, and the smaller classes. If the topic turns to farming or vegetation, the forest-and-farmland version removes some visual competition and makes the open-land pattern easier to follow. For a discussion of settlement intensity, the impervious layer is more informative than the developed class alone because it separates dense hard surfaces from greener developed areas.
The change layer works best after the current condition has been established. Showing it first can lead viewers to mistake red or orange change colors for current developed or agricultural classes. In a presentation, place the current map first, point out the northern and central built concentrations and the broad forest areas, then switch to the change map to ask where endpoint classifications differ. This sequence keeps “what is there now?” separate from “what was classified differently in 1985?”
For printed handouts, one full-size map per page is usually easier to read than shrinking all four into a small grid. The legends contain several categories, and the narrow agricultural and impervious lines lose meaning when the image is reduced too far. A paired comparison can still work well when two maps are large enough for the same landmarks and county outline to be matched visually.
Scale and classification limits matter when the maps are enlarged
Annual NLCD is based on 30-meter raster cells. Each cell receives one predominant class even when a small area contains trees, grass, a driveway, a building, and a drainage feature together. That generalization is appropriate for county-scale patterns but not for parcel boundaries or site inspections. Enlarging the JPG makes the existing pixels easier to see; it does not create finer source detail.
The current maps represent the supplied 2025 observation year. Construction, timber activity, agricultural changes, storm effects, vegetation recovery, or other surface changes after that observation may not appear. The downloadable JPGs measure 2480 × 1754 pixels each. They work well for screens, reports, and many presentation layouts, but the package does not identify them as meeting an A3 high-resolution standard, so a proof print is sensible before making a large poster.
These limits define the proper use of the collection rather than making it less useful. The maps are strong for county comparisons, environmental education, preliminary landscape review, and presentation graphics. Survey lines, zoning, permits, wetland jurisdiction, flood insurance, property decisions, and current engineering questions require authoritative records designed for those purposes.
Frequently Asked Questions
What is the largest land-cover class in Walker County?
Forest is the largest 2025 class at 60.25%. Agriculture follows at 24.21%, and developed land accounts for 12.27%. The county is therefore strongly forested overall, but working land and several built clusters remain important parts of the mapped landscape.
Why is developed cover 12.27% when mean impervious cover is only 2.43%?
Developed classes can include lawns, trees, soil, and other surfaces that still absorb water around buildings and roads. Impervious cover isolates rooftops, pavement, and similar hard surfaces, so the countywide impervious average can be much smaller than the total developed-land share.
Does the 18.76% class difference mean that 18.76% of Walker County was developed?
No. The 18.76% value covers all cells classified differently at the 1985 and 2025 endpoints. Only 3.08% is listed as classified to developed, while forest loss is 5.41%, agricultural loss 1.08%, and other difference 9.15%. Timing and cause require intermediate imagery and additional records.
Sources and Reference Data
- MRLC Annual NLCD Data – official access point for annual land-cover and comparison products
- USGS Annual NLCD Land Cover Classification – class definitions for forest, developed land, agriculture, wetlands, and other mapped surfaces
- Walker County Cities – official county information on LaFayette, Rossville, Chickamauga, Lookout Mountain, and Fort Oglethorpe
- Walker County Joint Comprehensive Plan 2022–2032 – county planning context for development, conservation, and greenspace
- Chickamauga & Chattanooga National Military Park – National Park Service information for the multi-county park that includes Walker County
- Walker County Community Health Assessment – official county background on local geography, Chattahoochee National Forest, and the national military park
Map File Information
The ZIP contains the four original Walker County JPG maps used here for current land cover, forest and working land, impervious surfaces, and the 1985–2025 class comparison.
- Included Files: Use only the versions confirmed in the article and supplied images
- File Type: Use the confirmed download contents
- Intended Use: Printing, education, presentations, and map-based projects
Related Maps
- Appling County Georgia Land Cover Map
- Atkinson County Georgia Land Cover Map
- Bacon County Georgia Land Cover Map
Green Map creates custom-edited map images using open geographic data sources such as geoBoundaries, Natural Earth, OpenStreetMap, and government open data.
These maps are edited visual materials, not raw data files, and are provided for education, documents, presentations, and graphic reference.