Pickens County is overwhelmingly forested, but the Jasper area creates a clear built corridor through the middle of the map. Forest covers 72.53% of the supplied 2025 classification, developed land 13.57%, and agriculture 10.17%. The central settlement cluster and its north-south road pattern contrast sharply with the broad forest cover toward the east and north. This Pickens County Georgia Land Cover Map shows that mountain-foothill setting more clearly than a political boundary alone.
The page includes four WebP views for land cover, vegetation, impervious surface, and the 1985–2025 endpoint comparison. Four original 2480 × 1754 JPG maps are available in one ZIP for county profiles, forest-development comparisons, lessons, and presentations.
Table of Contents
The Jasper ridge and SR 515 corridor form the county’s main built spine
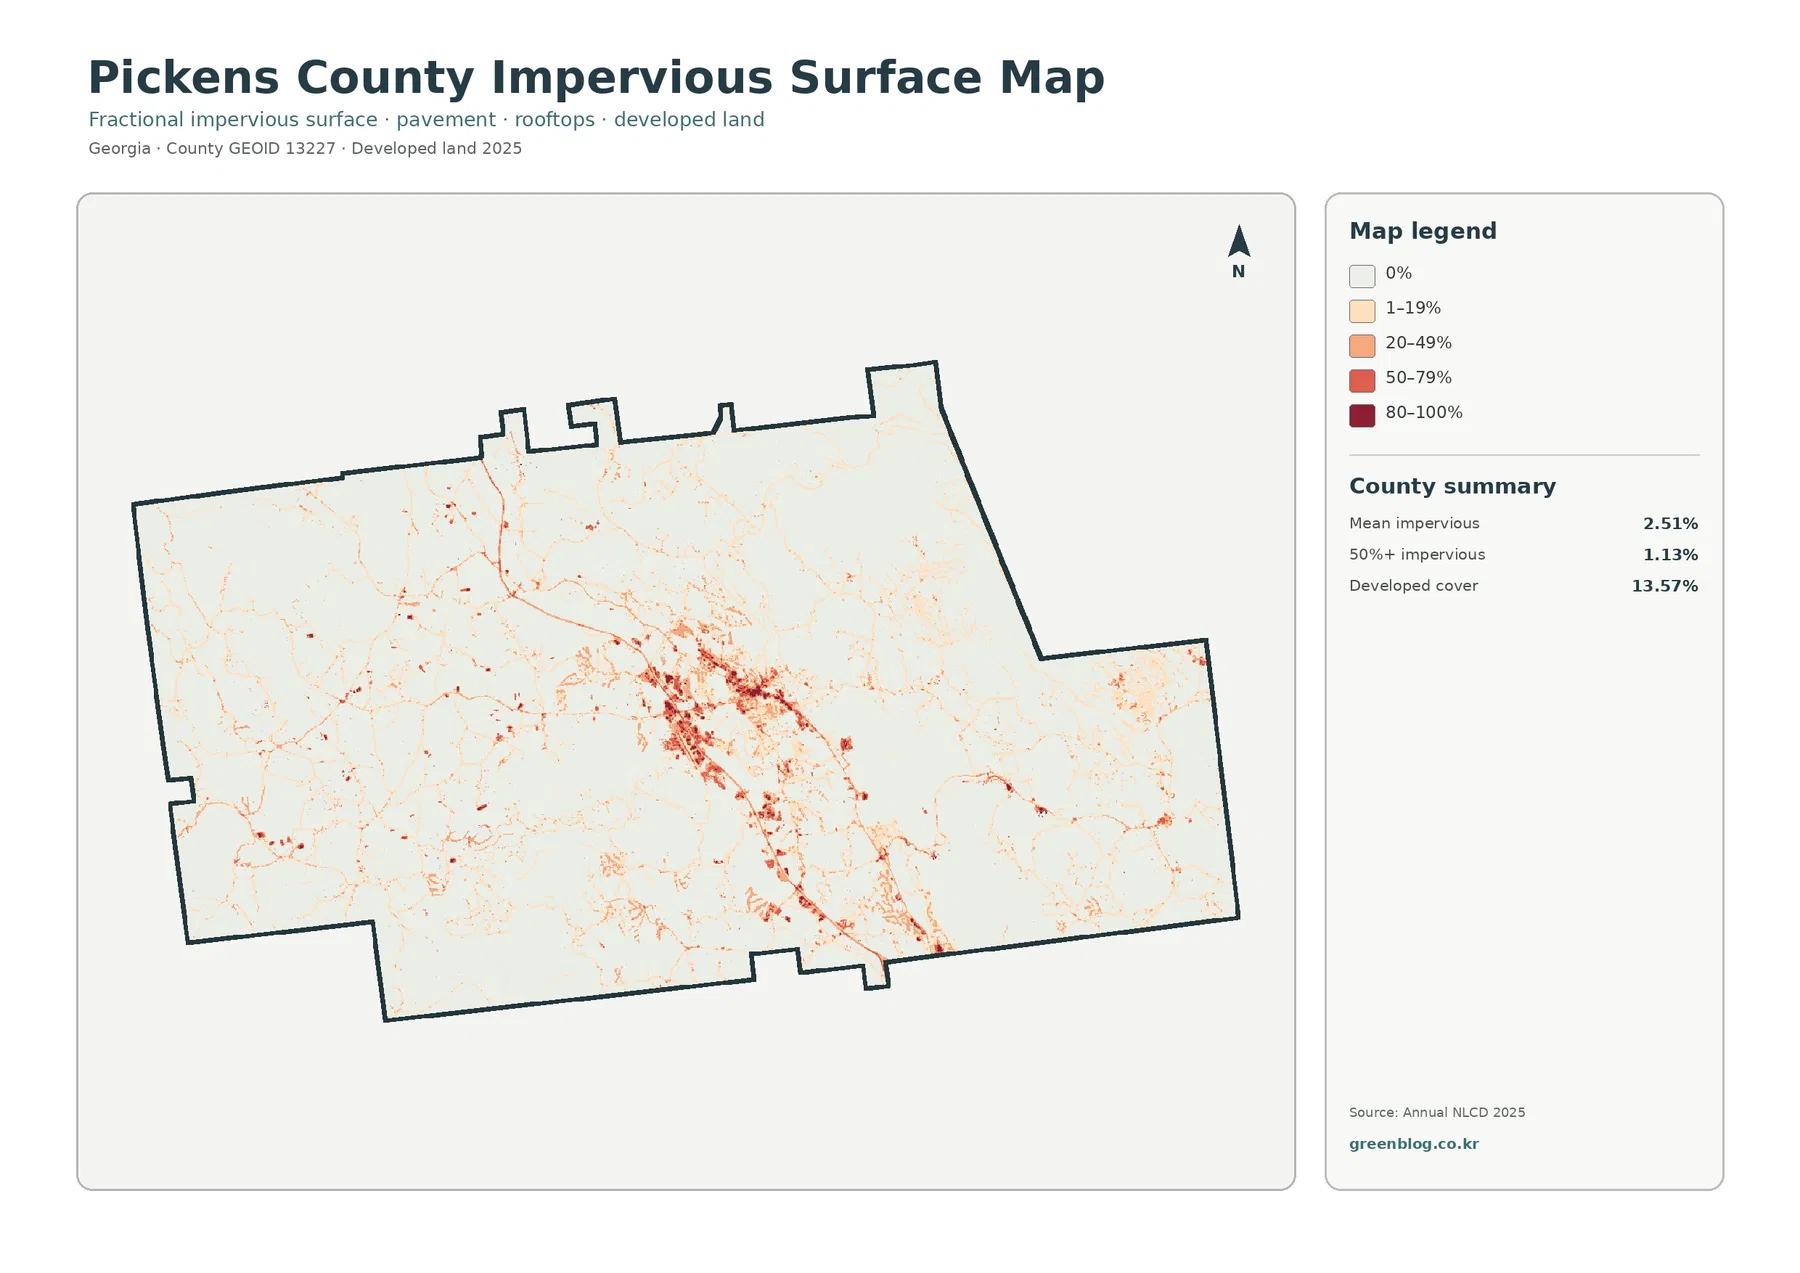
The darkest hard-surface cluster sits near the center of the county. Pickens County’s 2023 joint comprehensive plan places Jasper on a ridge slightly east of the county’s geographic center and links much of its more recent growth to State Route 515. That official geography fits the map well: the main built concentration is central, with a strong north-south trace continuing beyond it.
Jasper’s city website identifies it as the Pickens County seat and shows the concentration of local government, planning, business, and public services there. The raster footprint extends beyond a compact downtown because developed classes also include residential and lower-density built surfaces. Its outer edge is not the legal Jasper city limit.
Road-shaped impervious lines can be compared with SR 515 and other official transportation layers, but route names are not encoded in the map. Census TIGER/Line or local GIS should be used when an exact road centerline matters.
A 72.53% forest share reflects the Appalachian foothill landscape
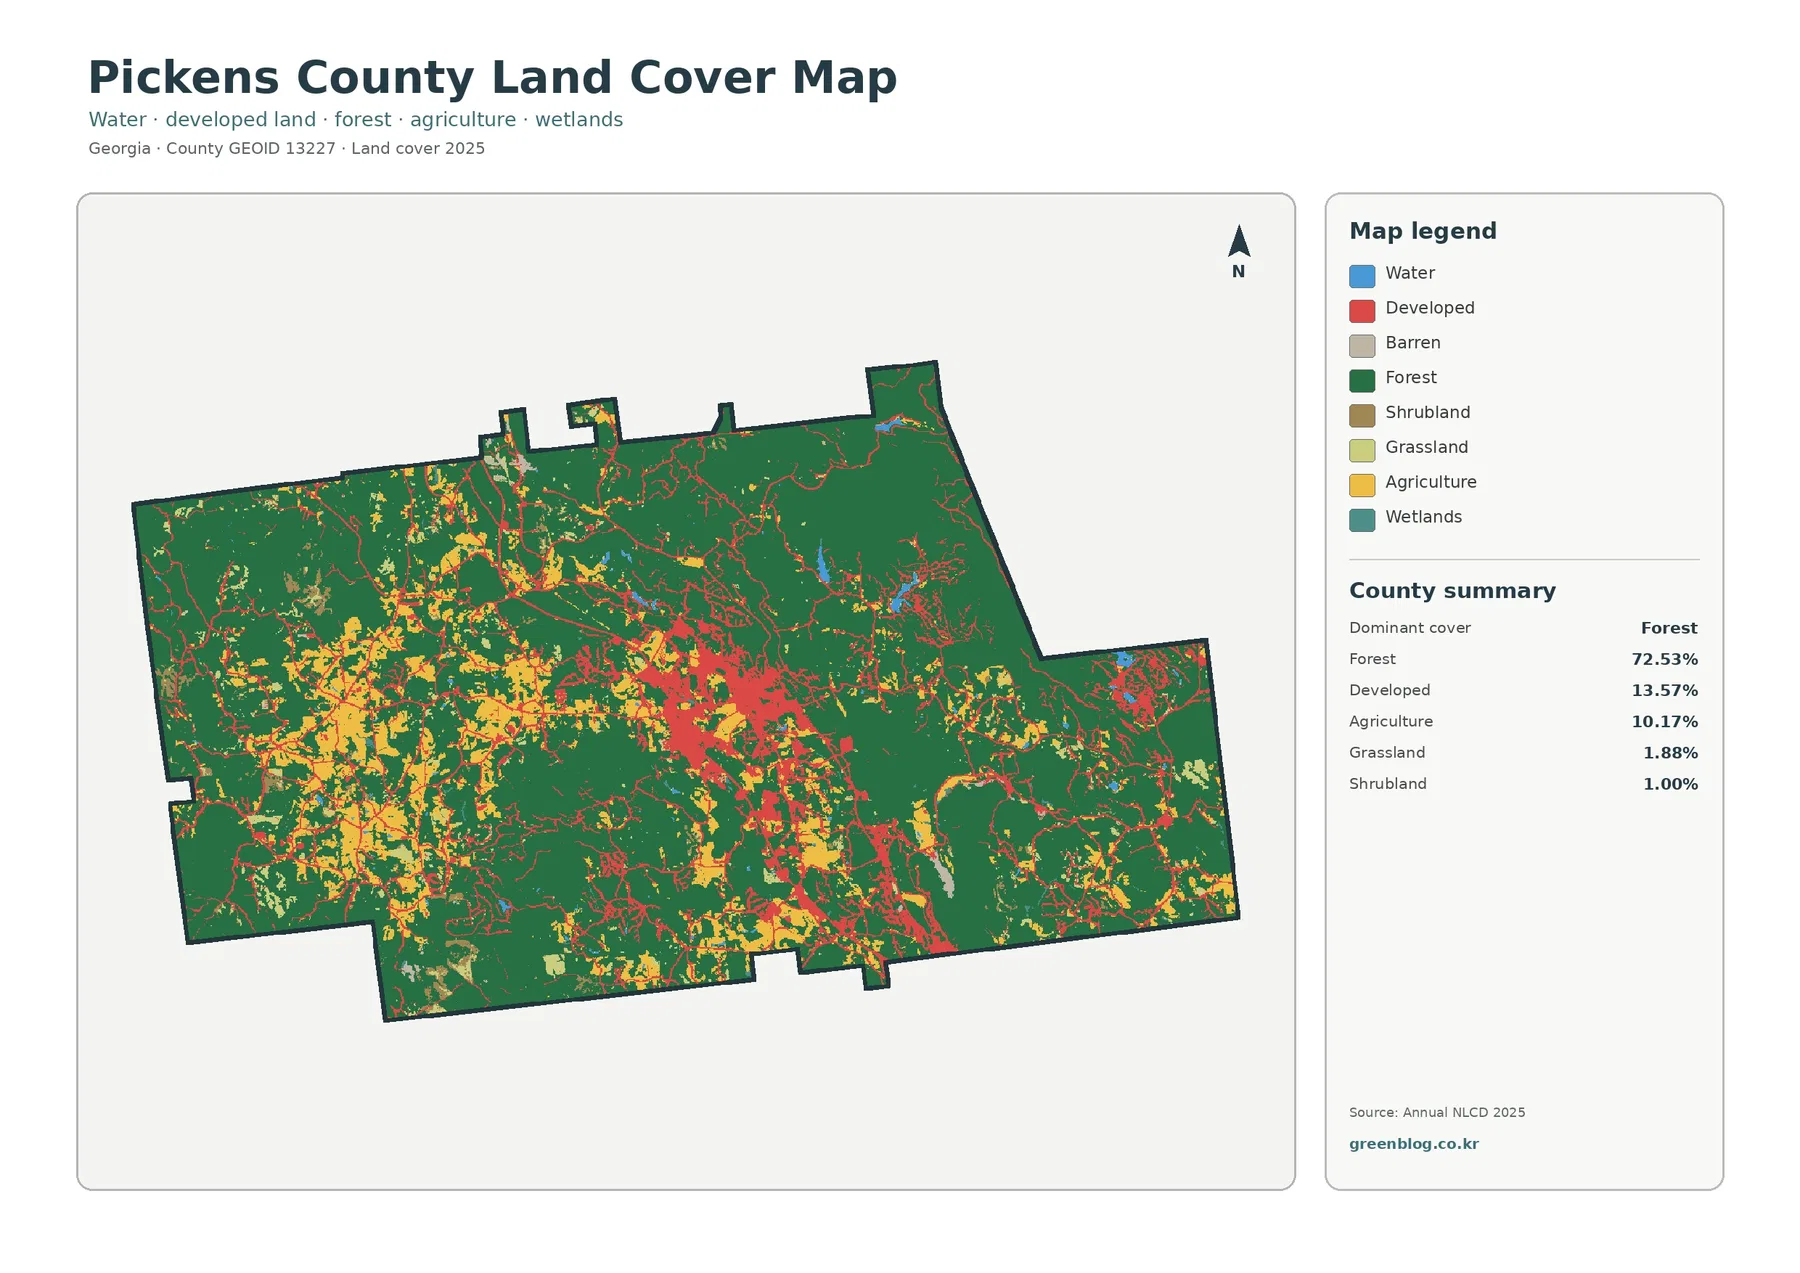
Forest is the dominant surface almost everywhere outside the main settlement areas. Dark green forms especially broad blocks across the northeast and east, continues through the north, and remains extensive in the southwest. Even the central developed corridor is broken by wooded ridges and patches.
The joint comprehensive plan describes Pickens County as being in the Appalachian foothills and highlights Mount Oglethorpe, Sharp Top Mountain, and Sharp Mountain as notable high points. That setting provides useful local context for the extensive forest cover. The raster does not label individual peaks or protected areas, so the green cells should be read as wooded surface rather than as mountain or conservation boundaries.
Developed land covers 13.57%, agriculture 10.17%, grassland 1.88%, and shrubland 1.00%. Agriculture appears more often west and northwest of the main center and in several central-southern openings. The eastern forest contains fewer large farm blocks, making the county’s internal contrast easy to see.
The vegetation map exposes the open rural areas west of Jasper
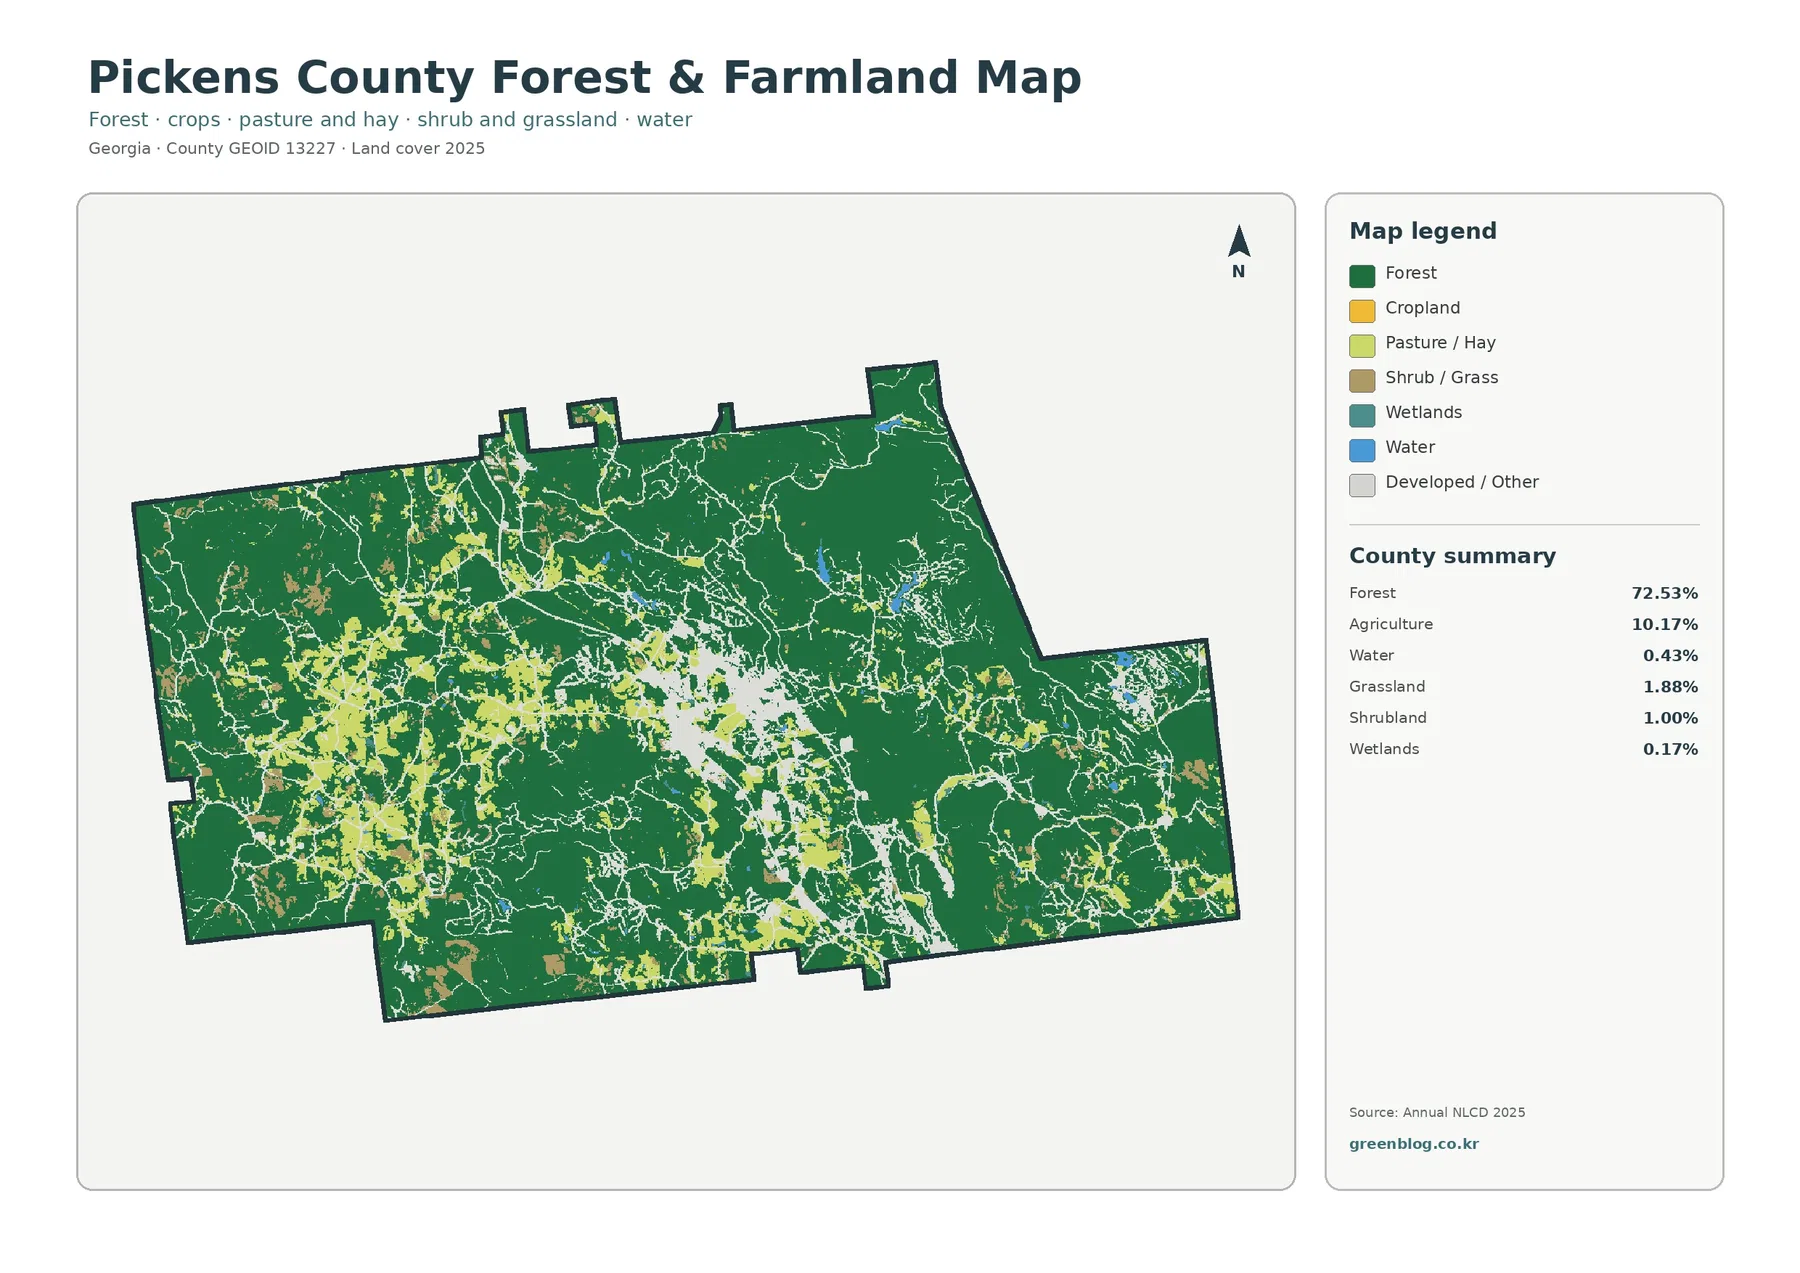
With developed cover muted, the western and west-central openings stand out more clearly. Agriculture and grassland occur in branching and blocky patches between wooded areas, while the east stays almost continuously green. Jasper appears as a light break in the middle of a landscape that otherwise remains strongly forested.
UGA Extension Pickens County lists agriculture programming, conservation and natural-resource management, and water quality among its local initiatives. That mix fits a county where wooded land is dominant but farms, pastures, home landscapes, and water-resource concerns remain part of daily land management.
Open water is only 0.43% and wetlands 0.17%. Small blue and teal features appear along narrow valleys and drainage areas, but neither class occupies enough land to define the countywide pattern. Narrow streams can also be generalized by a 30-meter grid.
A 2.51% impervious mean keeps the hard-surface footprint tightly concentrated
Mean impervious cover is 2.51%, and 1.13% of Pickens County reaches 50% impervious surface or higher. Developed land covers 13.57%, a broader category that can include lawns, trees, yards, and exposed ground around roads and buildings. The impervious layer isolates roofs, pavement, parking areas, and other hard surfaces.
The central Jasper cluster contains the strongest 50–79% and 80–100% cells. Smaller hard-surface concentrations occur farther north, south, and east, but most mountain and forest areas remain white or pale. The difference makes the county’s settlement intensity easier to understand than the general developed class alone.
Impervious cover can support runoff discussions, but it is not a flood-risk map. Site-specific questions need separate terrain, stream, rainfall, soil, and drainage data.
The 1985–2025 endpoint comparison spreads beyond Jasper’s growth area
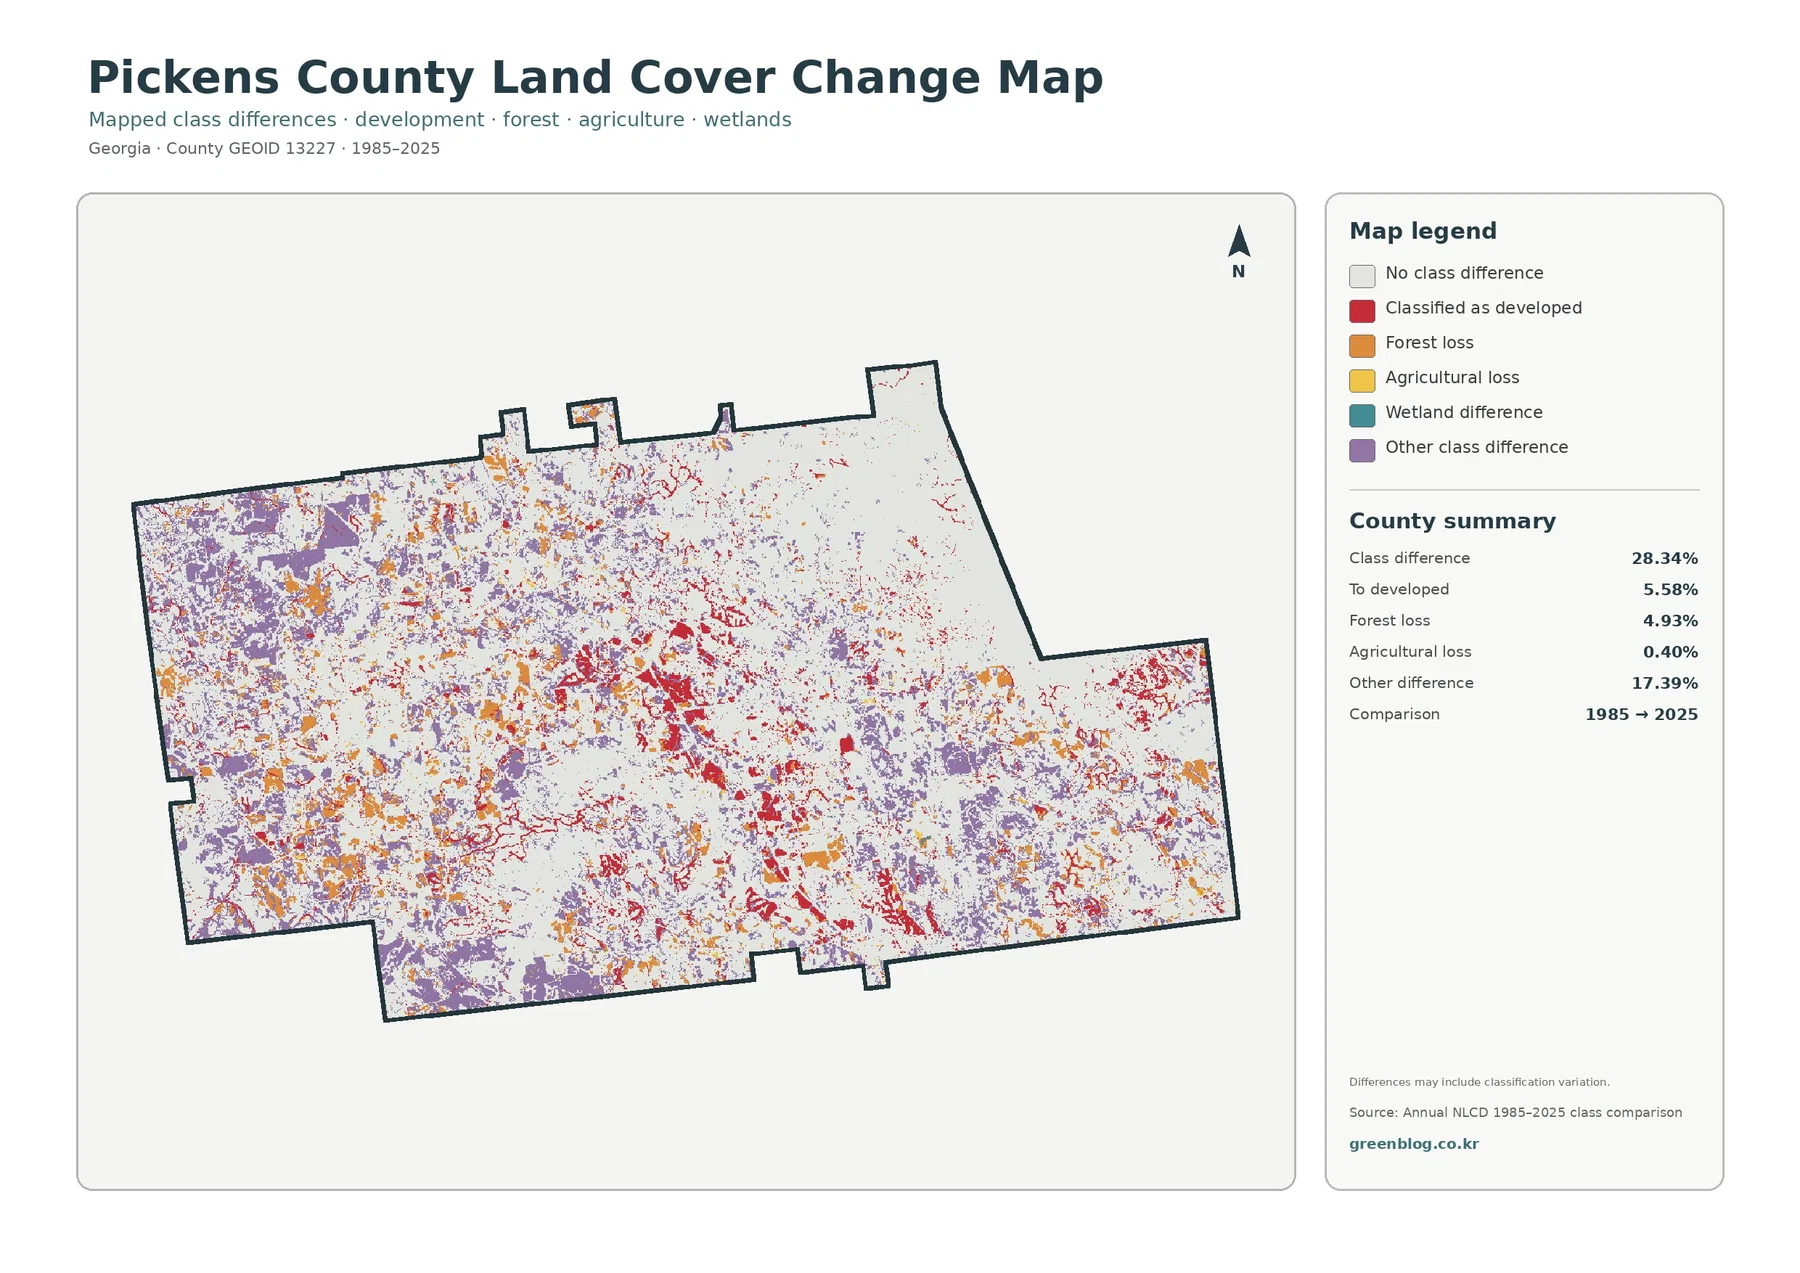
The total endpoint class difference is 28.34%. That figure counts raster cells assigned different classes in 1985 and 2025. It is not an urbanization rate and does not mean that 28.34% of Pickens County was damaged or permanently converted.
The printed summary lists 17.39% other difference, 5.58% classified to developed, 4.93% forest loss, and 0.40% agricultural loss. Developed-change red is strongest around the central settlement corridor and several southern or eastern built areas. Other-difference purple and forest-loss orange extend much more widely through the west, south, and east.
Wetland difference appears in the legend without a separately printed percentage. The missing value should not be reconstructed by subtraction. Classification variation may also contribute to some patches, so intermediate imagery and local land records are needed before assigning a cause.
Jasper is the main center, but smaller communities sit within the forested county
The joint plan covers Jasper, Nelson, and Talking Rock and also identifies unincorporated communities such as Tate, Marble Hill, and Hinton. Small developed pockets away from Jasper fit that dispersed settlement context. They are separated by extensive forest and rural land rather than forming one continuous suburban footprint.
Land cover is not forest ownership, zoning, or a parcel survey
Annual NLCD assigns one predominant class to each 30-meter cell, so narrow valleys, ponds, forest edges, mixed yards, and scattered buildings can look simplified.
Green does not identify public forest or protected land, yellow does not define a farm parcel, and red does not show a city or zoning district. Property, permitting, ownership, and legal land-use questions require current local, state, or federal records.
Using the four JPGs for a mountain-forest county
Start with the 2025 countywide map when the goal is to show the 72.53% forest majority and Jasper’s central development. The vegetation view is better for the western agricultural and grass openings. Choose the impervious map for Jasper and the SR 515 corridor, and reserve the endpoint map for a separate discussion of 1985–2025 classification differences.
Each JPG measures 2480 × 1754 pixels and suits reports, lessons, and presentations. Test a proof before large-format printing because the package does not mark them as A3 high-resolution assets.
Frequently Asked Questions
What is the dominant land-cover class in Pickens County?
Forest is the largest class in the supplied 2025 summary at 72.53%. Developed land follows at 13.57% and agriculture at 10.17%, leaving most of the county strongly forested outside Jasper and other settlement areas.
Why does Jasper look developed while the countywide impervious mean is only 2.51%?
Hard surfaces are concentrated around Jasper and road corridors, while broad mountain and forest areas have very little pavement. Developed classes also include permeable yards and vegetation, so they cover more area than the impervious layer.
Does the 28.34% endpoint difference measure forest clearing?
No. It counts all cells with different class labels in 1985 and 2025. The summary separately lists 5.58% classified to developed, 4.93% forest loss, 0.40% agricultural loss, and 17.39% other difference.
Sources and Reference Data
- MRLC Annual NLCD Data – official access to annual land-cover and comparison products
- USGS Annual NLCD Land Cover Classification – definitions for forest, developed land, agriculture, and related classes
- U.S. Census Bureau TIGER/Line Shapefiles – authoritative county, place, and transportation layers for comparison
- Georgia DCA – Pickens County Joint Comprehensive Plan – official planning context for Jasper, Nelson, Talking Rock, the Appalachian foothills, and county growth
- City of Jasper – official city information for the Pickens County seat and its planning and public-service center
- UGA Extension – Pickens County – local agriculture, natural-resource management, and water-quality programs
Map File Information
The ZIP contains four original JPG maps for comparing Pickens County's 72.53% forest cover, Jasper and SR 515 development, western rural openings, impervious surfaces, and 1985–2025 class differences.
- Included Files: Use only the versions confirmed in the article and supplied images
- File Type: Use the confirmed download contents
- Intended Use: Printing, education, presentations, and map-based projects
Related Maps
- Appling County Georgia Land Cover Map
- Atkinson County Georgia Land Cover Map
- Bacon County Georgia Land Cover Map
Green Map creates custom-edited map images using open geographic data sources such as geoBoundaries, Natural Earth, OpenStreetMap, and government open data.
These maps are edited visual materials, not raw data files, and are provided for education, documents, presentations, and graphic reference.