Oconee County combines a fast-growing northern and central area with a substantial farm-and-forest landscape farther south. Forest covers 46.62% of the supplied 2025 classification, agriculture 27.99%, and developed land 17.80%. Development is most concentrated near the northern side and around the Watkinsville area, while the southern half contains larger fields and wooded blocks. This Oconee County Georgia Land Cover Map makes that contrast easy to compare.
The page includes four WebP views for land cover, vegetation, fractional impervious surface, and the 1985–2025 endpoint comparison. The four 2480 × 1754 JPG maps are available together in one ZIP for county profiles, planning context, lessons, and presentations.
Table of Contents
Forest remains the largest class even where development is expanding
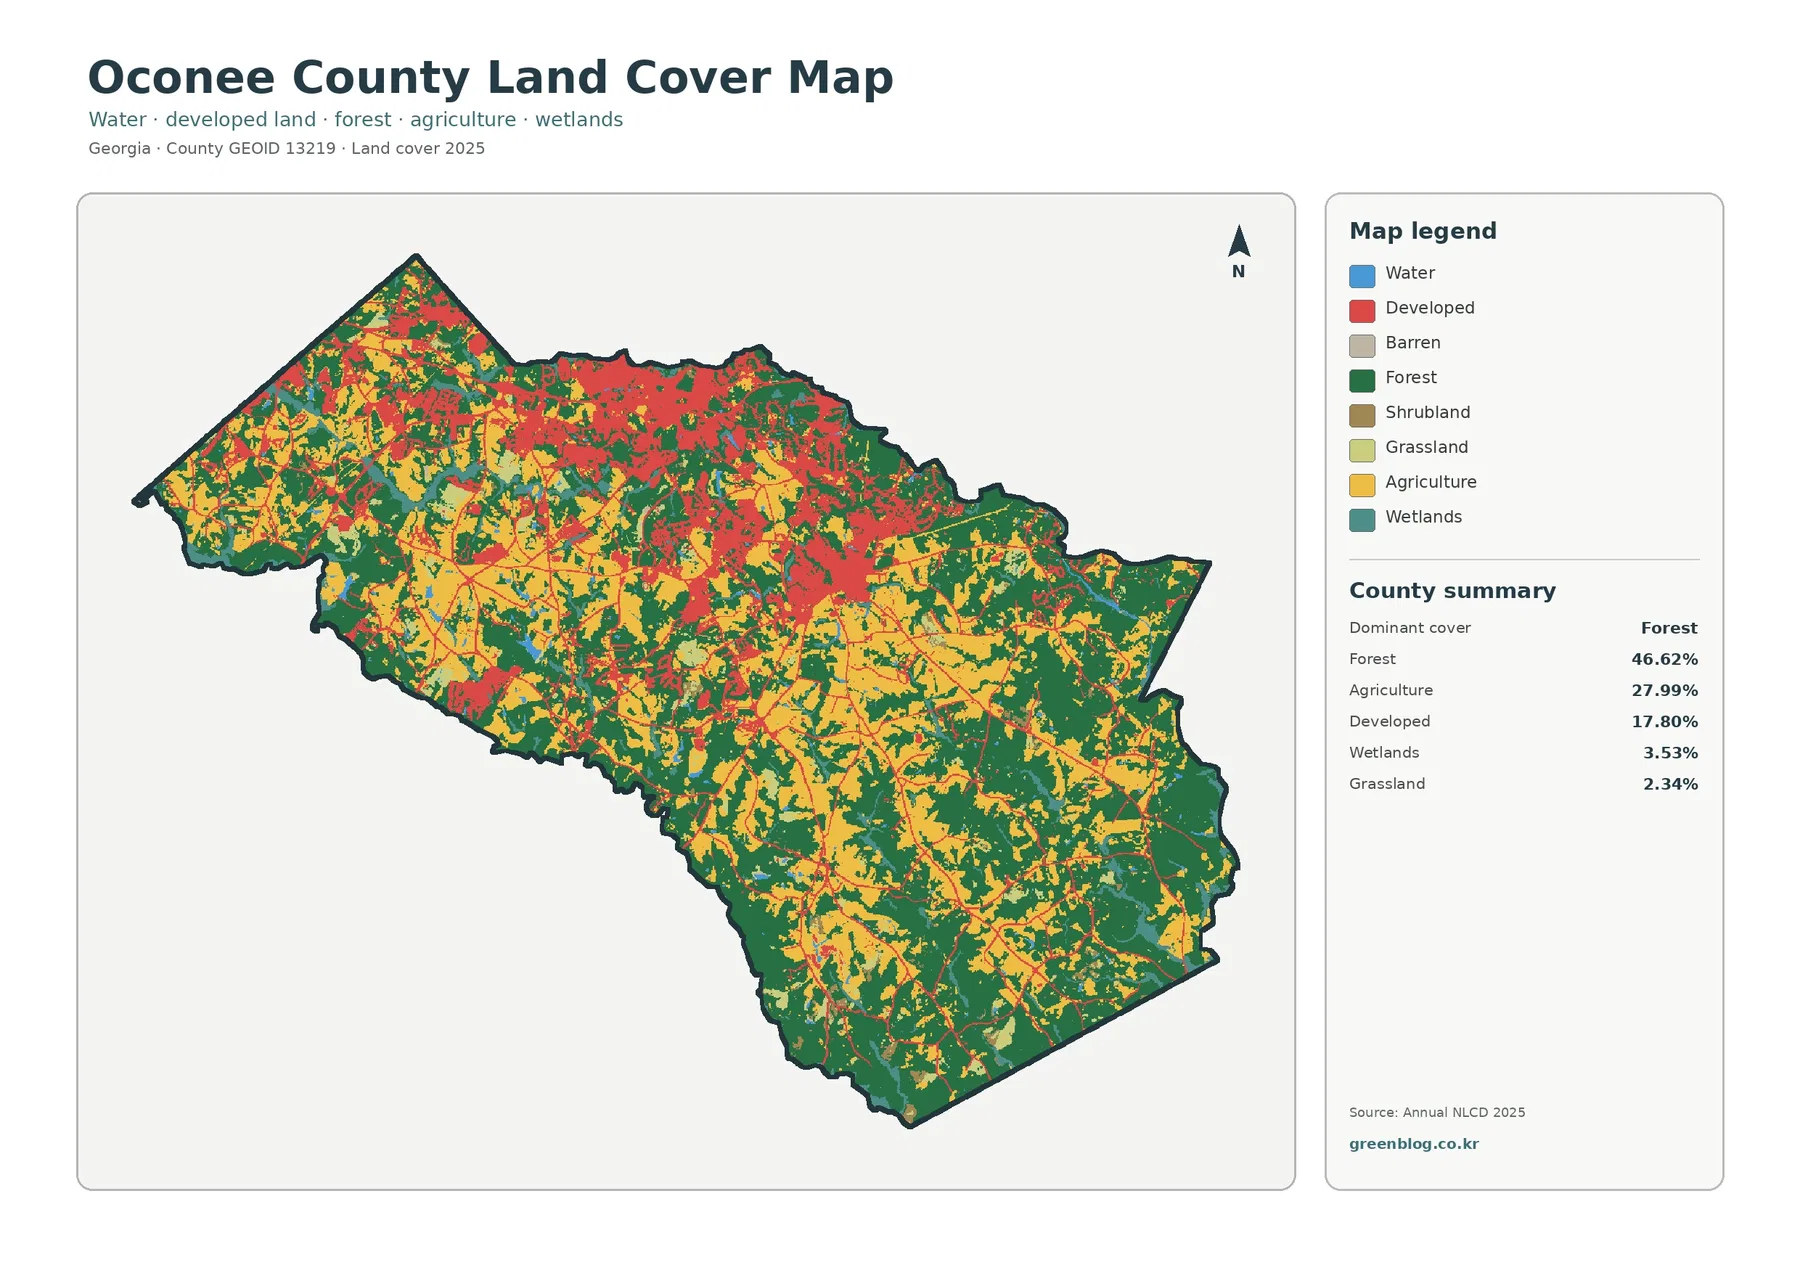
Forest covers 46.62% and appears in every major part of the county. Large green blocks are especially visible through the south, southeast, and several central areas, while the north contains more broken woodland between neighborhoods, roads, and fields. The county is therefore still forest-led statistically even though the developed footprint is easy to see.
Agriculture accounts for 27.99%. Broad yellow blocks are common in the west, south, and east-central portions, often meeting forest directly. The southern half contains some of the clearest farm-and-wood combinations, while northern agricultural pieces are more fragmented by development.
Developed land covers 17.80%, wetlands 3.53%, and grassland 2.34%. The vegetation summary adds shrubland at 0.74% and open water at 0.94%. Wetlands appear as narrow bands and small patches along lower ground, while open water is much less extensive and should not be combined with the wetland class.
Watkinsville and the northern edge provide the clearest development context
Official county planning material identifies Watkinsville as the county seat and lists Bogart, Bishop, and North High Shoals as the other incorporated municipalities. Oconee County also sits just south of Athens. Those facts help explain why the northern and central portions contain several separate built clusters rather than one isolated town footprint.
The 2023 comprehensive plan uses character areas such as Agricultural Preservation, Rural Places, Suburban Neighborhood, and commercial centers. Those planning categories are separate from the raster: a red cell shows developed surface, not a zoning district.
The largest current clusters are concentrated in the north and center, but forest and farmland remain between them. This is important when reading Oconee County as part of the Athens-Clarke metropolitan area: suburban growth is visible, yet the county is not one continuous built landscape.
The southern half keeps much of the county’s rural and agricultural character
Moving south from the main development concentrations, large farm blocks and forest become more common. The county’s planning history has long emphasized agricultural preservation and rural character in these areas, and the current 2023 plan still includes Agricultural Preservation and Rural Places as formal character areas.
Heritage Park provides a useful local example. Oconee County describes the 364-acre park in Farmington, south of Watkinsville on Highway 441, as a natural-resource property with woods and creeks bordered by the Apalachee River. It also includes facilities designed for agricultural and special events, showing how natural cover and rural activity can exist close together.
The vegetation view makes southern farms and woods easier to separate
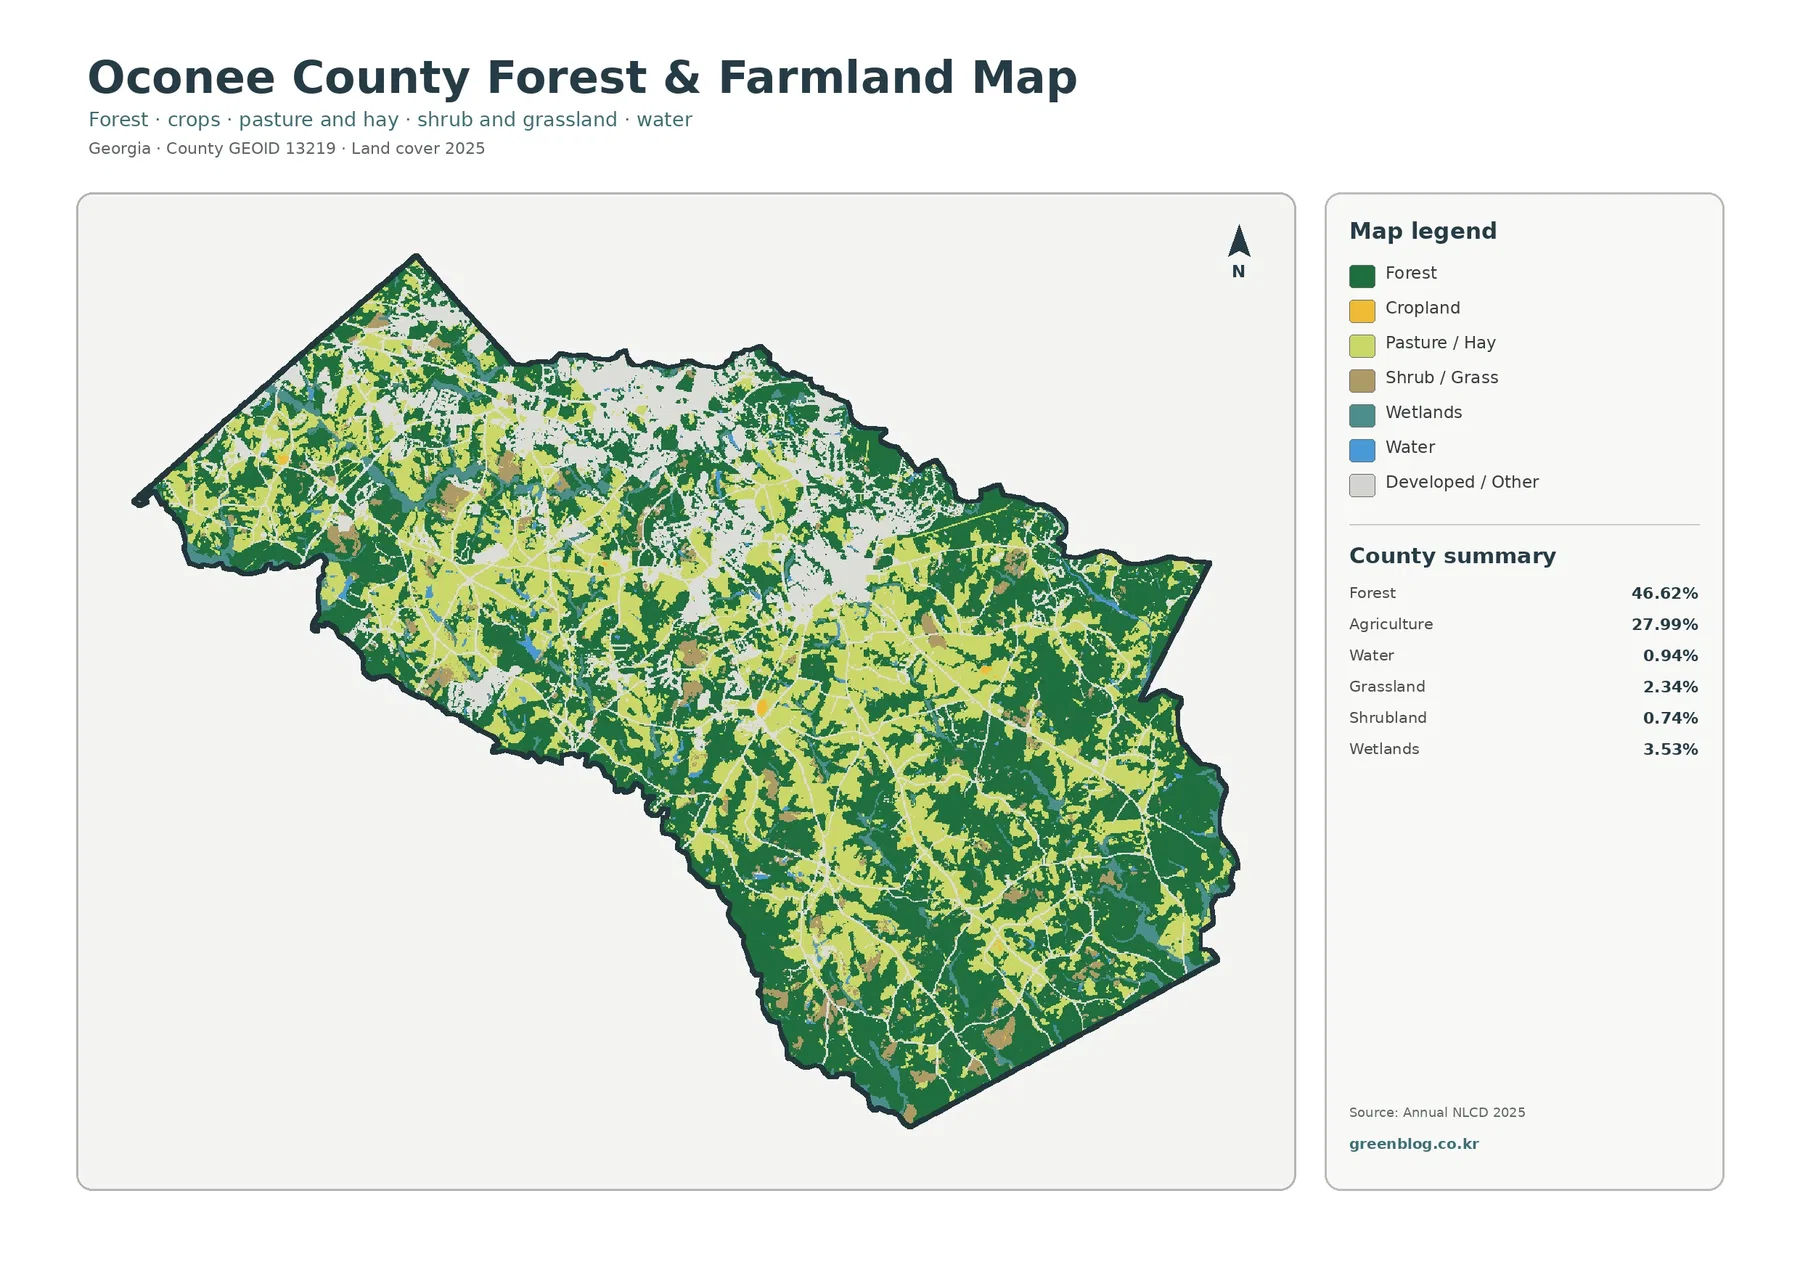
With developed cover muted, the southern and southeastern farm-and-forest pattern becomes much clearer. Large yellow fields sit beside broad green woodland, while the north contains more white developed-or-other areas that interrupt the vegetation. The center forms a transition where farms, woods, and settlement appear in close proximity.
Oconee County Extension reported 157 soil samples, 129 feed and forage samples, and 270 water samples in 2025. Those services support homeowners and producers working on soil health, pasture management, and water quality. They provide a county-specific agricultural context for the map without implying that a yellow raster cell identifies a particular crop or farm.
Annual NLCD assigns one predominant class to each 30-meter cell, so field edges, narrow woods, small ponds, roads, and mixed farmsteads can look simplified.
A 3.75% impervious mean separates the main growth areas from the rural south
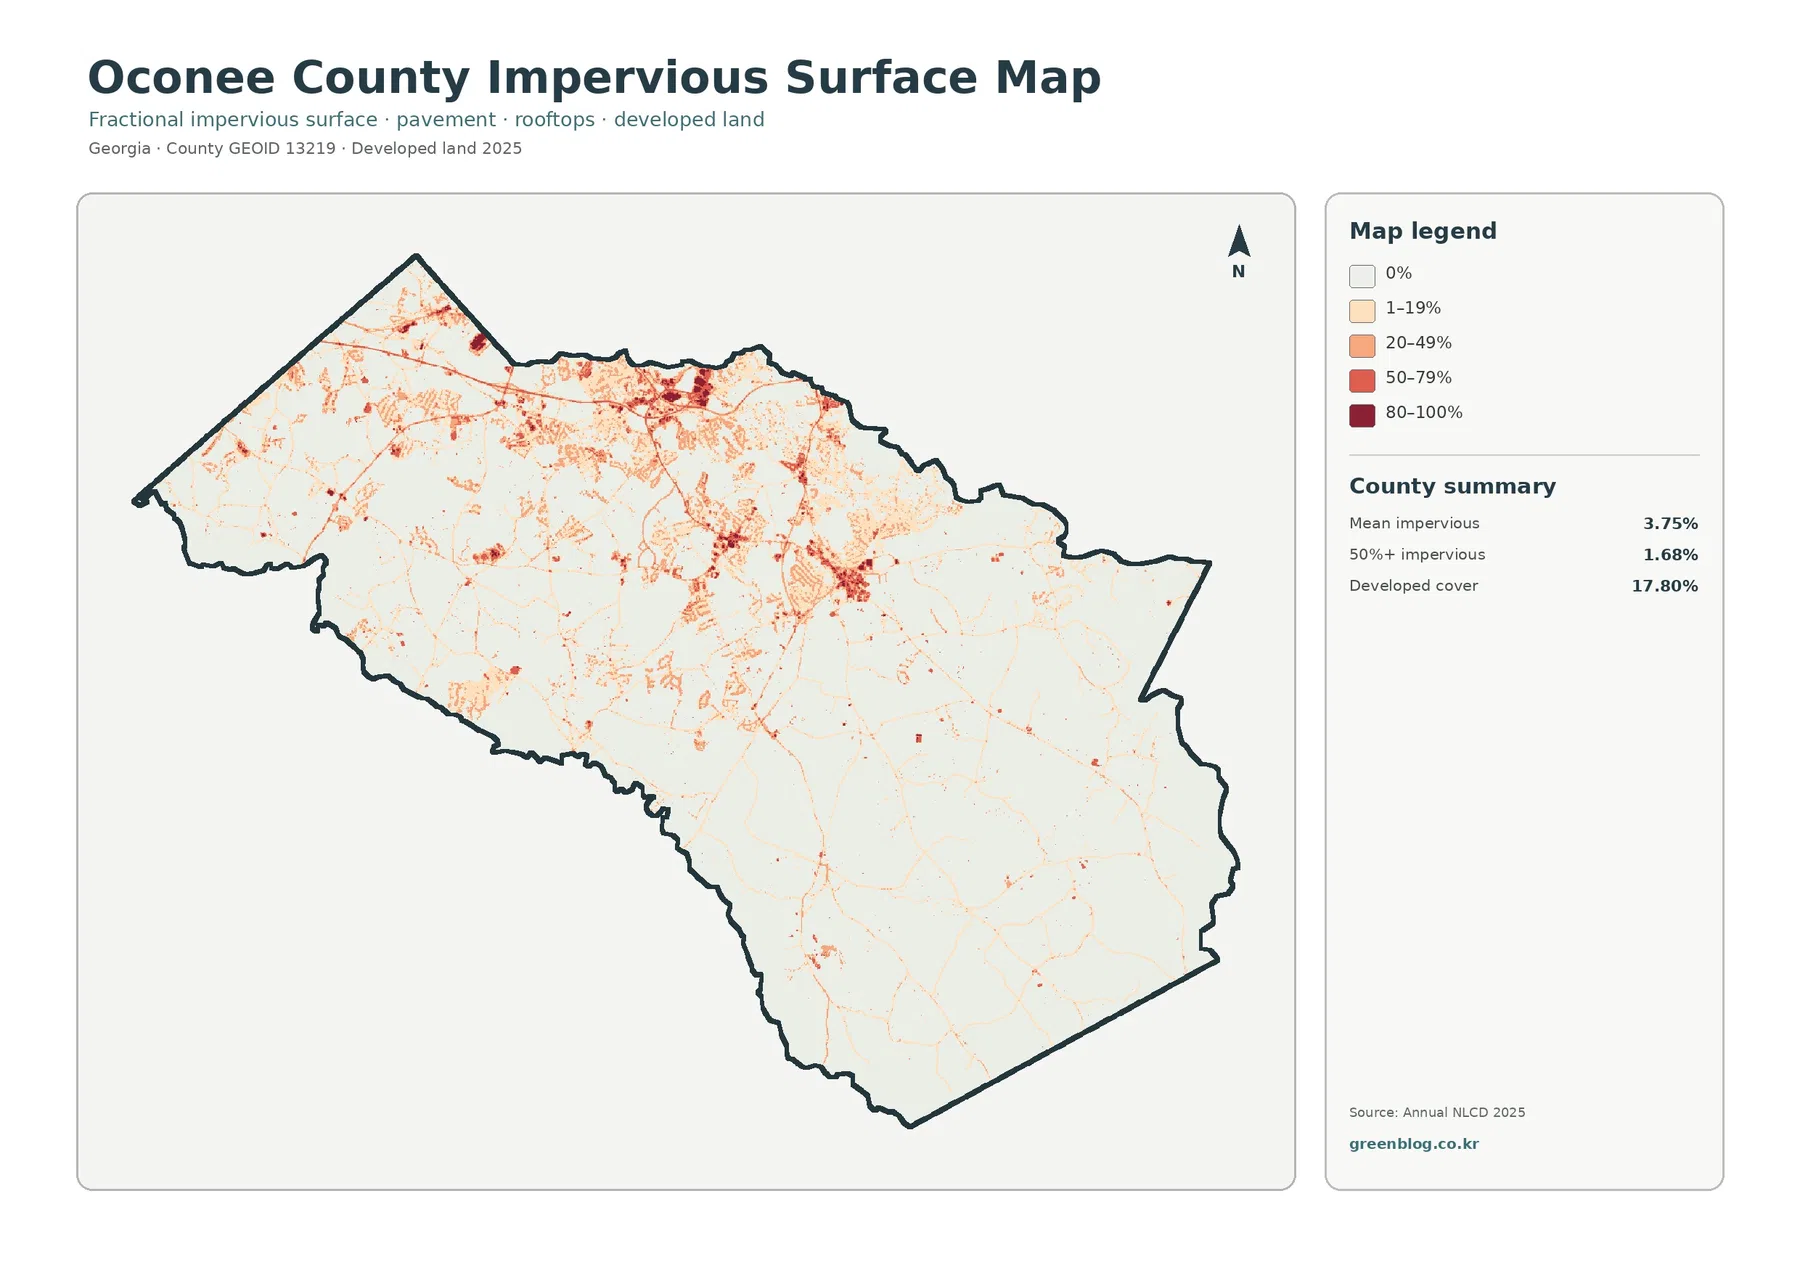
The strongest hard-surface concentrations appear in the north-central area and in a separate central cluster. Lower and medium values extend along road-shaped lines through the northwest and west, while the south and southeast remain mostly pale. The map therefore gives a much sharper picture of where roofs and pavement are concentrated than the general developed class alone.
Mean impervious cover is 3.75%, and 1.68% of the county reaches 50% impervious surface or higher. Developed land covers 17.80%, a broader category that can include trees, lawns, yards, and exposed ground around buildings and roads. The impervious product narrows the view to hard surfaces that resist water infiltration.
The 1985–2025 comparison records 10.06% classified to developed
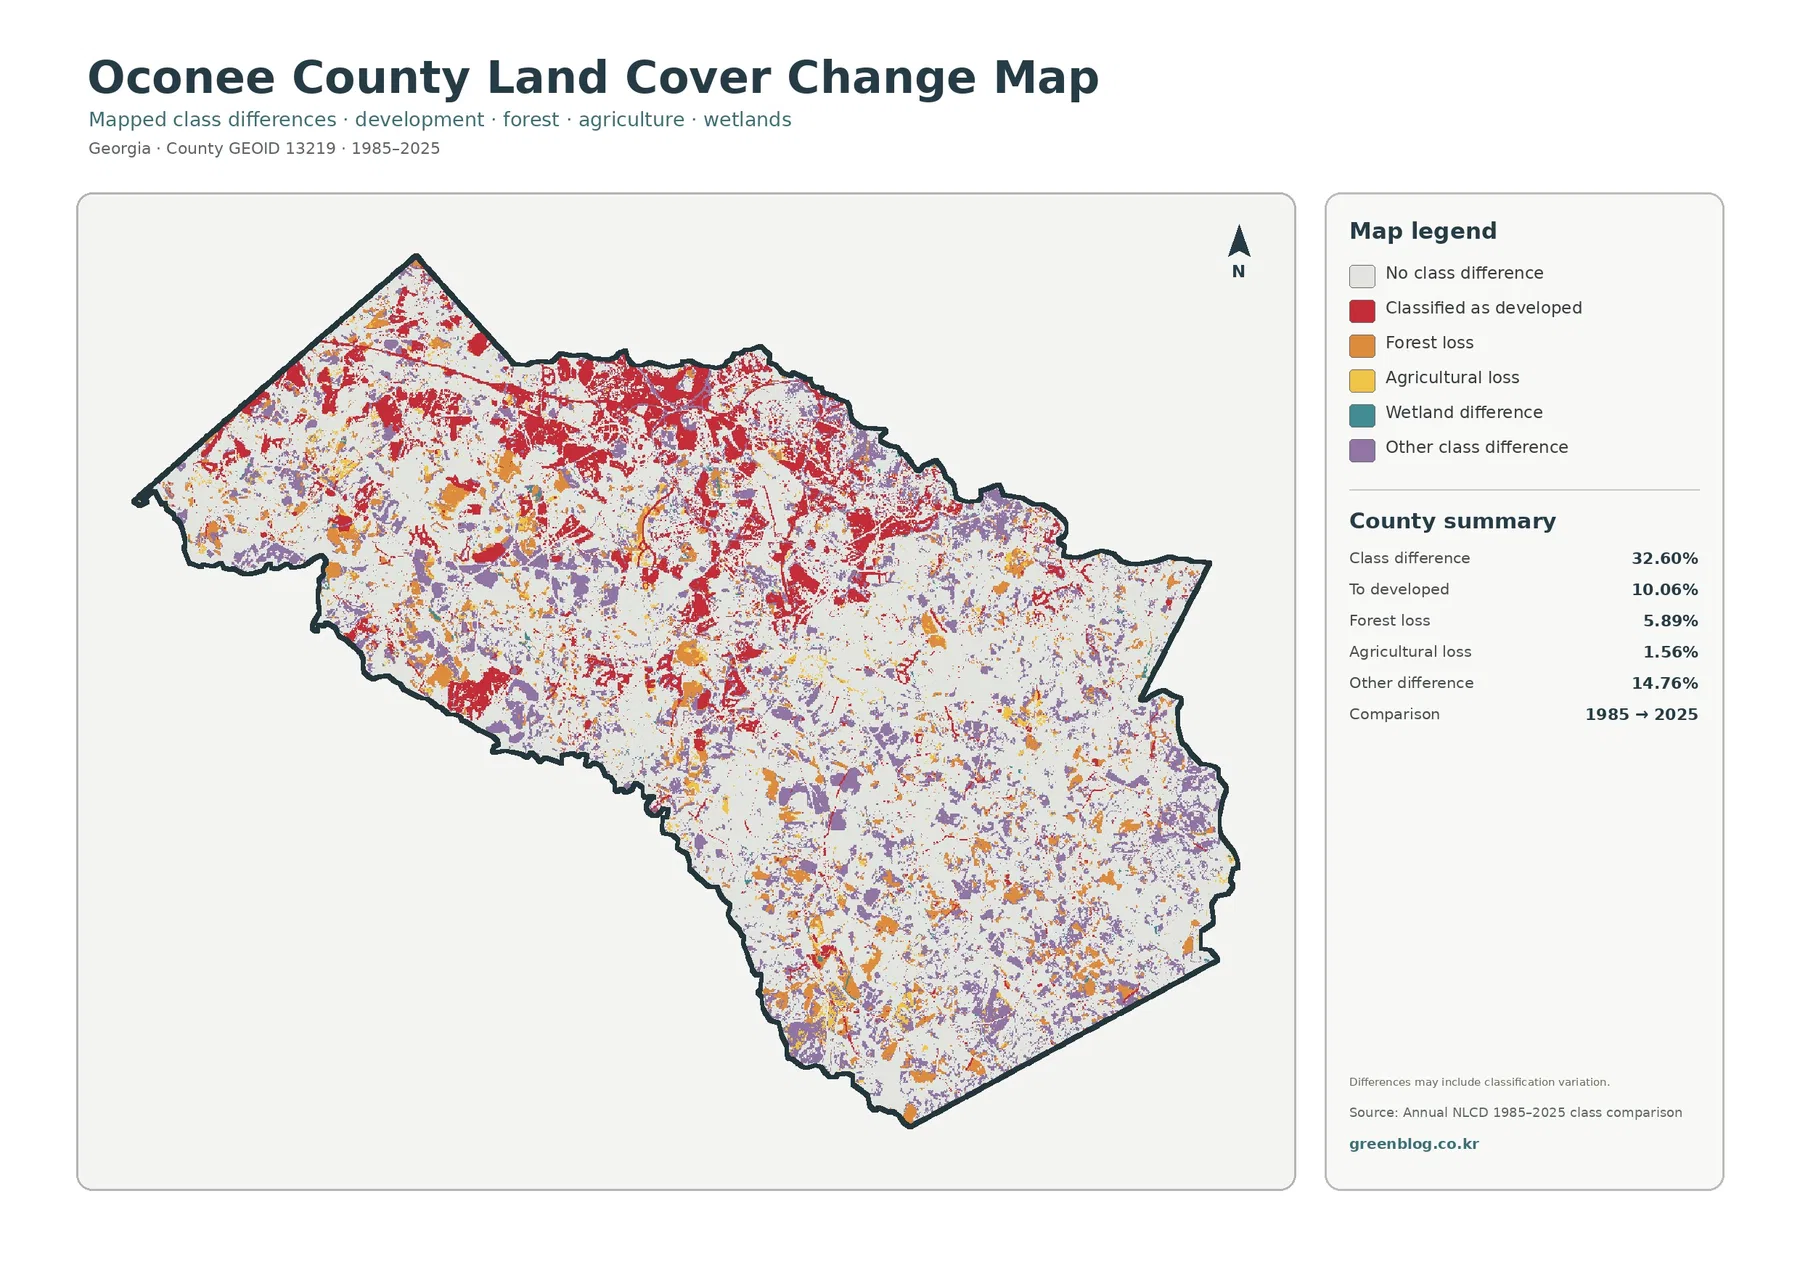
The total endpoint class difference is 32.60%. This number counts raster cells assigned different classes in 1985 and 2025. It is not an urbanization rate and does not mean that 32.60% of Oconee County was damaged or permanently converted.
The printed summary lists 10.06% classified to developed, 5.89% forest loss, 1.56% agricultural loss, and 14.76% other difference. Developed-change red is especially widespread across the north and center and extends west along road-oriented patterns. Forest-loss orange and other-difference purple reach much farther into the southern and eastern rural landscape.
Wetland difference appears in the legend without its own printed percentage. The missing value should not be reconstructed by subtraction and reported as official. The map also warns that classification variation may be included, so intermediate imagery and local development records are needed before assigning causes or exact timing.
Land cover is not the same as a character-area, zoning, or parcel map
Oconee County’s comprehensive plan includes categories such as Agricultural Preservation, Rural Places, Suburban Neighborhood, and Corridor Commercial. Those are planning concepts. Annual NLCD instead classifies the physical surface in the observation year, so green does not automatically mean protected land, yellow does not define agricultural zoning, and red does not identify commercial property.
Using the four JPGs for growth-versus-rural comparisons
Start with the 2025 countywide map when the goal is to show the balance among forest, agriculture, and developed land. The vegetation view is better for the southern farm-and-forest pattern. Choose the impervious map for the northern and Watkinsville-area hard surfaces, and reserve the endpoint map for a separate discussion of 1985–2025 classification differences.
Each JPG measures 2480 × 1754 pixels and works well for reports, lessons, and presentation graphics. The package does not identify the files as meeting an A3 high-resolution reference, so test a proof before large-format printing.
Frequently Asked Questions
What is the largest land-cover class in Oconee County?
Forest is the largest class in the supplied 2025 summary at 46.62%. Agriculture follows at 27.99% and developed land at 17.80%, producing a county that still has extensive rural cover despite concentrated growth in the north and center.
Why is developed land 17.80% while mean impervious cover is only 3.75%?
Developed classes can include trees, lawns, yards, and exposed ground around buildings and roads. The impervious layer measures the harder surfaces such as roofs, pavement, and parking areas.
Does the 32.60% endpoint difference mean nearly one-third of the county urbanized?
No. It counts all cells with different class labels in 1985 and 2025. The summary separately lists 10.06% classified to developed, 5.89% forest loss, 1.56% agricultural loss, and 14.76% other difference.
Sources and Reference Data
- MRLC Annual NLCD Data – official access to annual land-cover and comparison products
- USGS Annual NLCD Land Cover Classification – definitions for forest, agriculture, developed land, wetlands, and related classes
- U.S. Census Bureau TIGER/Line Shapefiles – authoritative county, place, and transportation layers for comparison
- Oconee County – 2023 Comprehensive Plan – official character-area and long-range land-use context
- Oconee County – Heritage Park – official context for woods, creeks, the Apalachee River, and agricultural facilities south of Watkinsville
- UGA Extension – Oconee County Impact – recent county information on soil, forage, water testing, agriculture, and natural resources
Map File Information
The ZIP contains four original JPG maps for comparing Oconee County's 46.62% forest cover, 27.99% agriculture, northern and Watkinsville-area development, impervious surfaces, and 1985–2025 class differences.
- Included Files: Use only the versions confirmed in the article and supplied images
- File Type: Use the confirmed download contents
- Intended Use: Printing, education, presentations, and map-based projects
Related Maps
- Appling County Georgia Land Cover Map
- Atkinson County Georgia Land Cover Map
- Bacon County Georgia Land Cover Map
Green Map creates custom-edited map images using open geographic data sources such as geoBoundaries, Natural Earth, OpenStreetMap, and government open data.
These maps are edited visual materials, not raw data files, and are provided for education, documents, presentations, and graphic reference.