Newton County shows a strong transition from suburban growth to a more rural eastern landscape. Forest covers 46.23% of the supplied 2025 data, developed land 24.08%, and agriculture 19.87%. The western and central portions contain broad connected development around the Covington and I-20 area, while the east contains much larger farm and forest blocks. This Newton County Georgia Land Cover Map makes that west-to-east change easy to compare.
The page includes four WebP views for land cover, vegetation, impervious surface, and the 1985–2025 endpoint comparison. Four original 2480 × 1754 JPG maps are bundled in one ZIP for county profiles, planning context, lessons, and presentations.
Table of Contents
The western half carries most of the county’s developed surface
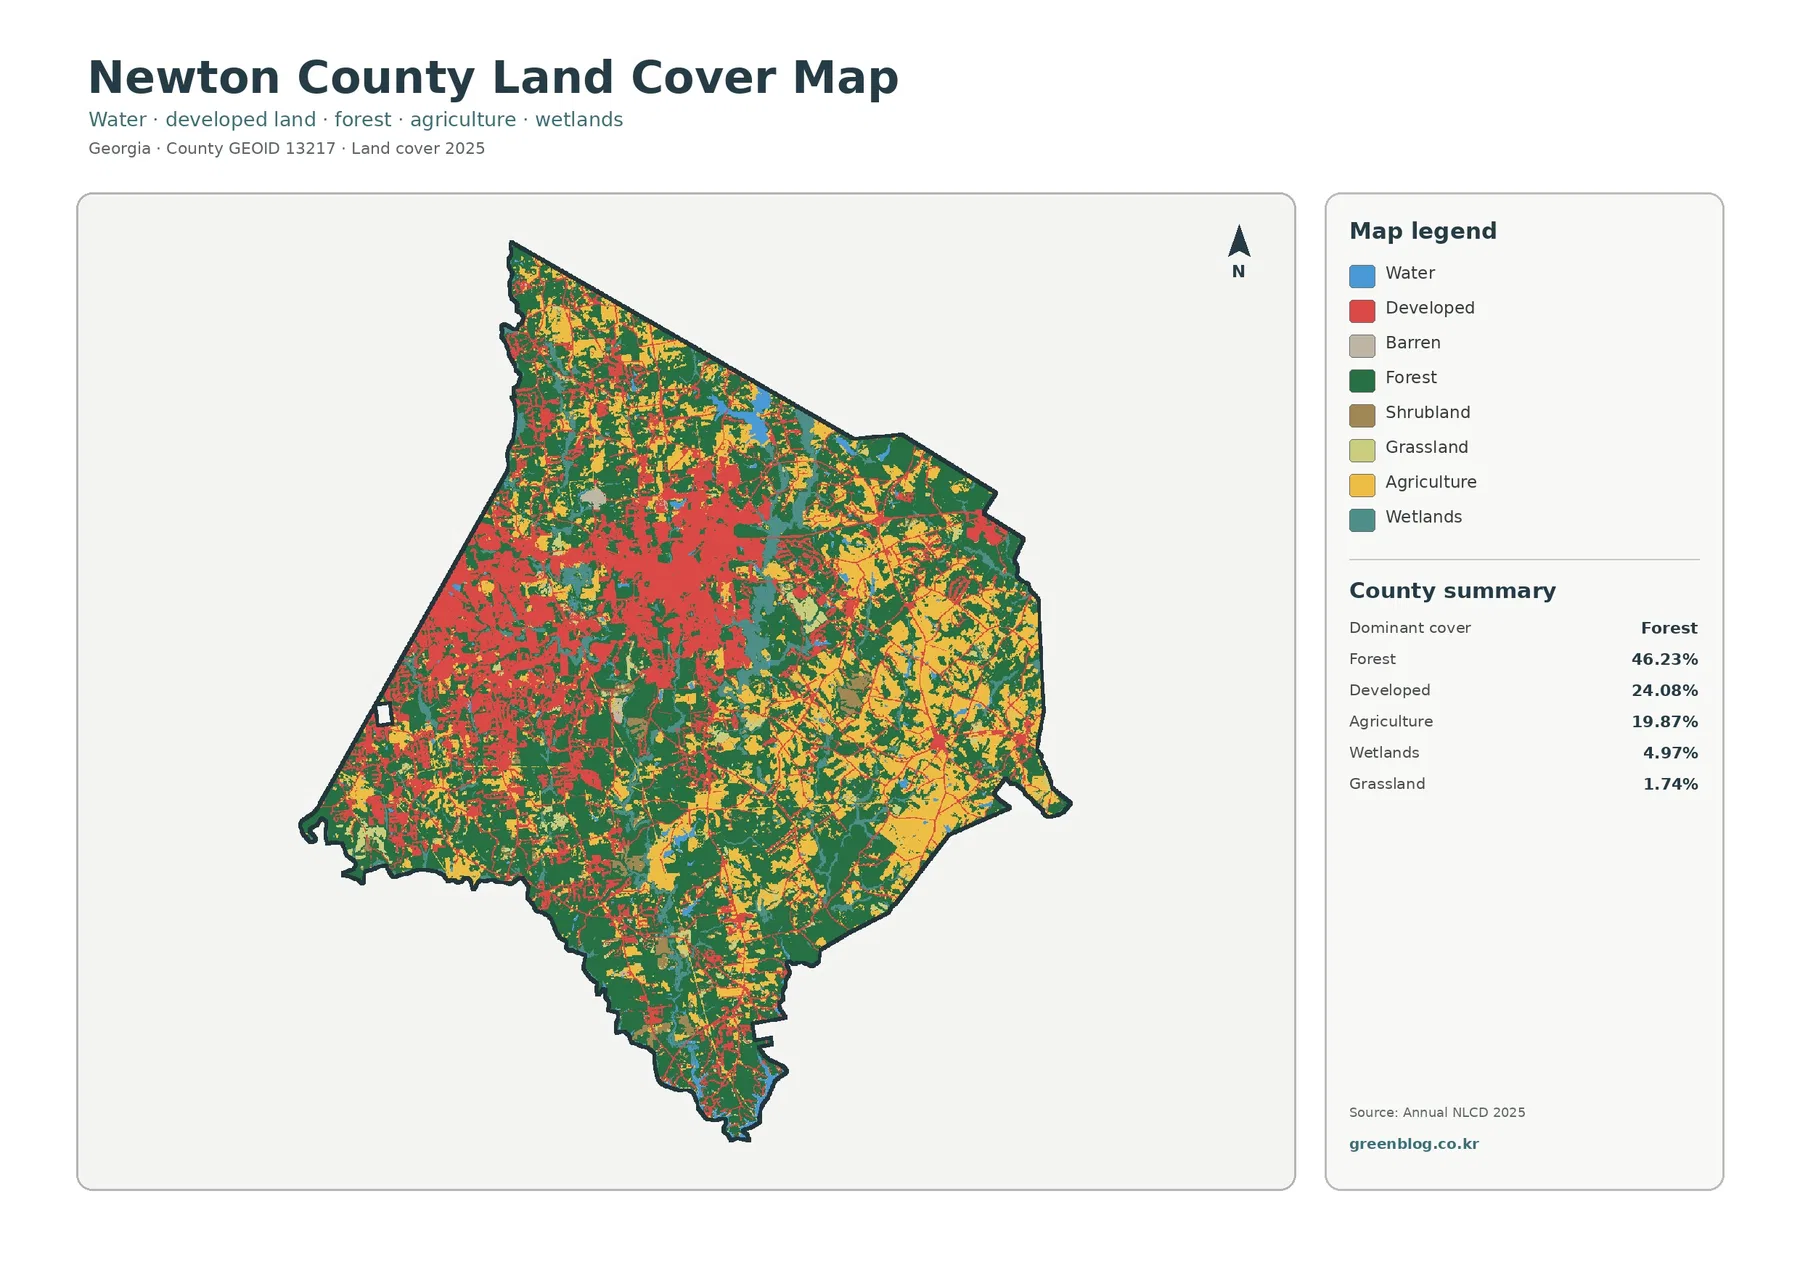
Red developed cover is concentrated most strongly in the west and west-central portions of the county. It forms a broad connected area rather than a single compact downtown patch, with additional clusters farther north. Development accounts for 24.08%, a large share for a county that still remains 46.23% forest overall.
Forest is the largest class and remains common throughout the map. Large green blocks occupy the center-east, south, and northeast, while wooded strips continue through the developed west. The county therefore does not separate into a completely urban west and untouched rural east; the difference is one of concentration and proportion.
Agriculture covers 19.87% and is visually strongest in the east and southeast. Yellow farm blocks also appear in the north and center, but they are less continuous near the main western development. Wetlands account for 4.97%, grassland 1.74%, shrubland 1.21%, and open water 1.70%.
Covington and I-20 anchor the county’s main growth corridor
Newton County’s official profile identifies Covington as the county seat and describes the county as being east of Atlanta along Interstate 20. That geography matches the largest concentration of development and hard surfaces near the center-west of the maps. It provides a grounded way to discuss the growth pattern without guessing at neighborhood names from raster colors.
Covington’s current comprehensive plan describes the city as a developing suburb facing continued development pressure from the Atlanta metropolitan area along the I-20 corridor. The plan also expects ongoing housing, commercial, and industrial demand. The land-cover pattern is consistent with a corridor where developed surfaces extend beyond a compact city center and connect with surrounding growth areas.
The red raster footprint is not Covington’s city limit. Newton County and Covington manage zoning and development through separate legal maps and ordinances; land cover only describes the physical surface.
Oxford, Porterdale, and nearby communities sit inside a mixed developed-and-green landscape
Newton County’s official information lists Porterdale, Mansfield, Newborn, and Oxford alongside Covington, with Social Circle partly extending into the county. Oxford’s official comprehensive plan places it just north of I-20 and directly north and east of Covington. Those municipalities help explain why the center-west developed area is broader and more complicated than one city footprint.
Even in the developed west, forest and wetlands remain visible. Green blocks and teal corridors interrupt the red surface, showing that developed classes can include low-density neighborhoods, yards, trees, and open space.
The vegetation view reveals a much stronger farm pattern in the east
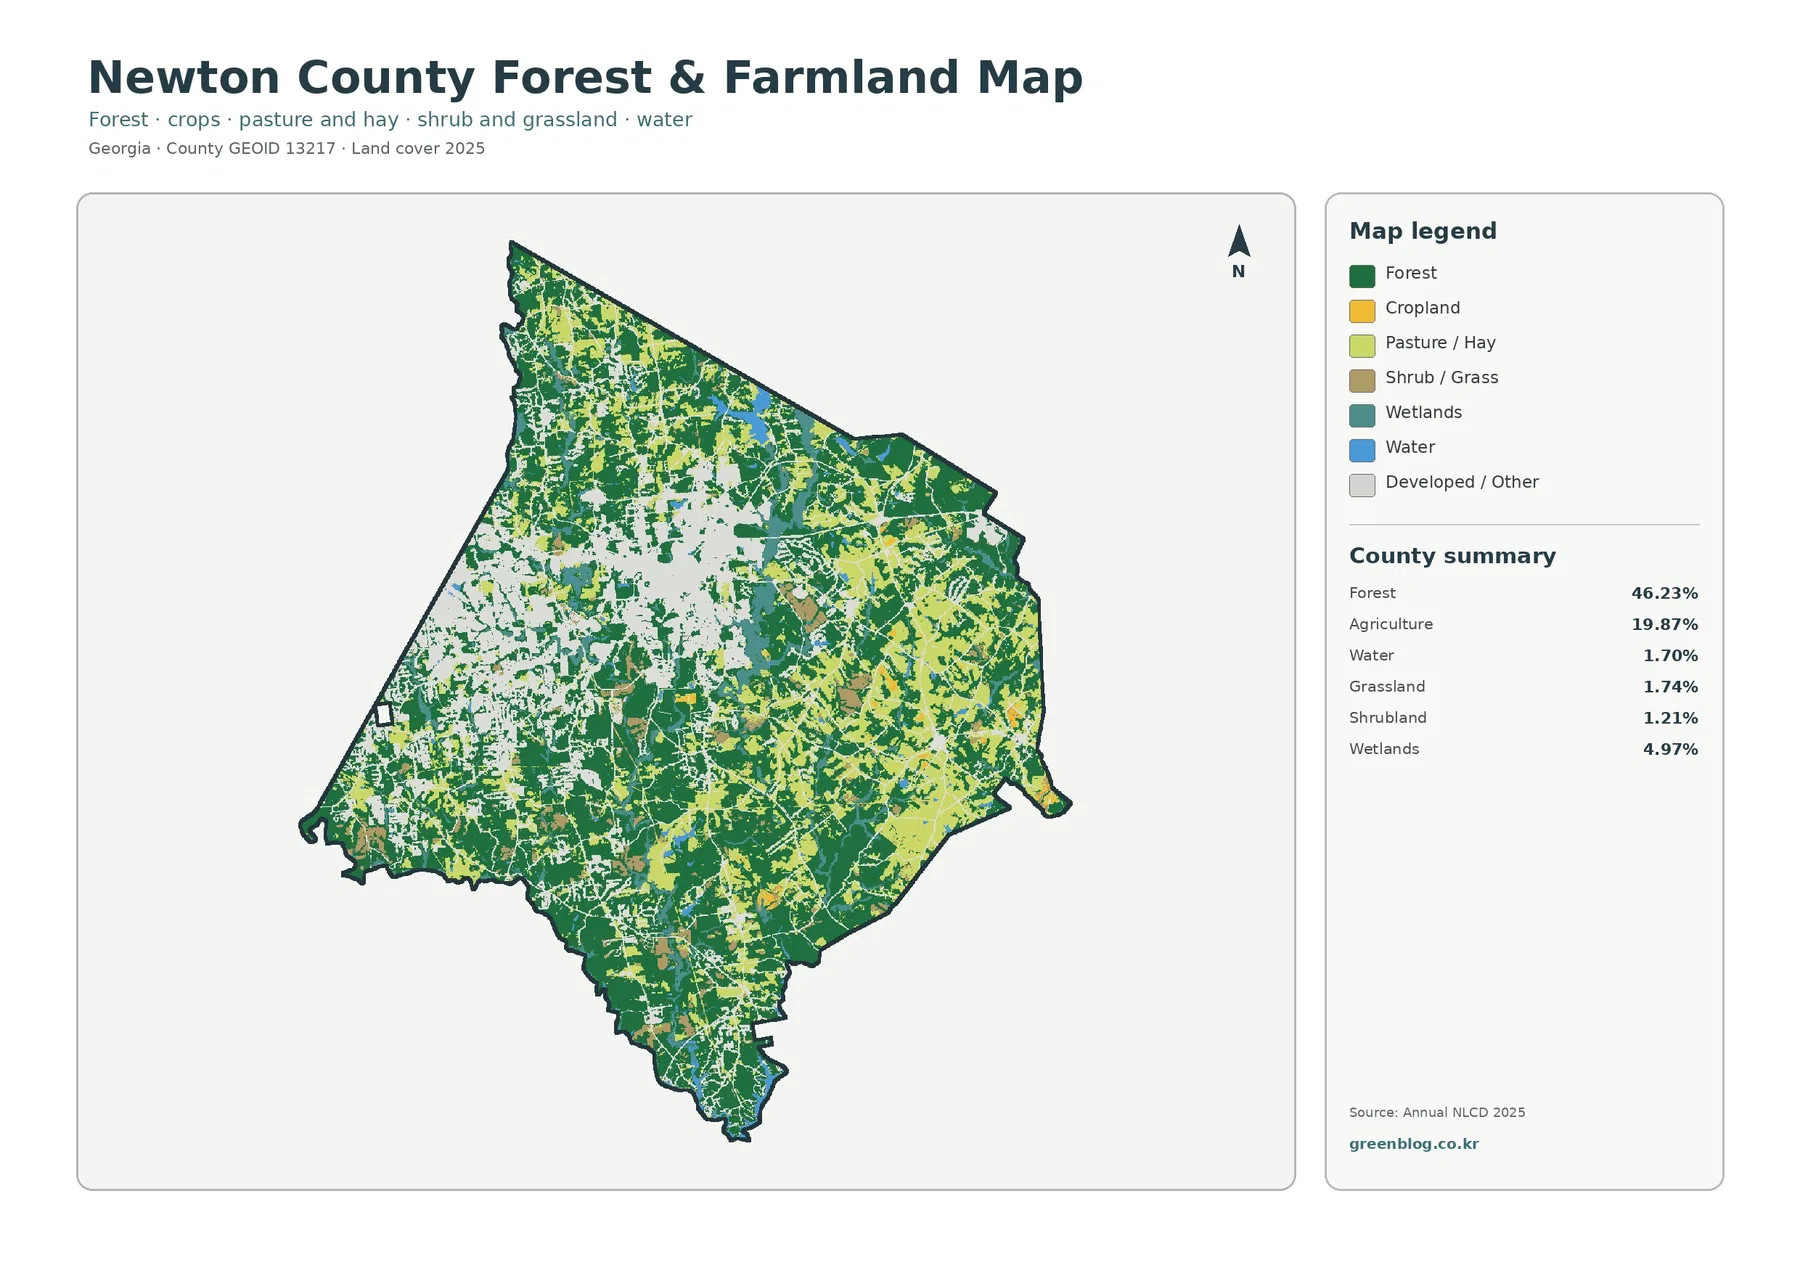
Once developed cover is muted, the eastern half looks much more agricultural. Large yellow blocks occupy the east and southeast and are separated by forest and wetland corridors. The west still contains scattered farms, but urban and wooded surfaces divide them into smaller pieces.
Newton County Extension supports farmers and landowners with pasture and forage management, farm visits, soil and forage testing, and research-based agricultural education. Recent county material also highlights horses, beef cattle, and straw among important commodities. That local context helps explain why agriculture remains significant even as development occupies nearly one-quarter of the county.
A 5.77% impervious mean separates dense growth from lower-density development
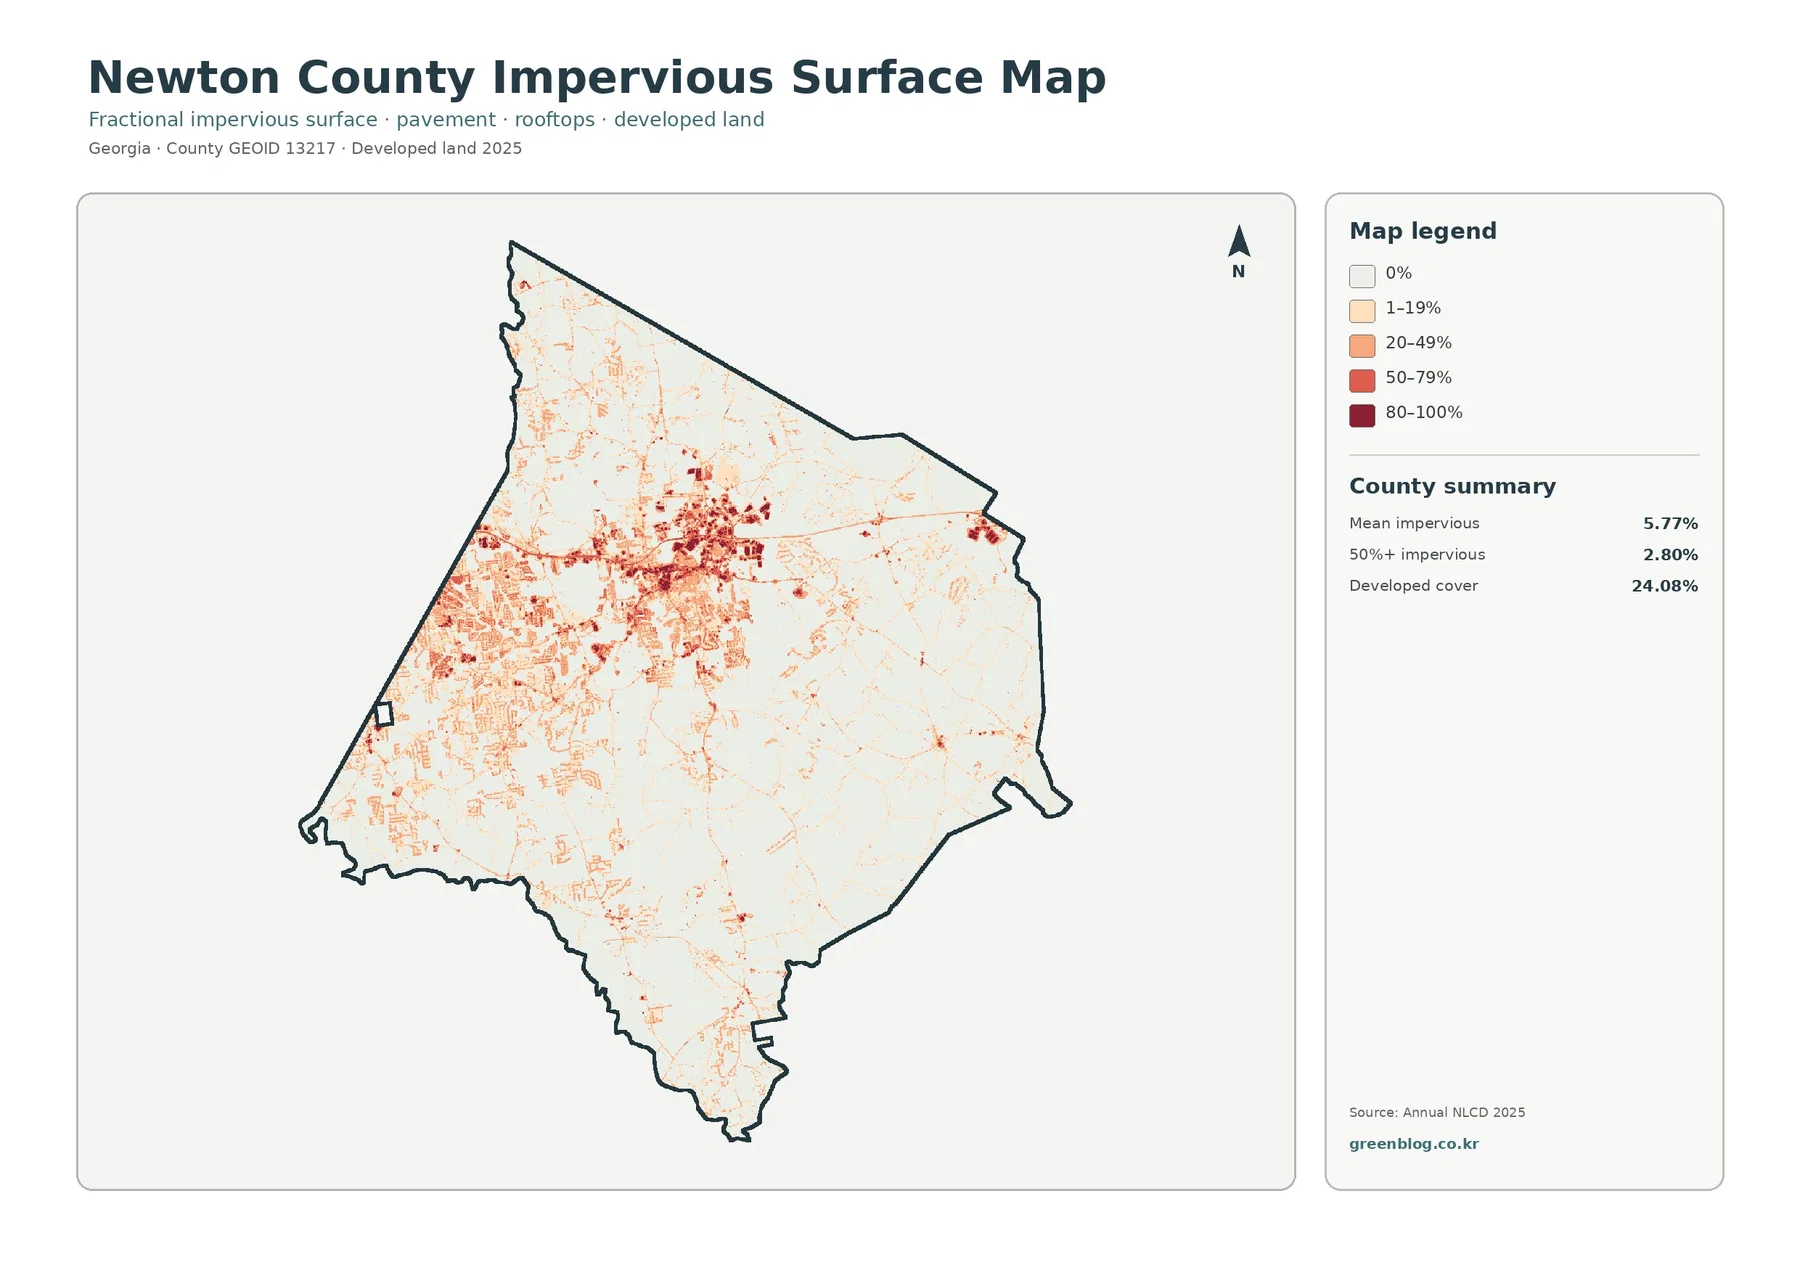
The strongest impervious values cluster near the center-west, joined by east-west road-shaped traces. The western side also contains broad areas of lower and medium impervious cover, while the eastern farm-and-forest landscape stays mostly pale. This makes the main growth corridor easier to see than on the general classification map.
Mean impervious cover is 5.77%, and 2.80% of Newton County reaches 50% impervious surface or more. Developed land covers 24.08%, which includes permeable surfaces such as lawns, trees, and exposed soil around roads and buildings. The impervious product narrows the view to roofs, pavement, parking areas, and similar hard materials.
Impervious cover can support stormwater discussions, but it is not a flood-risk map. Site-level questions need separate terrain, rainfall, stream, soil, and drainage data.
The 1985–2025 comparison records 13.55% classified to developed
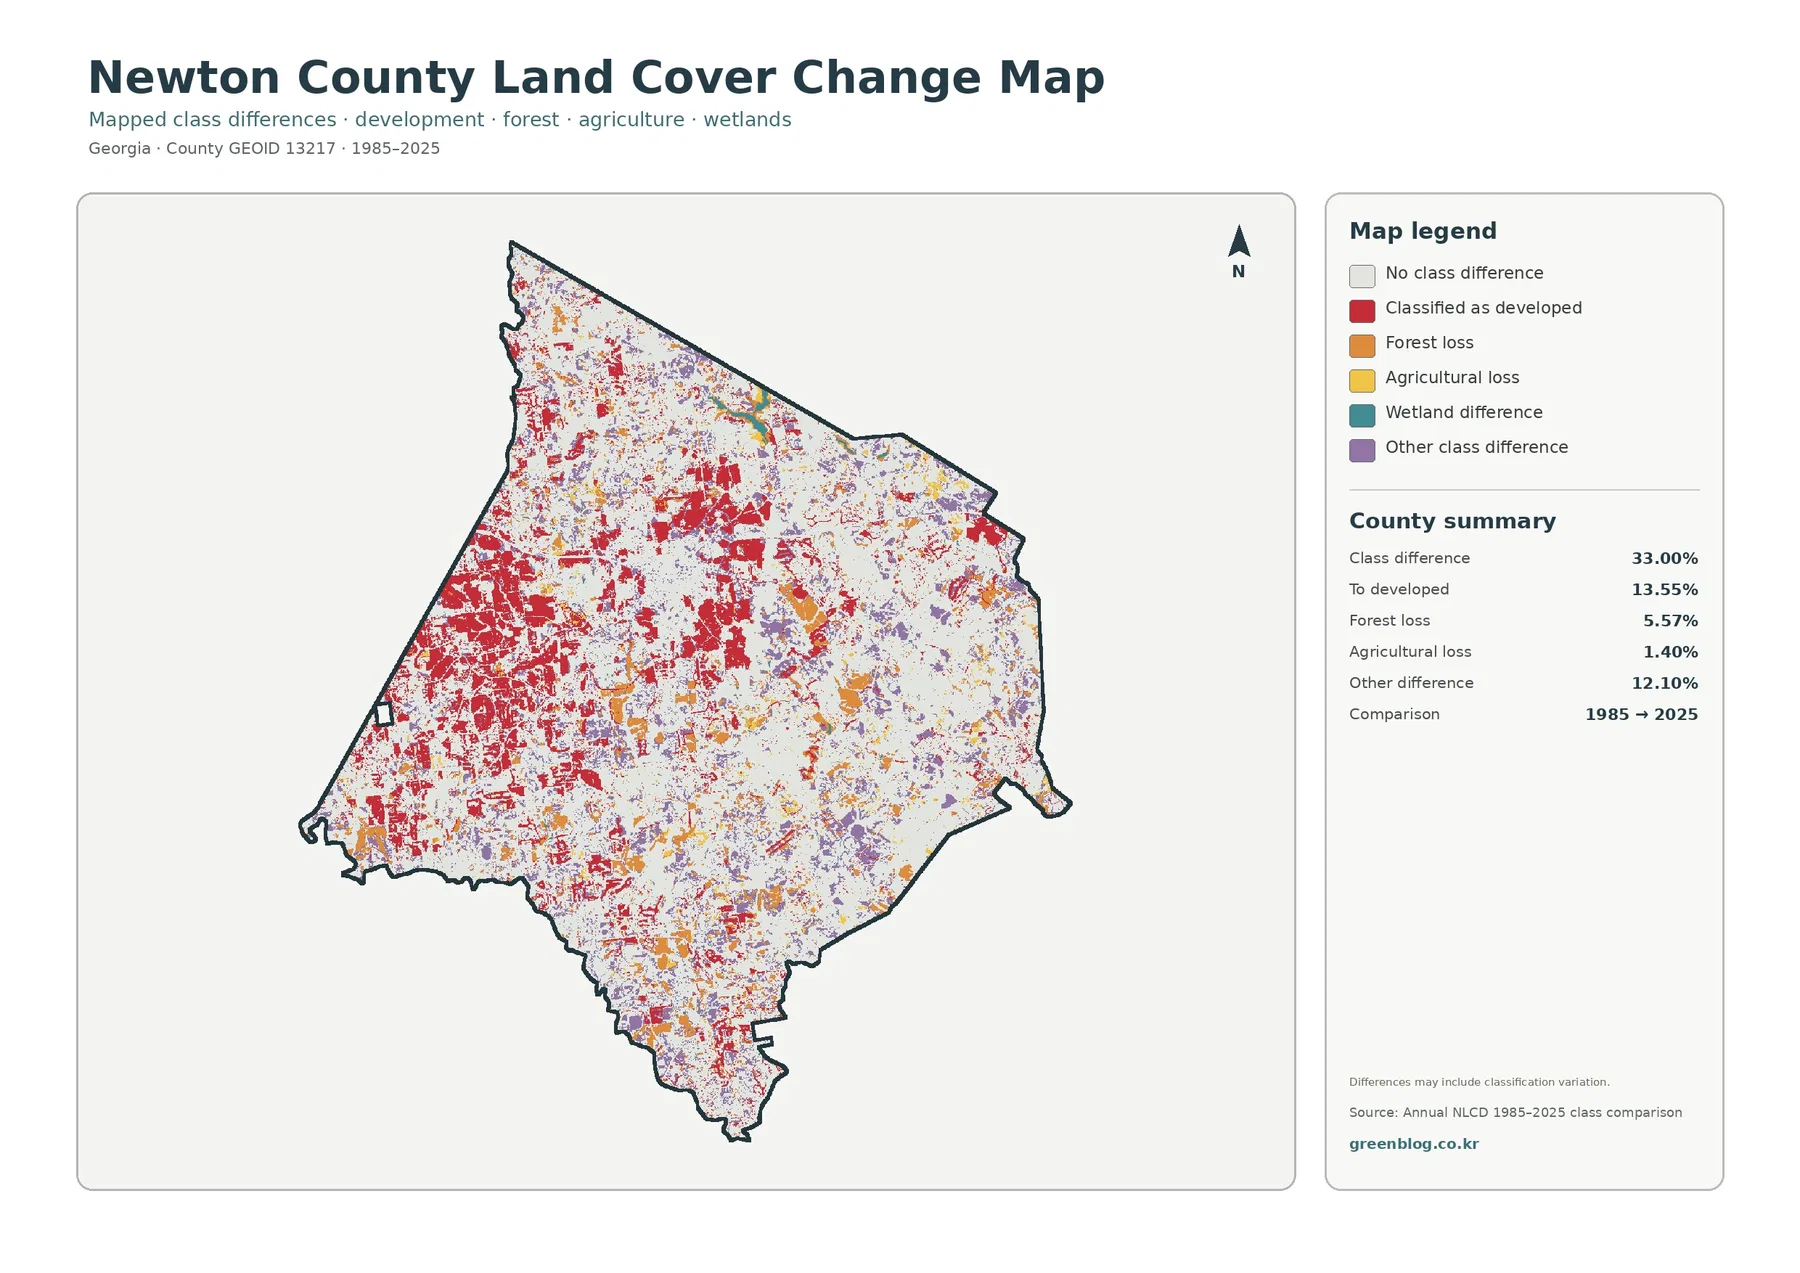
The total endpoint class difference is 33.00%. That figure counts raster cells assigned different classes in 1985 and 2025. It is not the share of Newton County that was damaged or urbanized, and it should not be subtracted from the current developed or forest percentage to reconstruct the earlier map.
The printed summary lists 13.55% classified to developed, 12.10% other difference, 5.57% forest loss, and 1.40% agricultural loss. Developed-change red is widespread across the west and center and appears in additional northern and southern pockets. Forest-loss orange and other-difference purple extend more widely into the rural east.
Wetland difference appears in the legend without a separately printed percentage. The missing rate should not be recreated by subtraction and reported as official. The map also notes that classification variation may occur, so intermediate imagery and local development records are needed before assigning exact causes or dates.
Growth along I-20 does not erase Newton County’s rural eastern half
Newton County describes itself as an I-20 county east of Atlanta, and Covington’s plan explicitly discusses metropolitan growth pressure along that corridor. The current map and the large 13.55% developed-change category make that growth context visible. The concentration is strongest in the west and center rather than evenly distributed across the county.
Land cover is different from zoning, parcels, and legal development rights
Newton County zoning defines legal uses such as residential, commercial, and industrial. Annual NLCD instead classifies the physical surface, so red does not equal commercial zoning and yellow does not define an agricultural district.
Choosing the four JPG maps for growth and rural-land comparisons
Use the 2025 countywide map first to explain the balance among forest, developed land, and agriculture. The vegetation view is better for the eastern farm-and-forest pattern. Choose the impervious map for hard surfaces around Covington and the I-20 growth corridor, and reserve the endpoint map for a separate discussion of 1985–2025 classification differences.
Each JPG measures 2480 × 1754 pixels and suits reports, lessons, and presentations. Test a proof before large-format printing because the package does not mark the files as A3 high-resolution assets.
Frequently Asked Questions
What is the largest land-cover class in Newton County?
Forest is the largest class in the supplied 2025 summary at 46.23%. Developed land follows at 24.08% and agriculture at 19.87%, producing a strong contrast between the growth-heavy west and the more rural east.
Why is developed land 24.08% while mean impervious cover is only 5.77%?
Developed classes can include lawns, trees, yards, and exposed ground around buildings and roads. The impervious layer measures the harder surfaces such as roofs, pavement, and parking areas.
Does the 33.00% endpoint difference mean one-third of Newton County became urban?
No. It counts all cells with different class labels in 1985 and 2025. The summary separately lists 13.55% classified to developed, 5.57% forest loss, 1.40% agricultural loss, and 12.10% other difference.
Sources and Reference Data
- MRLC Annual NLCD Data – official access to annual land-cover and comparison products
- USGS Annual NLCD Land Cover Classification – definitions for forest, developed land, agriculture, wetlands, and related classes
- U.S. Census Bureau TIGER/Line Shapefiles – authoritative county, place, and transportation layers for comparison
- Newton County – About Newton County – official county context for Covington, I-20, and Newton County municipalities
- Newton County – Development Services – official comprehensive-plan, zoning, GIS, stormwater, and development information
- UGA Extension – Newton County Agriculture & Natural Resources – local pasture, forage, farm, soil-testing, and sustainable-agriculture resources
Map File Information
The ZIP contains four original JPG maps for comparing Newton County's 46.23% forest cover, 24.08% developed land, eastern agriculture, Covington-I-20 hard surfaces, and 1985–2025 class differences.
- Included Files: Use only the versions confirmed in the article and supplied images
- File Type: Use the confirmed download contents
- Intended Use: Printing, education, presentations, and map-based projects
Related Maps
- Appling County Georgia Land Cover Map
- Atkinson County Georgia Land Cover Map
- Bacon County Georgia Land Cover Map
Green Map creates custom-edited map images using open geographic data sources such as geoBoundaries, Natural Earth, OpenStreetMap, and government open data.
These maps are edited visual materials, not raw data files, and are provided for education, documents, presentations, and graphic reference.