More than half of Lincoln County is forest in the supplied 2025 summary, and open water is unusually prominent for an inland Georgia county. Forest covers 53.58%, water 17.88%, agriculture 11.01%, and developed land 6.09%. The largest built concentration sits near the middle around Lincolnton, while broad blue water wraps around much of the eastern side. This Lincoln County Georgia Land Cover Map explains how those features fit together.
The page includes four map views: current land cover, forest and farmland, fractional impervious surface, and a 1985–2025 endpoint comparison. The WebP previews can be read beside the discussion, and the four original 2480 × 1754 JPG maps are available together in one ZIP for county profiles, lessons, environmental presentations, and general reference.
Table of Contents
Clarks Hill Lake makes water a major part of the countywide picture
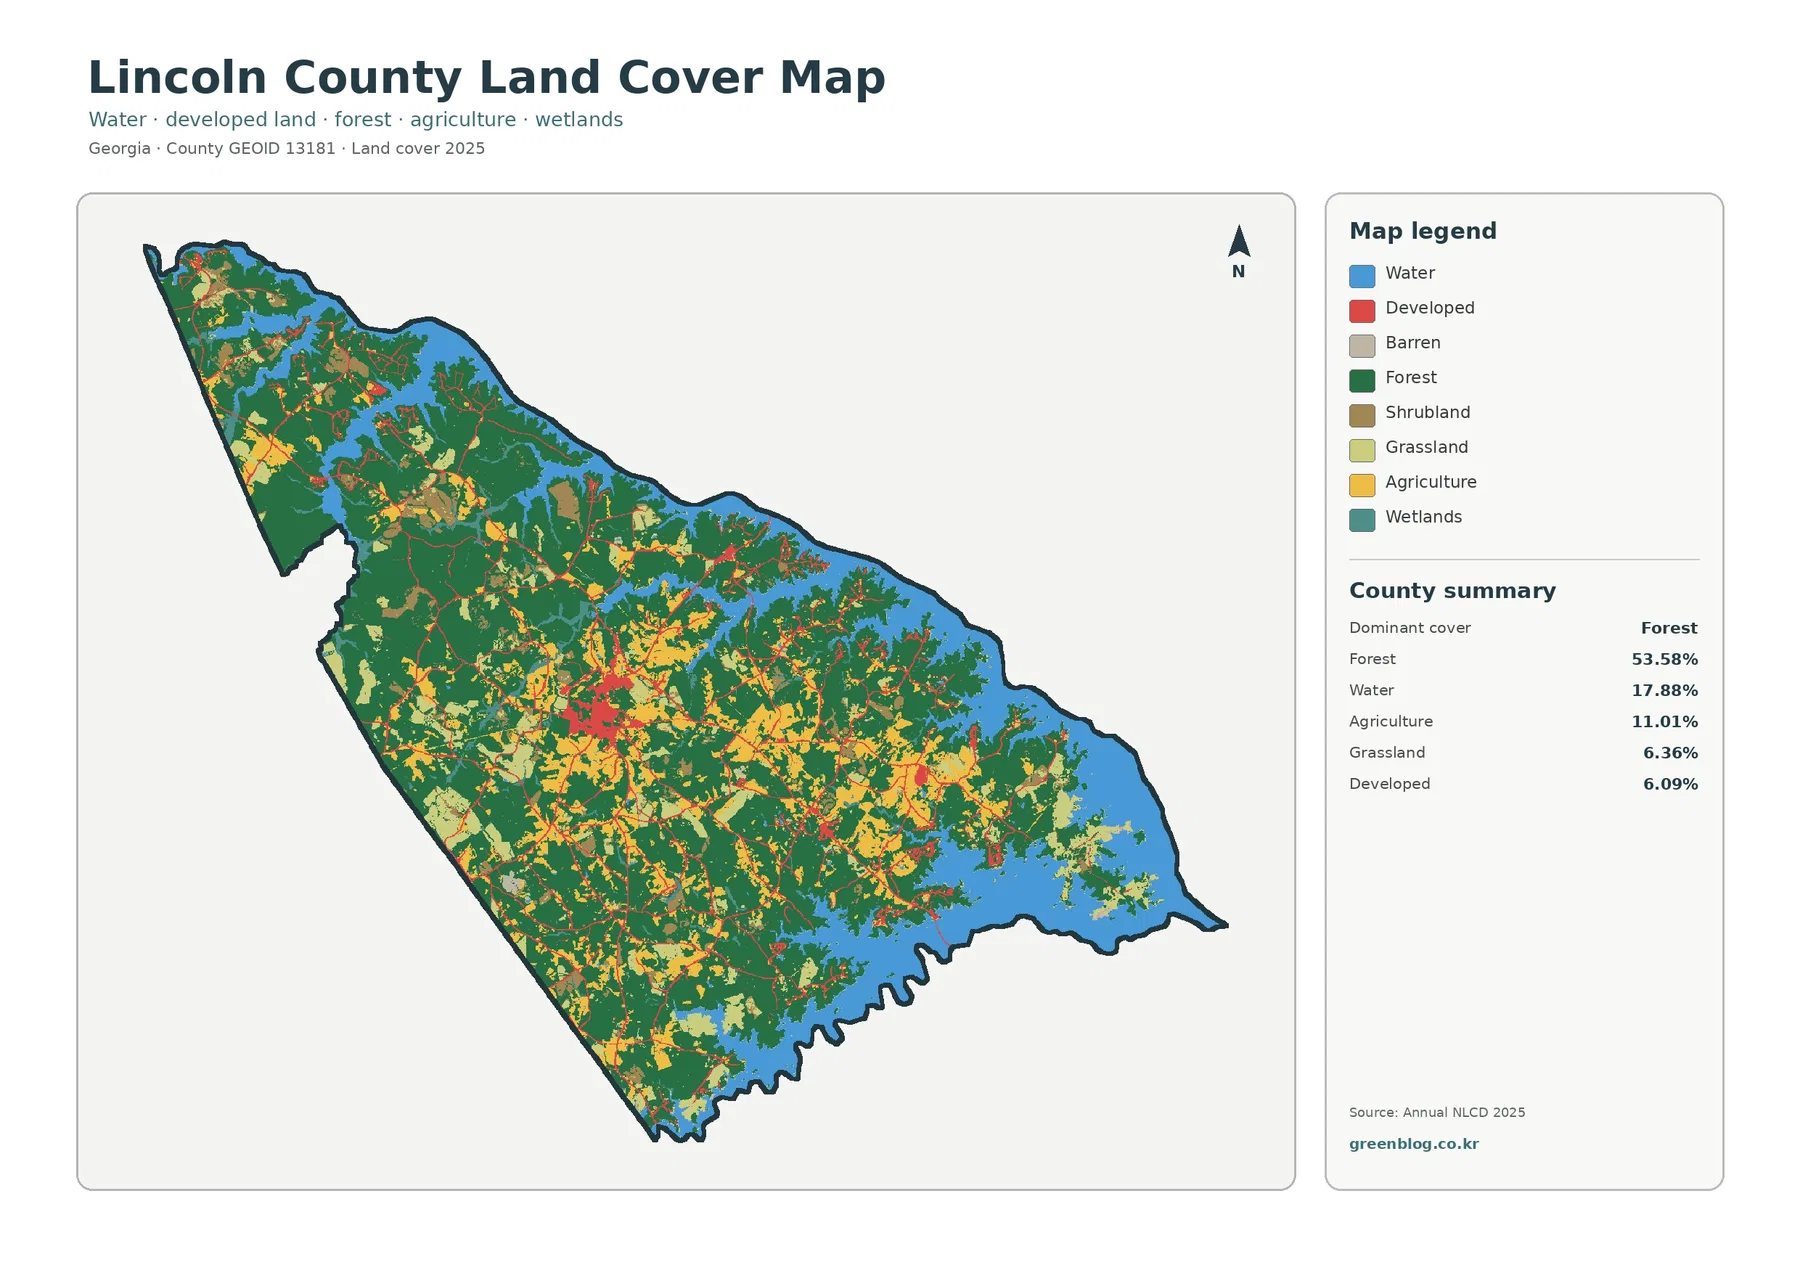
The eastern and northeastern edges contain broad blue areas with a highly indented shoreline. Water accounts for 17.88% of the county, a much larger share than in many neighboring inland counties. Lincoln County’s official community page highlights roughly 400 miles of shoreline on Clarks Hill Lake, and the City of Lincolnton also presents the lake as a defining nearby feature. That local context fits the water-heavy eastern side visible in the map.
Forest remains the dominant class at 53.58%. Large green blocks fill the northwest and southwest and continue across much of the center. Wooded land also reaches the shoreline in many places, so the county is not divided into a simple “forest west, water east” pattern. Instead, forested peninsulas, coves, and smaller open areas create a complicated edge where land and lake repeatedly meet.
Agriculture covers 11.01%. Yellow farm patches are most noticeable through the central and southeastern interior and appear again in parts of the northwest. They rarely form one uninterrupted agricultural zone. Grassland accounts for 6.36% and shrubland for 3.15%, adding smaller open areas around farms and forest edges. Wetlands are only 1.62%, far below the open-water share.
That difference between water and wetlands matters. Blue water represents exposed water surfaces, while wetland classes can include vegetation and saturated ground. Lincoln County has a large reservoir shoreline, so the open-water percentage is substantial even though the mapped wetland share is small. The two classes should not be merged when the map is used in a lesson or report.
The impervious map turns Lincolnton into the clearest hard-surface cluster
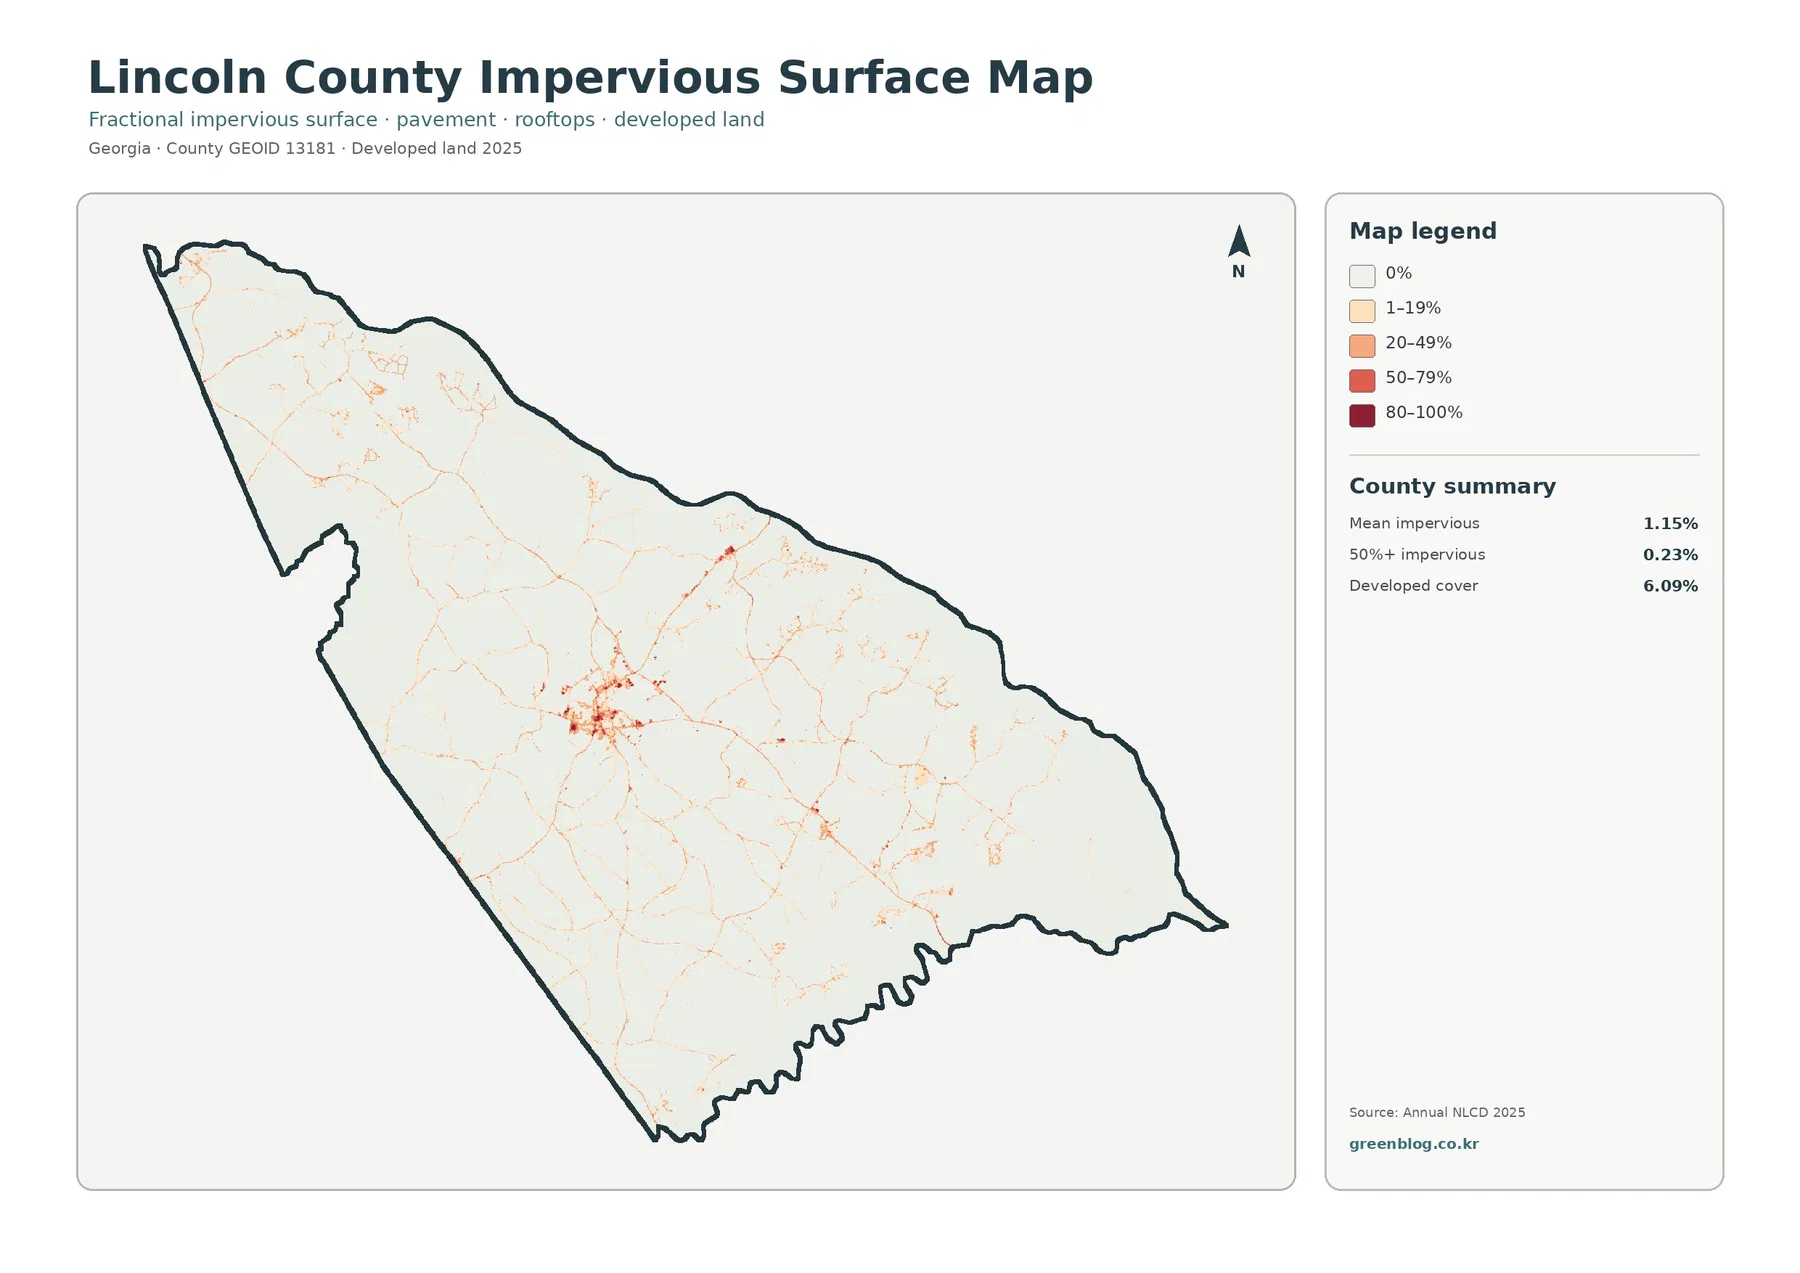
A compact group of darker cells near the center stands apart from the rest of the county. Official planning material identifies Lincolnton as the county seat and only municipality, which makes it a sensible reference for this concentration. Smaller high-value patches appear to the east and northwest, but none matches the central cluster in size. Outside those places, most of the county remains in the zero or low-impervious categories.
Mean impervious cover is 1.15%, and only 0.23% of the county is mapped at 50% impervious surface or higher. Developed land, by contrast, covers 6.09%. The difference reflects what the two products measure: developed land can include lawns, trees, yards, and bare soil around buildings, while fractional impervious cover isolates hard surfaces such as roofs, pavement, and parking areas.
Thin lines extend away from the central cluster and resemble a road network. They are useful for seeing where hard surfaces are concentrated along travel corridors, but the image provides no route names, traffic counts, or lane information. A specific highway should be identified on a current transportation layer before its name is attached to a line in this raster.
Forest and farmland share the interior without producing one broad farm belt
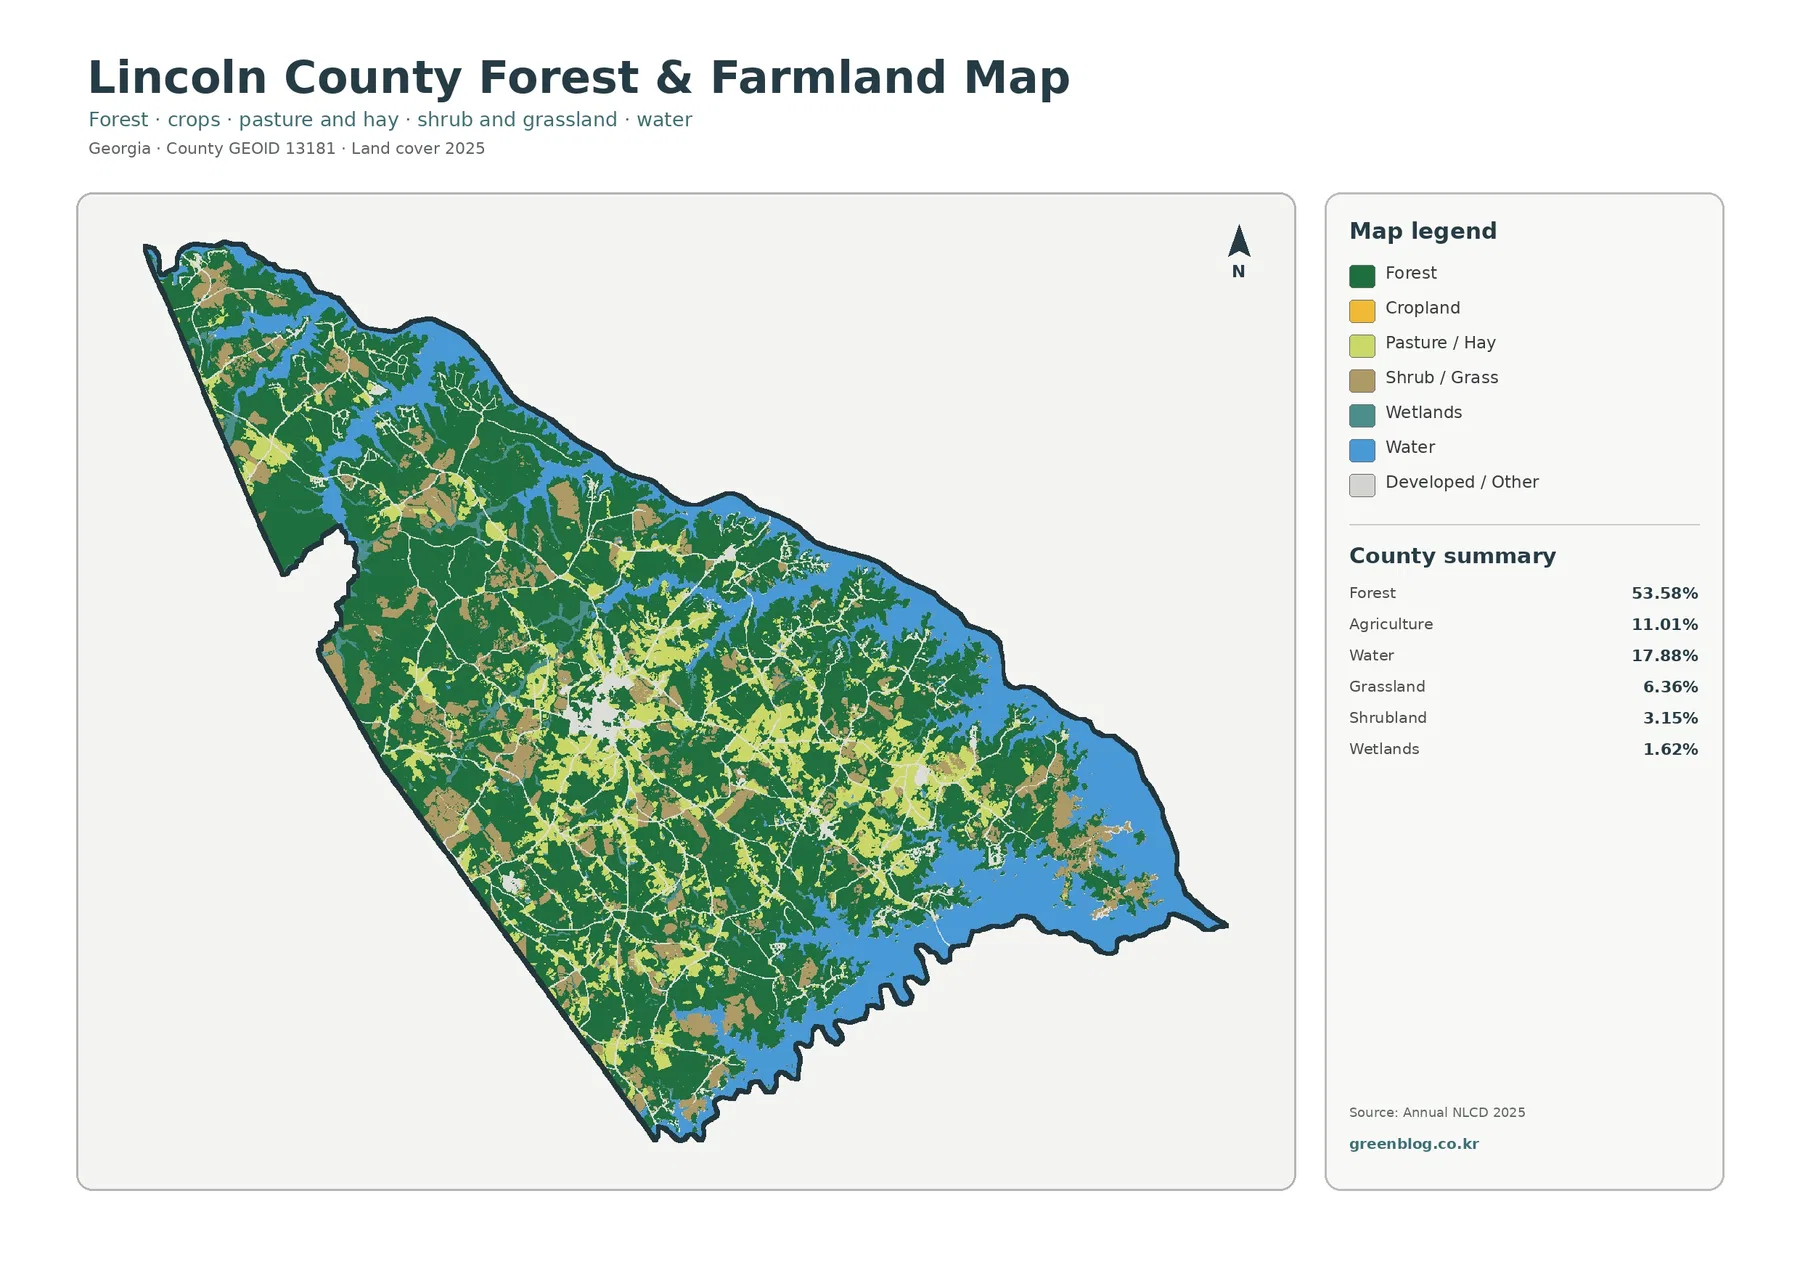
Removing the strong developed color makes the forest majority even more obvious. Green fills much of the northwest, southwest, and central county. Yellow cropland and lighter pasture or grass colors occur in pockets rather than a continuous strip. The central and southeastern interior contains several larger agricultural openings, while the eastern edge changes quickly from wooded land to lake water.
Lincoln County’s official community page emphasizes both extensive forest and Clarks Hill Lake shoreline as defining natural assets. That description matches the two most prominent colors in the supplied map. It does not mean every green cell is commercial timberland or protected forest, however. Land cover records the predominant surface seen by remote sensing, not ownership, management plans, or legal land use.
The 1985–2025 endpoint comparison is dominated by forest and other class differences
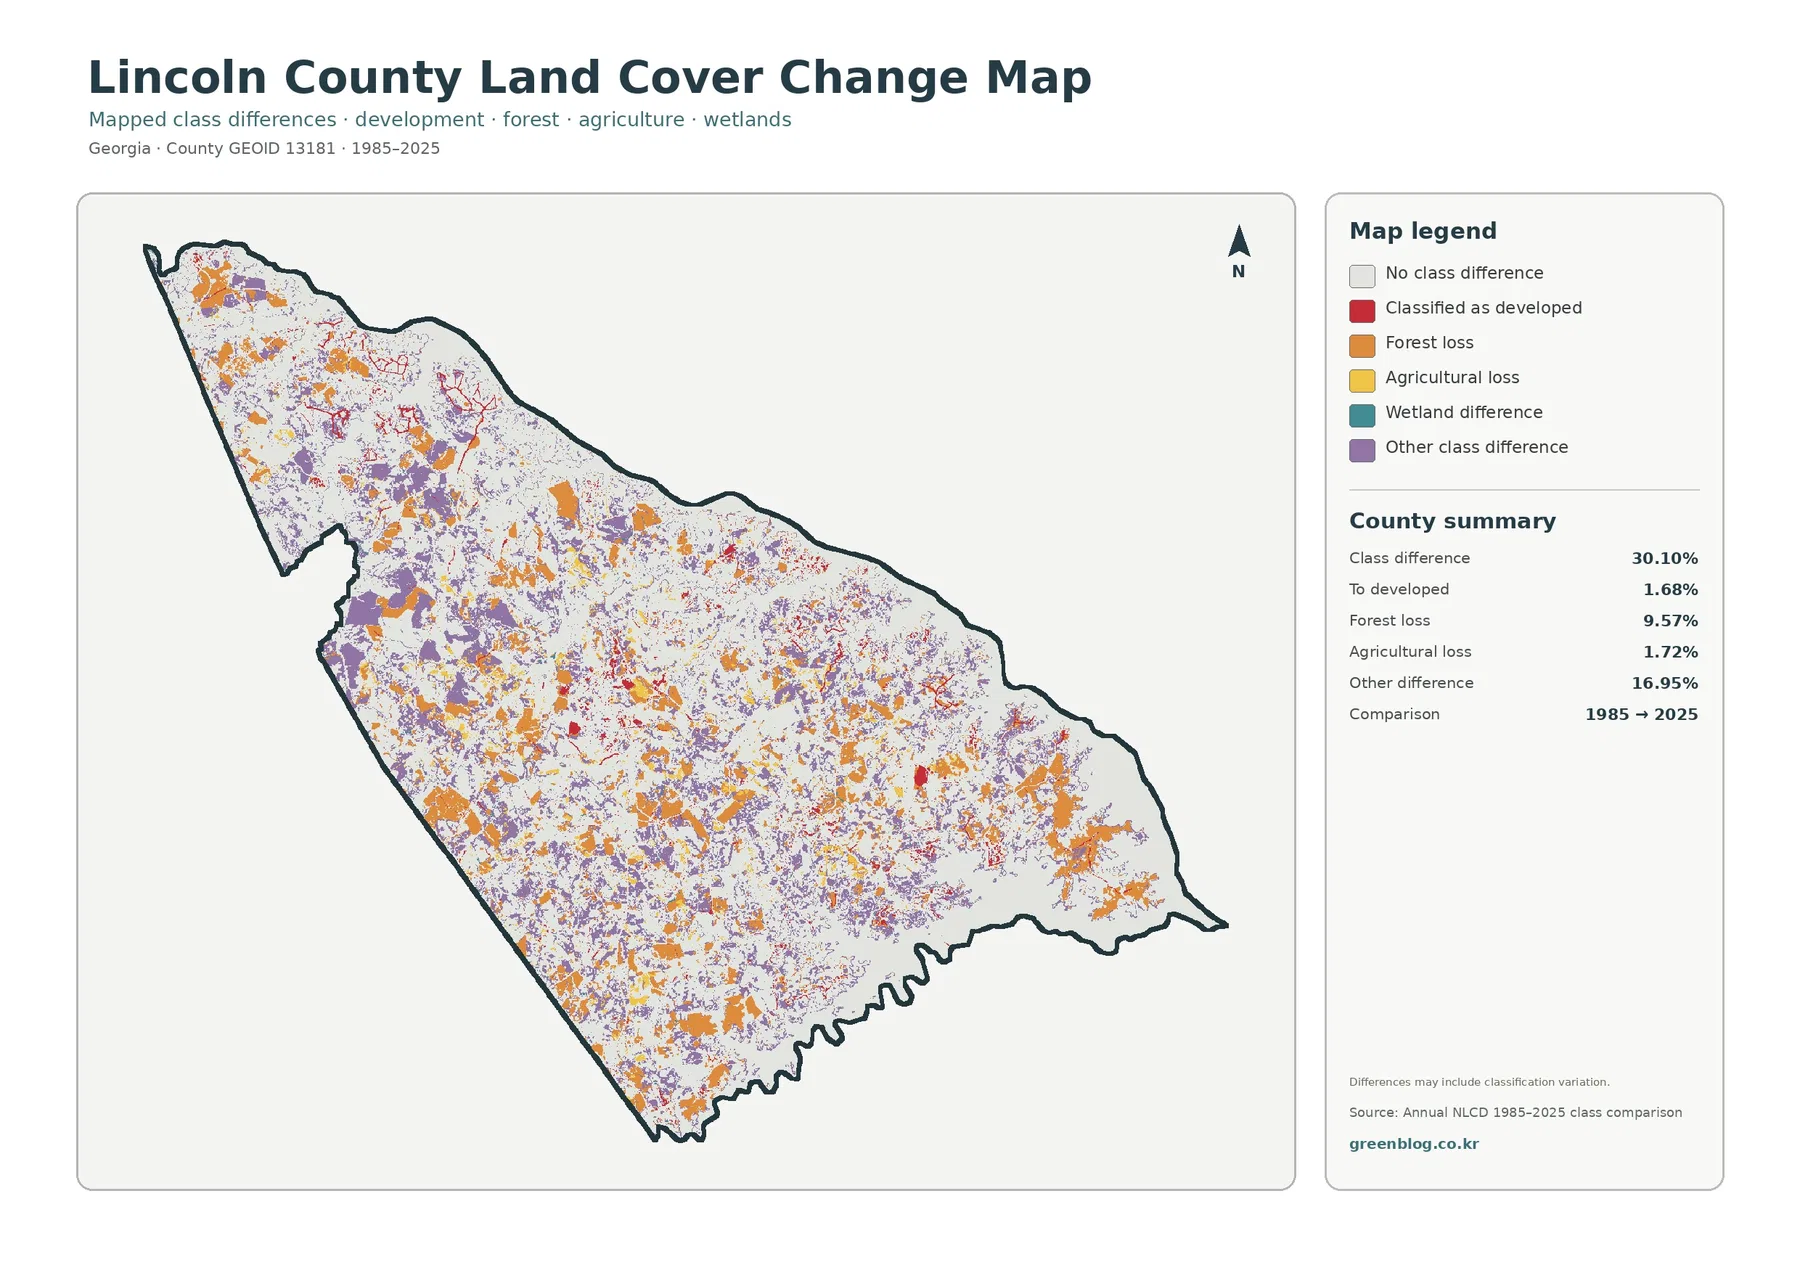
The total class difference between the 1985 and 2025 endpoints is 30.10%. That number is the share of cells assigned different classifications at the two endpoints. It is not the percentage of Lincoln County that was damaged, cleared, or urbanized. The map itself warns that classification variation may be included, which is important when imagery dates, seasonal conditions, mixed pixels, and classification methods differ.
The printed summary lists 9.57% forest loss, 16.95% other difference, 1.72% agricultural loss, and 1.68% classified to developed. Orange forest-loss and purple other-difference cells are scattered across much of the county, with several larger clusters in the northwest, center, and southeast. Red developed-change cells are more limited and concentrate near the central built area and along a few linear corridors.
Wetland difference appears in the legend, but no separate percentage is printed in the summary. It would be misleading to reconstruct a missing figure by subtraction and present it as an official wetland-change rate. The same caution applies to “forest loss”: the label only says a cell that was forest at the earlier endpoint received another class in 2025. It does not identify harvest, construction, storm effects, or classification error as the cause.
Reservoir shorelines make scale and classification limits especially important
Annual NLCD is a raster product based on 30-meter square cells. Each cell receives one predominant category even if water, trees, grass, a road, and a building share the same area. Along a reservoir with many coves and narrow shorelines, that generalization can make small inlets, thin land strips, and narrow channels look broader or less continuous than they are on the ground.
The lake color also does not establish shoreline ownership, recreation boundaries, docks, access rights, or current water levels. Lincoln County’s map is useful for seeing the broad relationship between forested land and the reservoir, while detailed lake management or property questions require current information from the appropriate local or reservoir-management authority.
The download includes four original JPG map views
The ZIP contains the 2025 land-cover map, forest-and-farmland map, impervious-surface and developed-land map, and the 1985–2025 land-cover comparison. Starting with the countywide view and adding one focused map for the specific question usually keeps the presentation clear.
Frequently Asked Questions
Why does water cover 17.88% of Lincoln County?
The 2025 map includes the extensive Clarks Hill Lake shoreline and open-water areas along the eastern side of the county. Open water is 17.88%, while wetlands are only 1.62%, so the two water-related classes should be read separately.
Why is developed land 6.09% while mean impervious cover is only 1.15%?
Developed classes can include lawns, trees, yards, and open soil around roads and buildings. Fractional impervious cover isolates roofs, pavement, parking areas, and similar hard surfaces, so its countywide average is much lower than the broader developed share.
Does the 30.10% class difference mean nearly one-third of the county was damaged?
No. It is the share of cells assigned different classes at the 1985 and 2025 endpoints. The summary separately lists 9.57% forest loss, 16.95% other difference, 1.72% agricultural loss, and 1.68% classified to developed. Cause and timing require additional evidence.
Sources and Reference Data
- MRLC Annual NLCD Data – official access to annual land-cover and comparison products
- USGS Annual NLCD Land Cover Classification – definitions for forest, water, agriculture, developed land, and related classes
- U.S. Census Bureau TIGER/Line Shapefiles – authoritative county, place, and transportation layers for comparison
- Lincoln County – Community – official county context on Clarks Hill Lake shoreline and the area’s extensive forest
- City of Lincolnton – official city information and local context for Lincolnton’s proximity to Clarks Hill Lake
Map File Information
The ZIP contains four original JPG maps for comparing Lincoln County's 53.58% forest cover, Clarks Hill Lake water, Lincolnton-area development, impervious surfaces, and 1985–2025 class differences.
- Included Files: Use only the versions confirmed in the article and supplied images
- File Type: Use the confirmed download contents
- Intended Use: Printing, education, presentations, and map-based projects
Related Maps
- Appling County Georgia Land Cover Map
- Atkinson County Georgia Land Cover Map
- Bacon County Georgia Land Cover Map
Green Map creates custom-edited map images using open geographic data sources such as geoBoundaries, Natural Earth, OpenStreetMap, and government open data.
These maps are edited visual materials, not raw data files, and are provided for education, documents, presentations, and graphic reference.