Connecticut is compact, but its residents are not spread evenly across that small area. The strongest concentrations appear along the southwest and central Long Island Sound corridor, especially around Stamford, Norwalk, Bridgeport, and New Haven. A second major cluster surrounds Hartford, with additional dense pockets around Waterbury, the Naugatuck Valley, Norwich, and New London. Northwest Hills and Northeastern Connecticut look very different, with broad areas of much lower density. That contrast is easier to see when tract density, city population, regional population totals, historical change, and regional density are kept as separate measures.
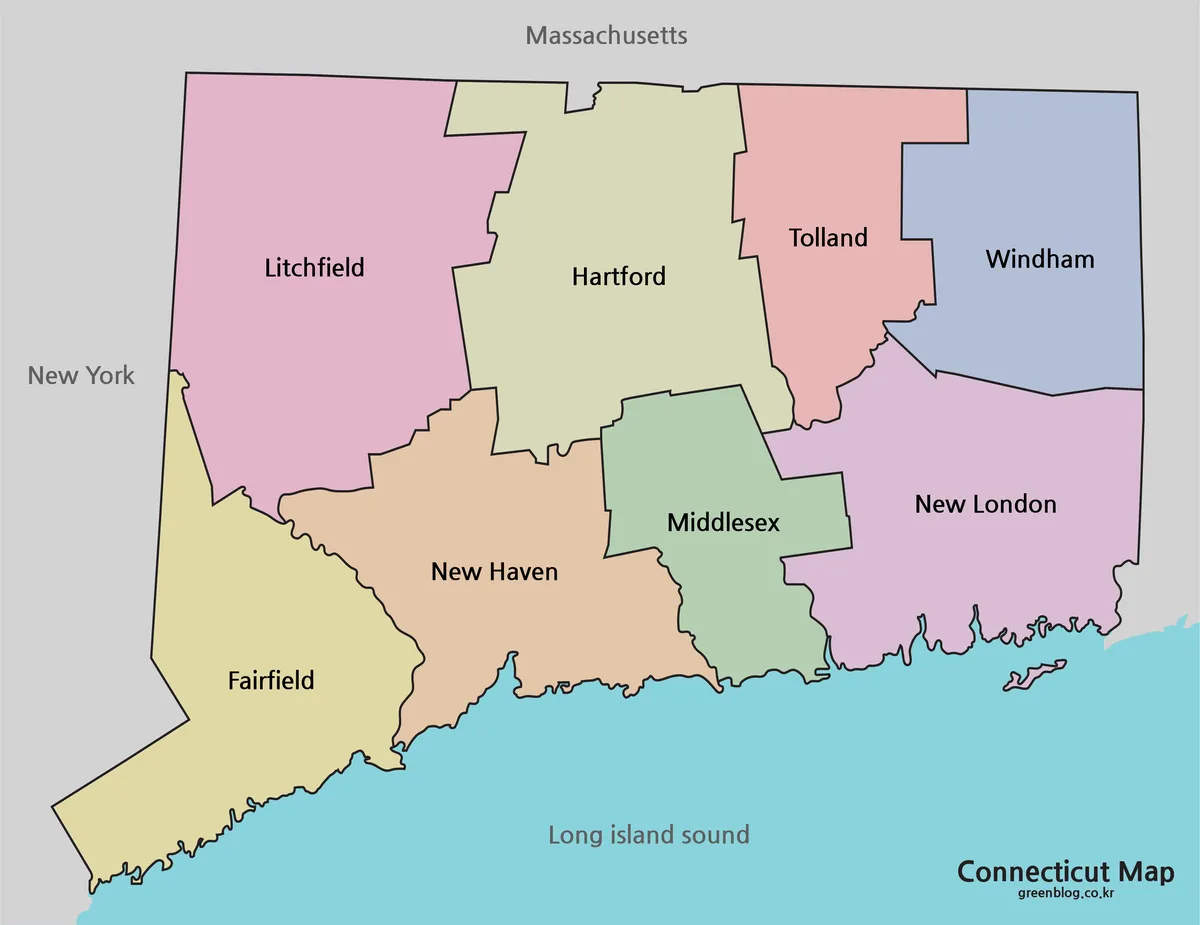
Four maps use 2024 ACS 5-year estimates with 2024 TIGER/Line geography: detailed density, major cities, total population, and population density. The change map is designed around the 2010 and 2020 decennial Censuses. Connecticut also needs a geography note that most states do not: the Census Bureau now uses nine Councils of Governments/planning regions as county-equivalent units instead of the former eight counties. The supplied maps still use “County” in two titles, but the labels and data correspond to those nine current planning regions.
Table of Contents
Tract density traces a southwest coast corridor and a separate Hartford cluster
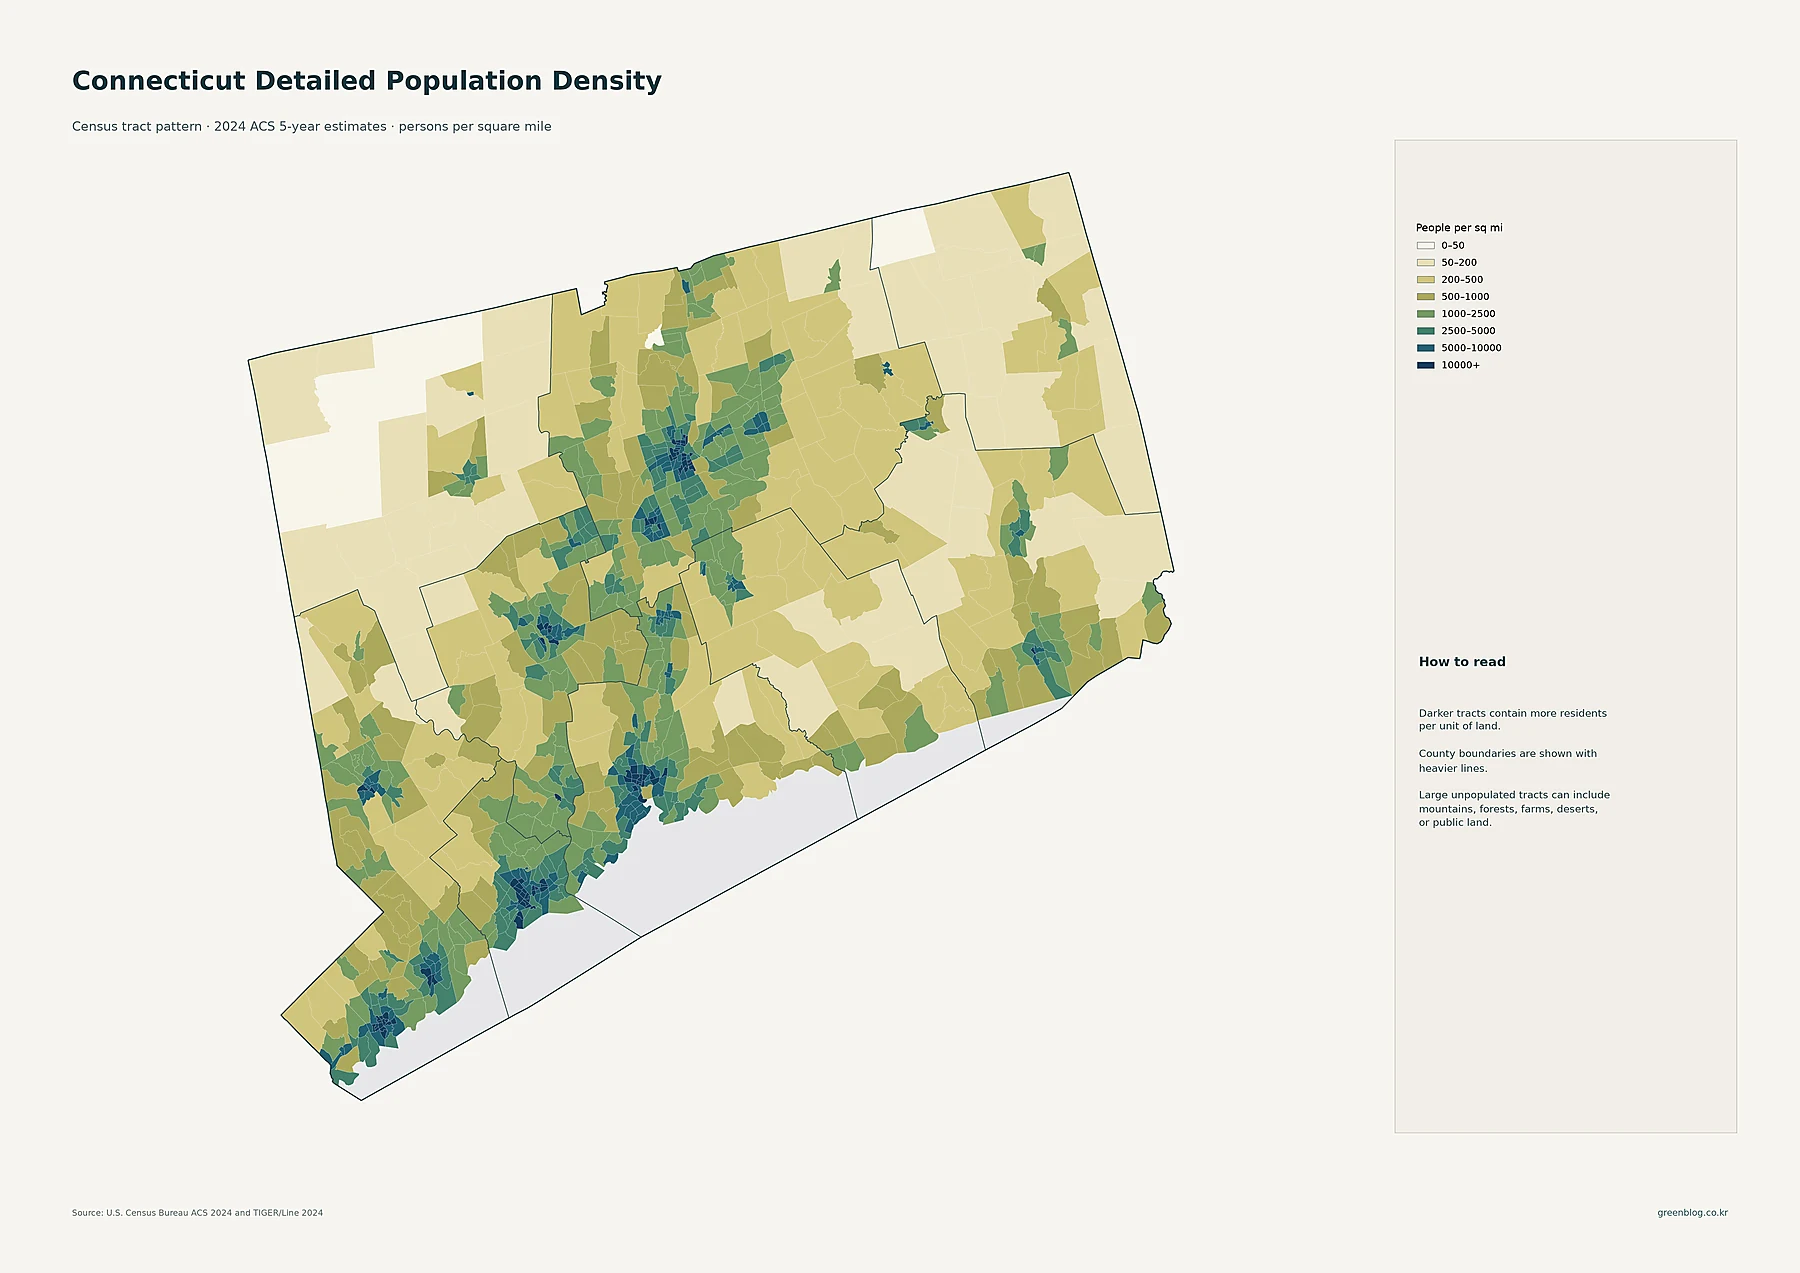
The first map works at the census-tract level and uses eight classes: 0–50, 50–200, 200–500, 500–1,000, 1,000–2,500, 2,500–5,000, 5,000–10,000, and 10,000 or more people per square mile. Dark tracts are especially common in the southwest corner and along the coast toward Bridgeport and New Haven. Several adjoining high-density tracts around Hartford form another obvious concentration farther north. Because tracts are smaller than the planning regions used later, this view reveals compact urban pockets that would disappear inside a single regional average.
Waterbury and the Naugatuck Valley create a visible inland concentration between the southwest coast and Hartford. Smaller dark clusters also appear around Norwich and New London in the east. By contrast, much of Northwest Hills and Northeastern Connecticut is dominated by lighter classes. The map’s own reading note is important: a large light-colored tract can include forests, farms, or other lightly settled land, so low average density does not mean that no one lives there. The map is best read as concentration per unit of land.
Bridgeport leads the place ranking, while the urban pattern has several centers
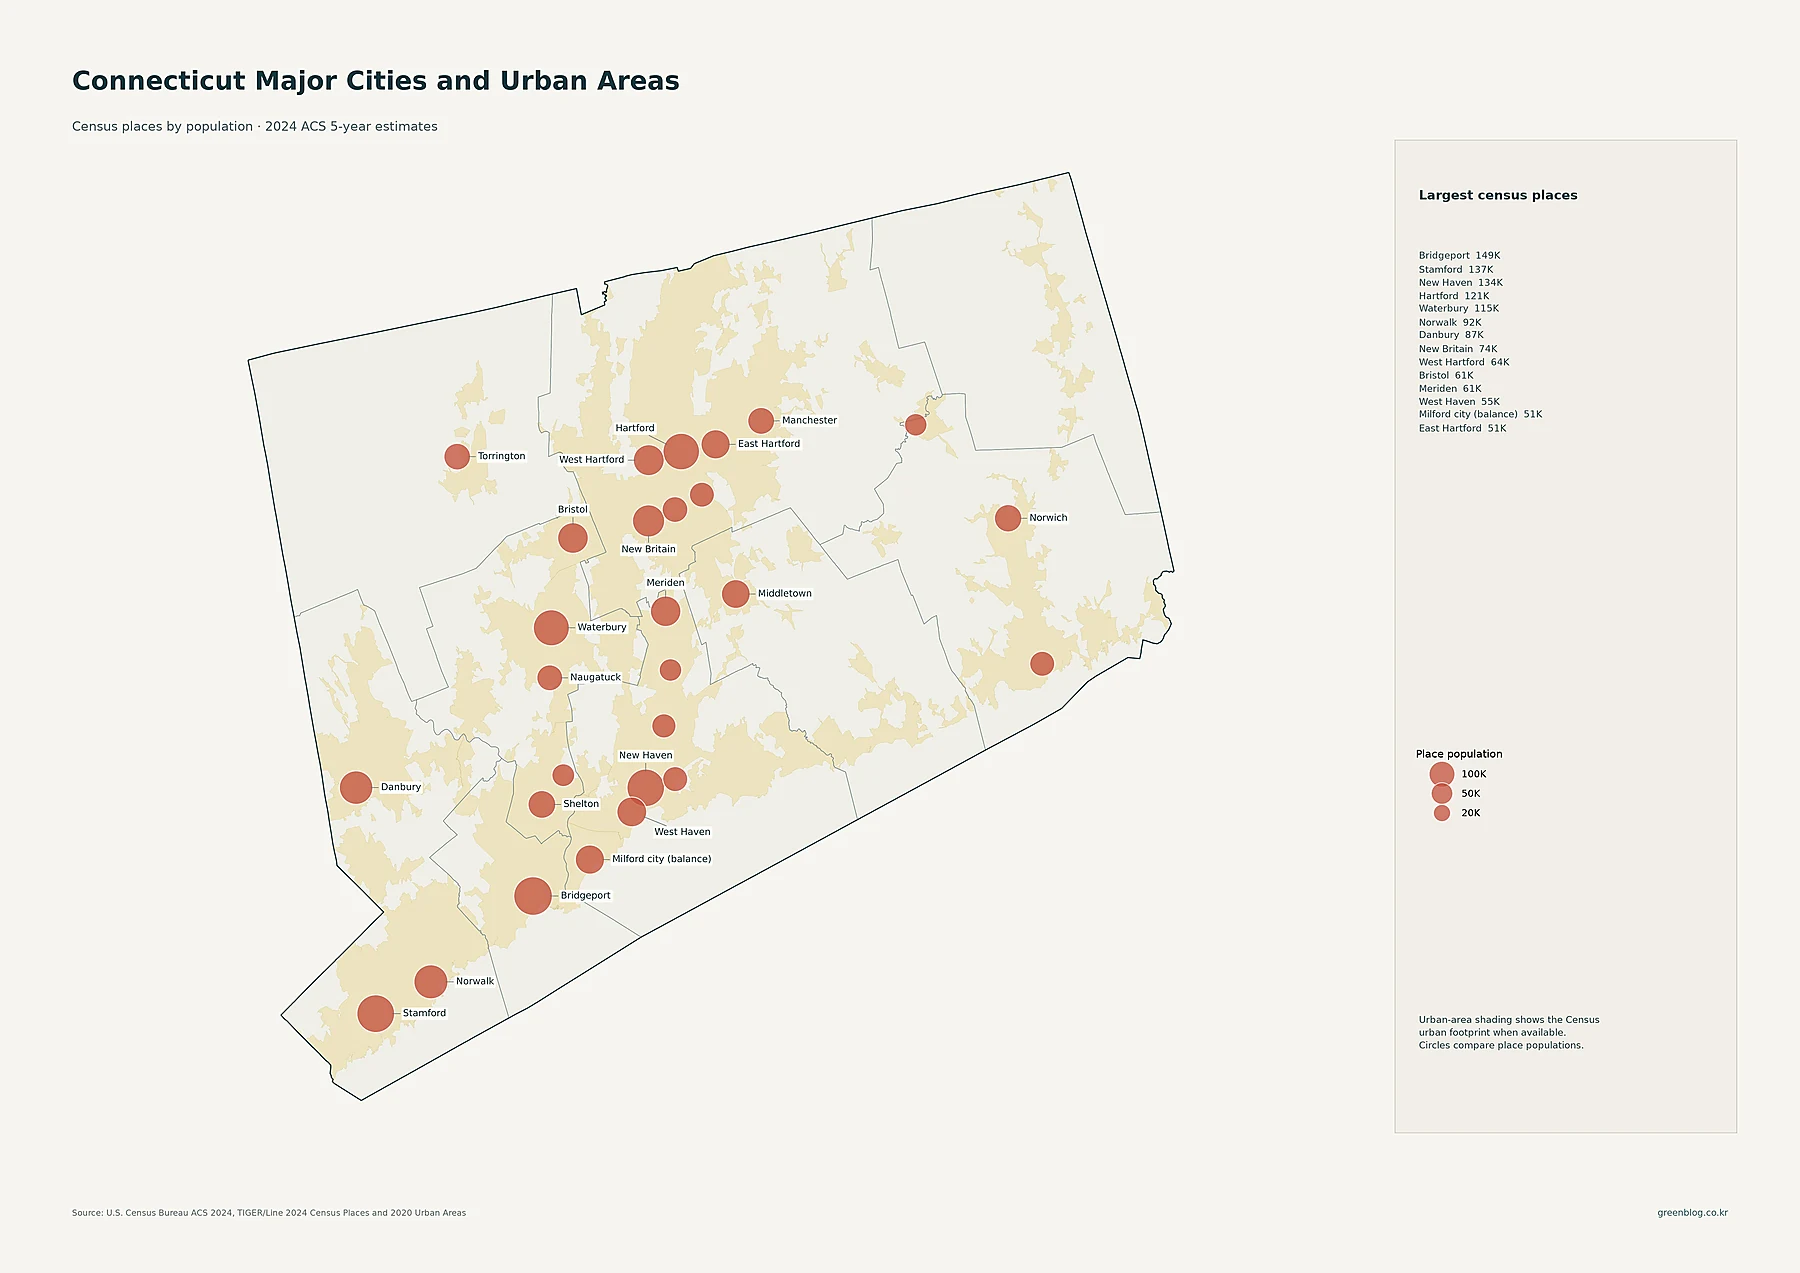
The city map switches from density to total population of individual census places. Bridgeport is the largest listed place at 149,153 residents, followed by Stamford at 137,144, New Haven at 134,349, Hartford at 121,127, and Waterbury at 114,869. Norwalk has 92,187, Danbury 87,263, New Britain 74,223, West Hartford 63,620, and Bristol 61,462. These circles reinforce the same broad geography seen in the tract map: large population centers are repeatedly concentrated in the southwest, along the south-central coast, and around Hartford.
Circle size is not a density measure. It represents the total population of a place, while the light background indicates available Census urban-area footprints. A city can have a large circle because it has many residents without being the most densely settled place per square mile. Likewise, a smaller place can be compact and relatively dense. The city map answers “how many people live in this census place?” rather than “how tightly are those people packed into the land?”
The current county-equivalent comparison is really a nine-region comparison
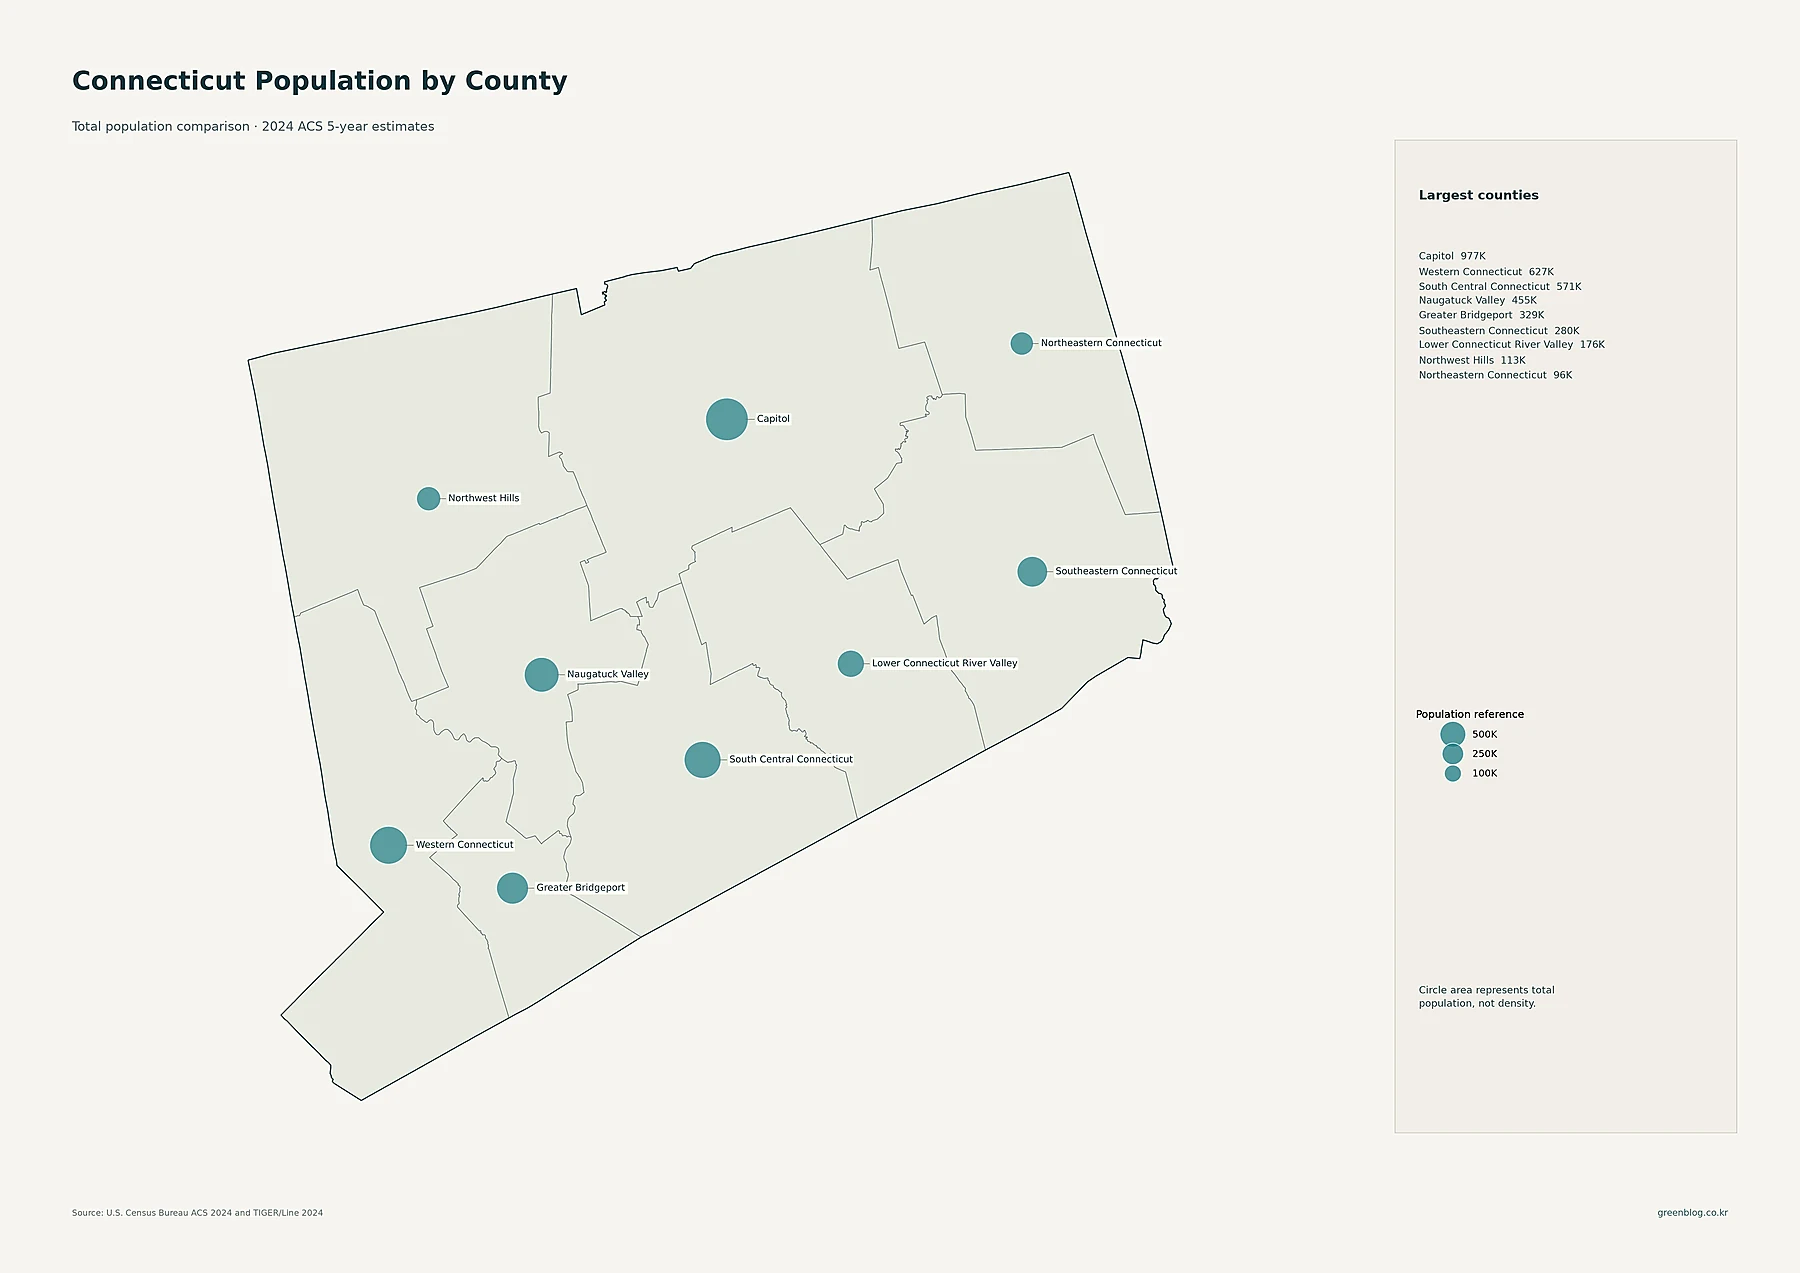
The Census Bureau began using Connecticut’s nine COGs/planning regions as county-equivalent statistical units in 2022. That means Capitol, Western Connecticut, South Central Connecticut, and the other labels on this map are not the former eight county names. In the supplied 2024 ACS data, Capitol is the largest region with 977,290 residents. Western Connecticut follows with 627,071, South Central Connecticut with 570,598, Naugatuck Valley with 454,969, and Greater Bridgeport with 329,259.
| Planning region | 2024 ACS population | People per sq. mi. |
|---|---|---|
| Capitol | 977,290 | 951.3 |
| Western Connecticut | 627,071 | 1,178.4 |
| South Central Connecticut | 570,598 | 1,553.7 |
| Naugatuck Valley | 454,969 | 1,102.2 |
| Greater Bridgeport | 329,259 | 2,348.8 |
| Southeastern Connecticut | 279,971 | 468.1 |
| Lower Connecticut River Valley | 175,822 | 414.6 |
| Northwest Hills | 113,216 | 143.9 |
| Northeastern Connecticut | 96,312 | 173.9 |
The table shows why total population and density need separate maps. Capitol contains the most residents, but its average density is about 951.3 people per square mile. Greater Bridgeport contains roughly one-third as many people, yet it has the highest regional density at about 2,348.8. South Central Connecticut is also very dense at about 1,553.7. At the other end, Northwest Hills averages about 143.9 and Northeastern Connecticut about 173.9 people per square mile. A large proportional circle therefore does not automatically identify the densest region.
The 2010–2020 map does not supply valid change rates for the current nine regions
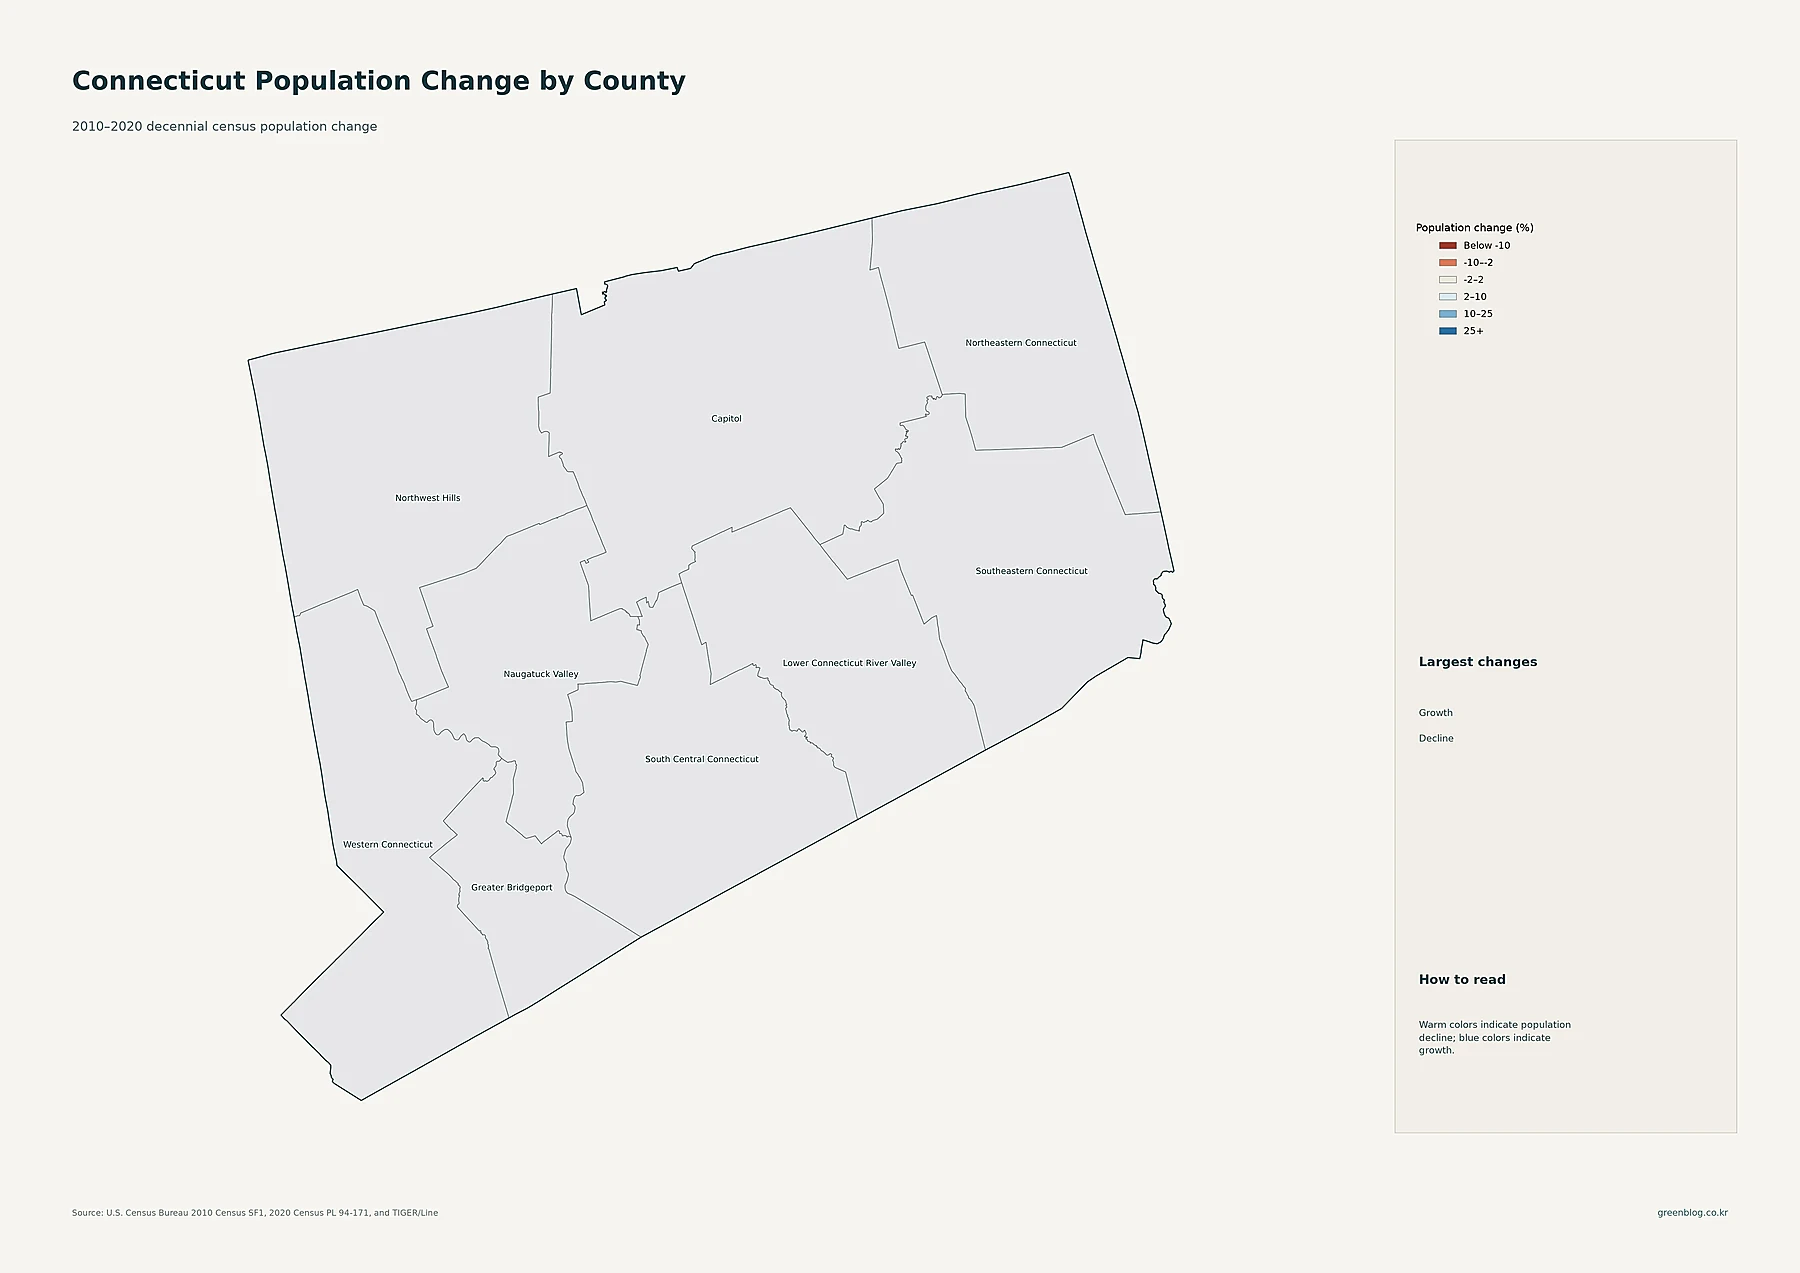
This fourth map deserves a different reading from the change maps for states with stable county geography. Its legend is prepared for 2010–2020 decennial Census change, ranging from losses below -10% through gains of 25% or more. Yet all nine Connecticut regions remain unclassified in a neutral shade. The “Largest changes” area lists no growth or decline entries, and the supplied CSV leaves population_2010, population_2020, and population_change blank for every current planning region. There is therefore no evidence in this package for assigning a positive or negative rate to any of the nine regions.
The geography change explains why caution is necessary. The Census Bureau notes that the nine planning regions became Connecticut’s county-equivalent geography beginning with 2022-era products, replacing the former eight counties for current statistical tabulation. The 2010 and 2020 decennial Censuses used the older county framework. Directly attaching old county change rates to the new regions would compare different boundaries. A valid historical comparison would require data re-tabulated to a common geography or an official crosswalk-based method; the supplied map does not provide that conversion, so leaving the change rate unstated is the accurate choice.
Regional density puts Greater Bridgeport far above the northwest and northeast
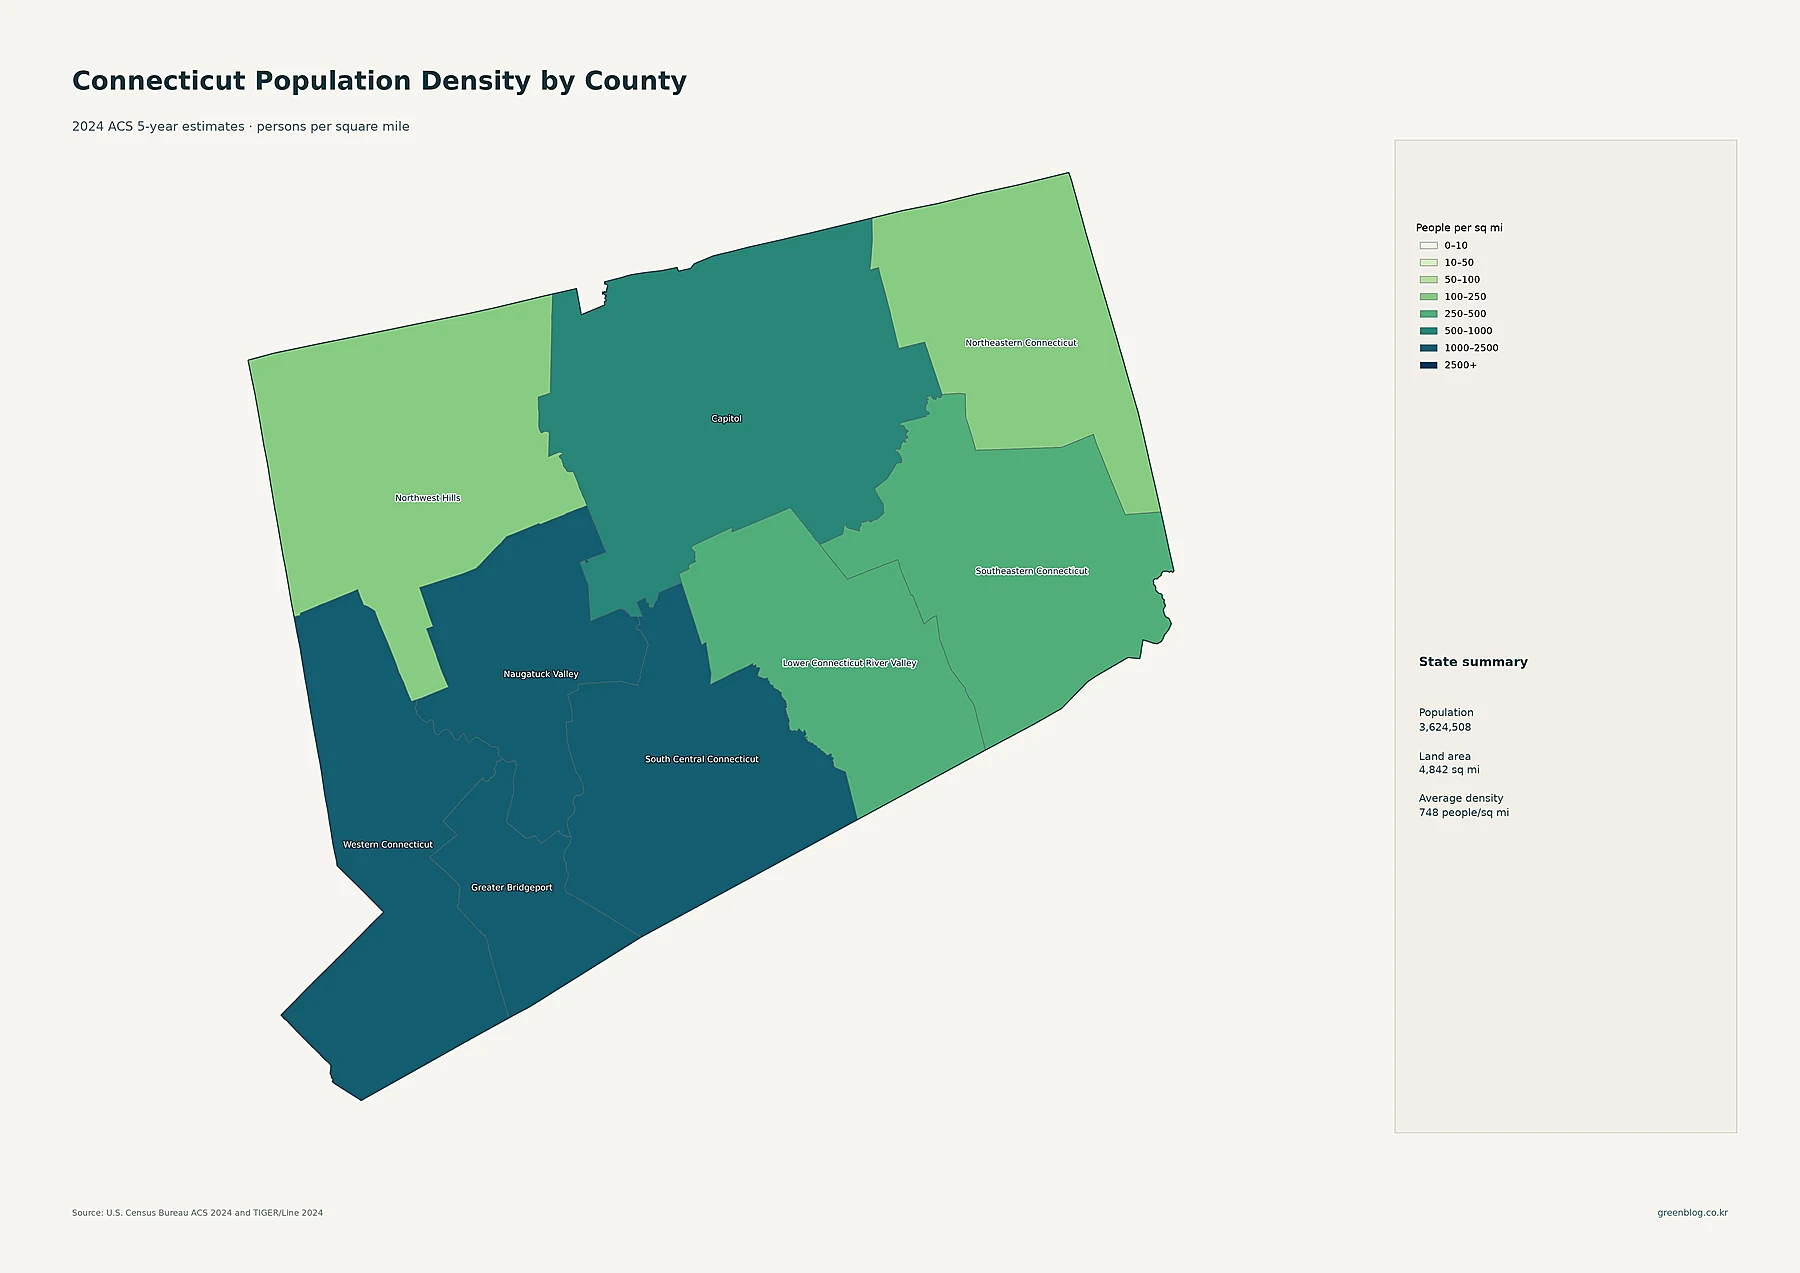
The final map returns to density, this time averaging population across each planning region. Greater Bridgeport is the darkest and densest at about 2,348.8 people per square mile. South Central Connecticut averages about 1,553.7, Western Connecticut about 1,178.4, and Naugatuck Valley about 1,102.2. Capitol, despite having the largest total population, averages about 951.3. The darker southwest and south-central regions line up with the many dense tracts and large city circles seen earlier.
Northwest Hills and Northeastern Connecticut sit at the opposite end of the scale, at about 143.9 and 173.9 people per square mile. Southeastern Connecticut is about 468.1, while Lower Connecticut River Valley is about 414.6. The state summary reports 3,624,508 residents, 4,842 square miles of land, and an average density of roughly 748 people per square mile. That statewide average is a useful benchmark, but it is not a typical local density: it combines regions above 2,000 per square mile with regions below 200.
A reliable way to read the Connecticut map set
- Use tract density to locate the actual dense pockets along the southwest coast, around New Haven and Hartford, and in smaller eastern centers.
- Use city circles to compare total census-place populations such as Bridgeport, Stamford, New Haven, Hartford, and Waterbury.
- Use regional population circles to see that Capitol contains the most residents without treating the circle as a density symbol.
- Treat the 2010–2020 change map as unavailable for current-region rates because the supplied current planning-region fields contain no historical comparison values.
- Use regional density to compare Greater Bridgeport and South Central Connecticut with the much less dense Northwest Hills and Northeastern Connecticut.
Taken together, the maps show that Connecticut’s small geographic size does not produce a uniform settlement pattern. Dense urban tracts and many of the largest places cluster along the southwest and south-central coast and around Hartford, while the northwest and northeast remain much less dense on average. The state’s switch to nine planning-region county equivalents also makes time-series interpretation more complicated than a simple “county change” label suggests. Keeping current population totals, current density, city size, and historical geography separate produces a more accurate picture than forcing every map into one ranking.
Download the Connecticut population map collection
Connecticut population and density map set
The collection includes detailed census-tract density, major cities and urban areas, current planning-region population totals, the supplied 2010–2020 change map, and planning-region population density.
Frequently asked questions
Which Connecticut planning region has the highest population density?
Greater Bridgeport ranks first in the supplied 2024 ACS-based dataset at approximately 2,348.8 people per square mile. South Central Connecticut follows at about 1,553.7, with Western Connecticut at about 1,178.4.
Why does Capitol have the largest population circle but not the highest density?
The population map uses circle area for total residents. Capitol contains about 977,290 people, the largest regional total, but those residents are spread across enough land to produce an average density of about 951.3 people per square mile. Greater Bridgeport has fewer residents but a much higher density because its population is concentrated in a smaller area.
Can the supplied map show 2010–2020 change for the current nine planning regions?
No valid region-level rates are provided in this package. The current nine planning regions became Census county-equivalent units after the 2020 Census, and the supplied historical fields are blank. It would be misleading to invent rates or copy old eight-county changes onto the new regional boundaries.
Related Maps
Sources
- U.S. Census Bureau — 2020–2024 American Community Survey 5-Year Estimates
- U.S. Census Bureau — 2024 TIGER/Line Shapefiles
- U.S. Census Bureau — Change to County-Equivalents in the State of Connecticut
- U.S. Census Bureau — 2010 Census data resources
- U.S. Census Bureau — 2020 Census Redistricting Data (P.L. 94-171)
Values and map interpretations above come from the supplied project CSV/JSON files and the U.S. Census Bureau sources printed on the maps. ACS figures are survey-based 5-year estimates. Current Connecticut county-equivalent statistics use the nine planning regions, so historical 2010–2020 comparisons should only be made when values have been placed on a consistent geography.
Green Map creates custom-edited map images using open geographic data sources such as geoBoundaries, Natural Earth, OpenStreetMap, and government open data.
These maps are edited visual materials, not raw data files, and are provided for education, documents, presentations, and graphic reference.