Manatee County has a strong west-to-east land-cover contrast. Agriculture is the largest 2025 class at 34.17%, wetlands account for 26.55%, and developed land reaches 24.87%. The western part contains broad developed areas and major water features, while agriculture and wetlands occupy much more of the eastern interior.
This page includes four independent views: 2025 land cover, forest and farmland, impervious surface, and a 1985–2025 class comparison. The WebP previews are designed for browser viewing, while the four original 2480×1754 JPG maps are bundled in one ZIP download below. They are useful for comparing the coastal urban footprint with inland agriculture, wetlands, and mapped class differences.
Table of Contents
Hard surfaces form a broad western concentration
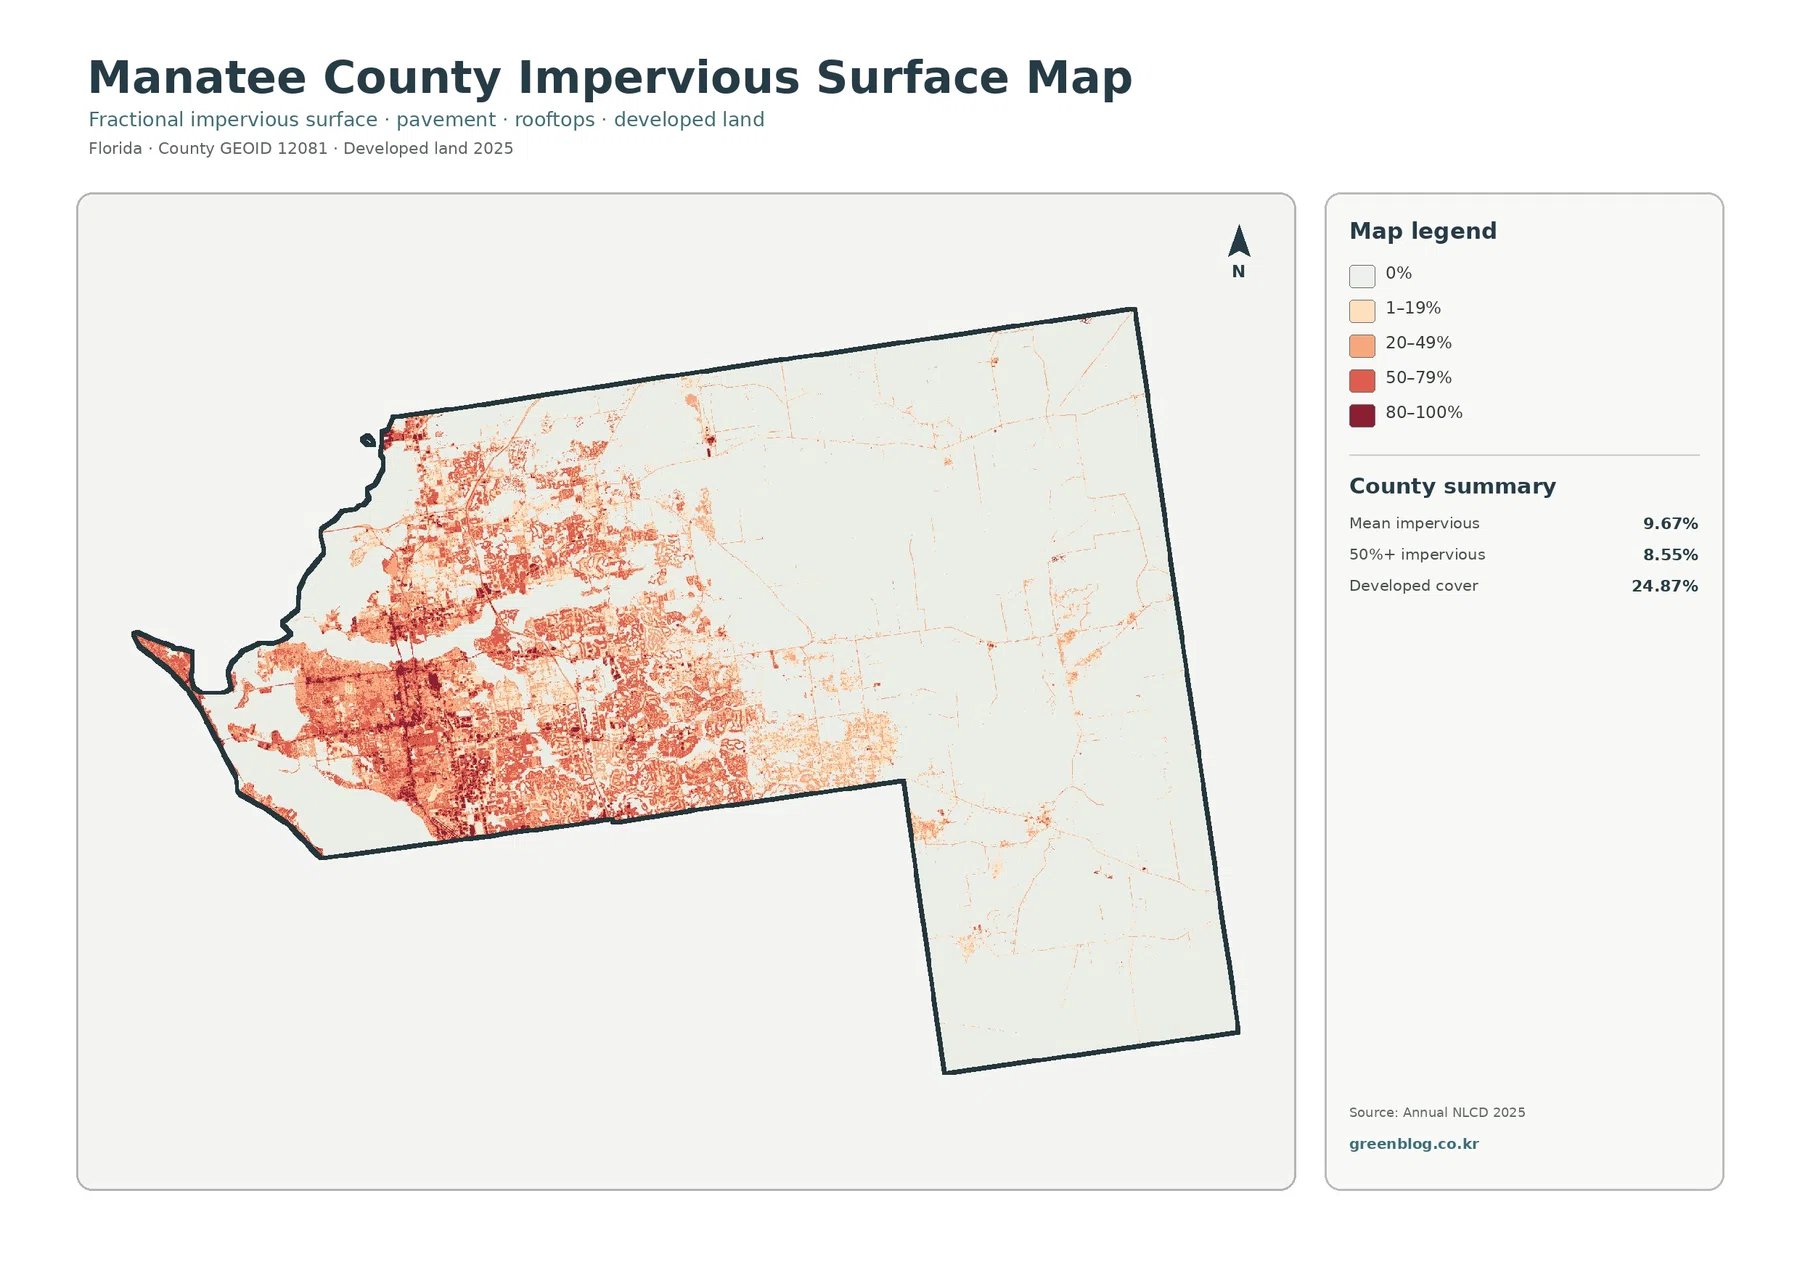
Impervious surface refers to hard cover such as pavement, parking areas, and rooftops that does not readily absorb rainfall. Manatee County’s mean impervious value is 9.67%, and 8.55% of the county is mapped at 50% or greater imperviousness. Those figures are lower than the 24.87% developed-land share because developed classes can also include lawns, trees, bare soil, and other permeable surfaces.
The darkest values form a broad concentration across the west and southwest, with another substantial cluster toward the northwest. Thin lines and smaller nodes continue eastward along transportation corridors, but most of the eastern and southeastern county remains very pale. The contrast between the developed west and rural east is immediately visible.
The pattern agrees with the general land-cover map, where red developed cover is heavily weighted toward the west. The impervious layer adds detail by showing which parts of that footprint contain the highest proportion of hard surface. It does not identify zoning, property ownership, building permits, or legal development rights.
High impervious values should not be treated as a flood-risk map. Drainage and flooding depend on elevation, rainfall, soils, waterways, coastal conditions, and stormwater infrastructure as well as pavement and rooftops. This layer is most useful for locating concentrations of hard surface and comparing them with nearby wetlands and water.
Agriculture leads the 2025 summary while wetlands remain a major inland class
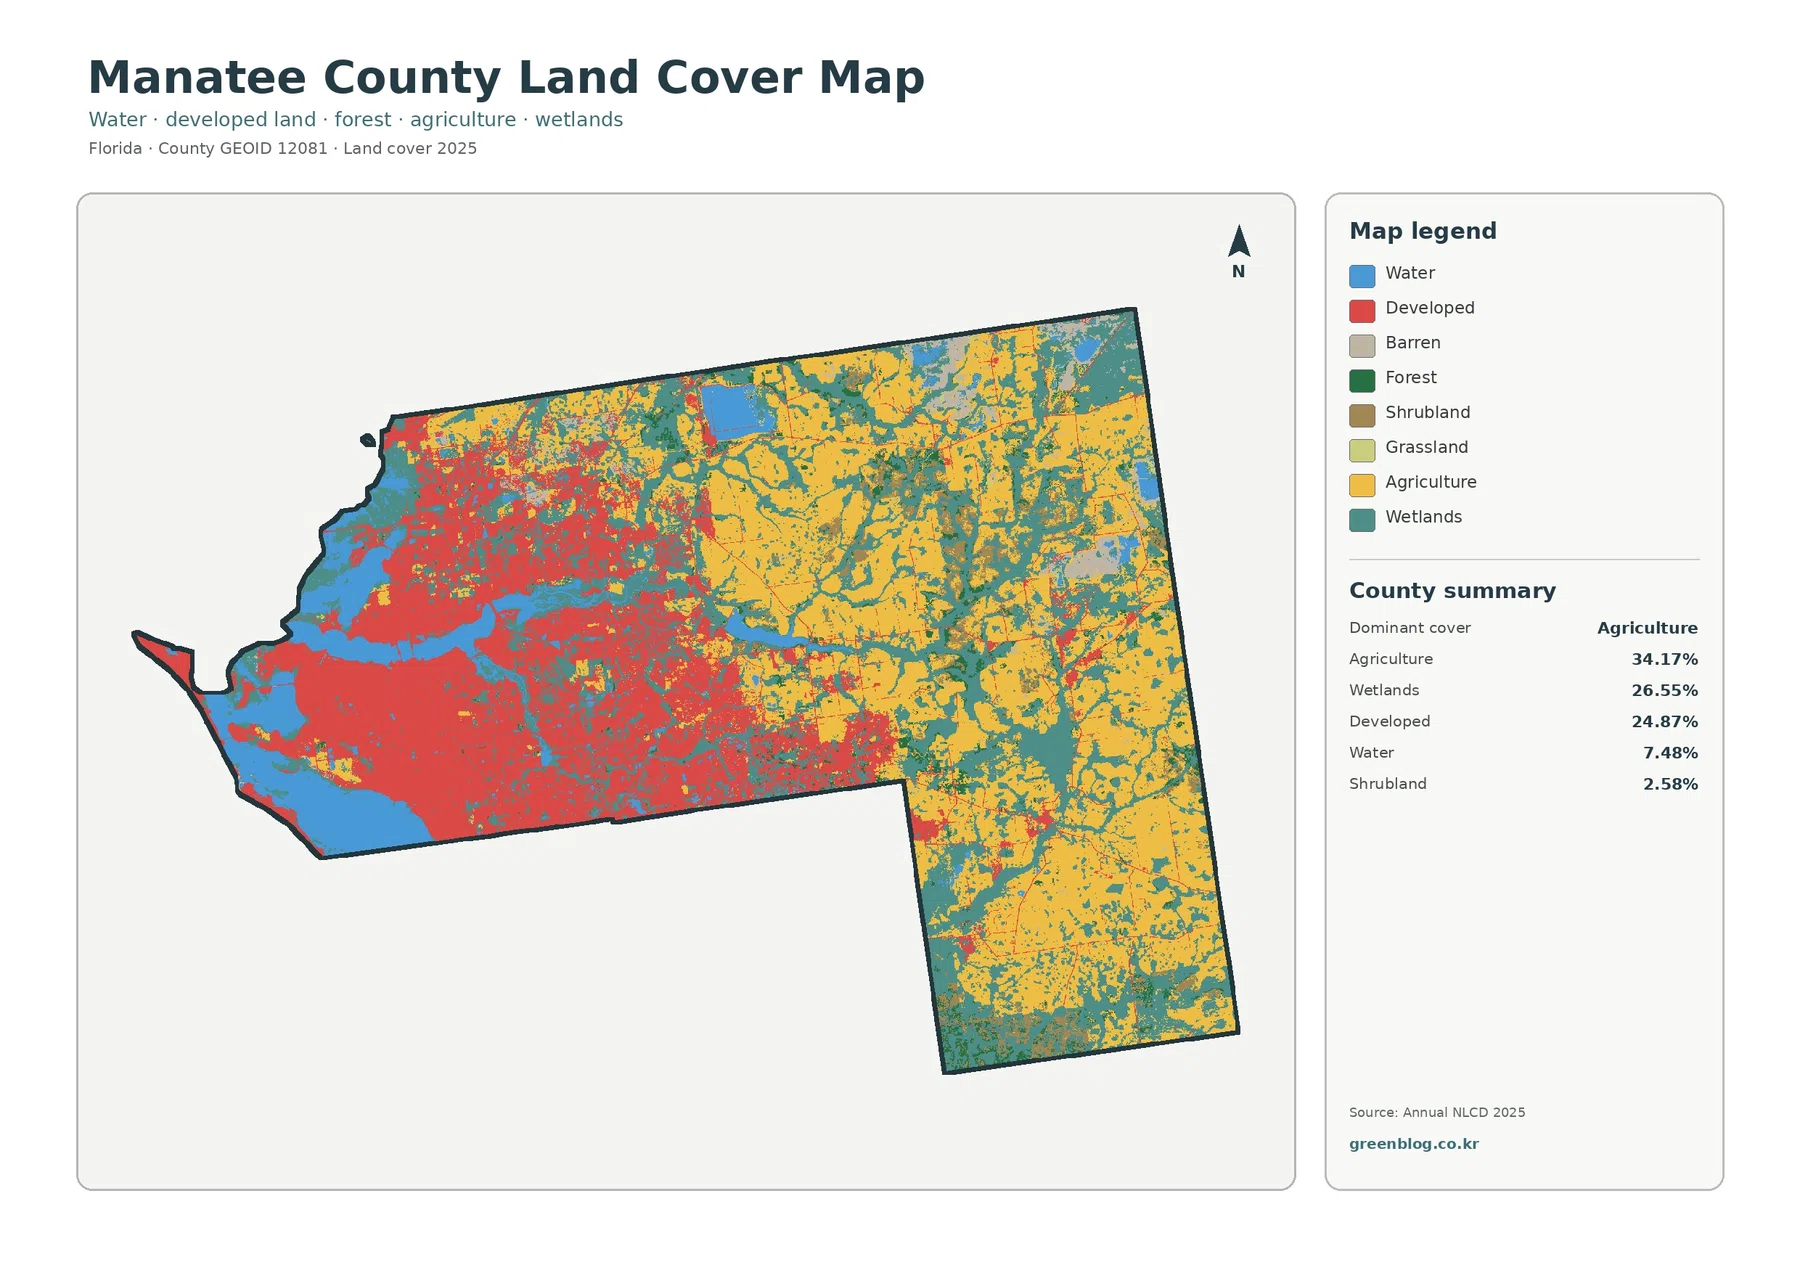
Agriculture is the largest 2025 category at 34.17%. Large yellow blocks dominate much of the east, northeast, and southeast, with additional agricultural land through the central county. The western third looks very different because developed cover and water take up much more space.
Wetlands account for 26.55% and run through much of the eastern agricultural landscape. Teal areas interrupt farm blocks in broad bands and irregular patches, especially in the southeast and northeast. Smaller wetlands also remain within and around the developed west, making the inland county a mixed agricultural-wetland landscape rather than one continuous farm area.
Developed land reaches 24.87%, almost one quarter of the county. Most of that red cover is concentrated in the west and southwest, with additional development spreading toward the center. Because the western footprint is visually dense, it can appear larger than the countywide percentage suggests, but agriculture still ranks first.
Water accounts for 7.48%. Blue areas are broad along the western side and around river, bay, and coastal settings, with smaller inland features to the east. Manatee County Natural Resources identifies Emerson Point Preserve at the west end of Snead Island on the north shore of the Manatee River, with Terra Ceia Bay to the north, providing verified context for the western water landscape.
Shrubland accounts for 2.58%, forest for 2.42%, and grassland for 0.20%. These smaller classes are scattered mainly through the eastern half among agriculture and wetlands. The original JPG is more useful than the reduced preview when a project needs to inspect narrow or fragmented patches.
The forest-and-farmland view emphasizes the eastern working landscape
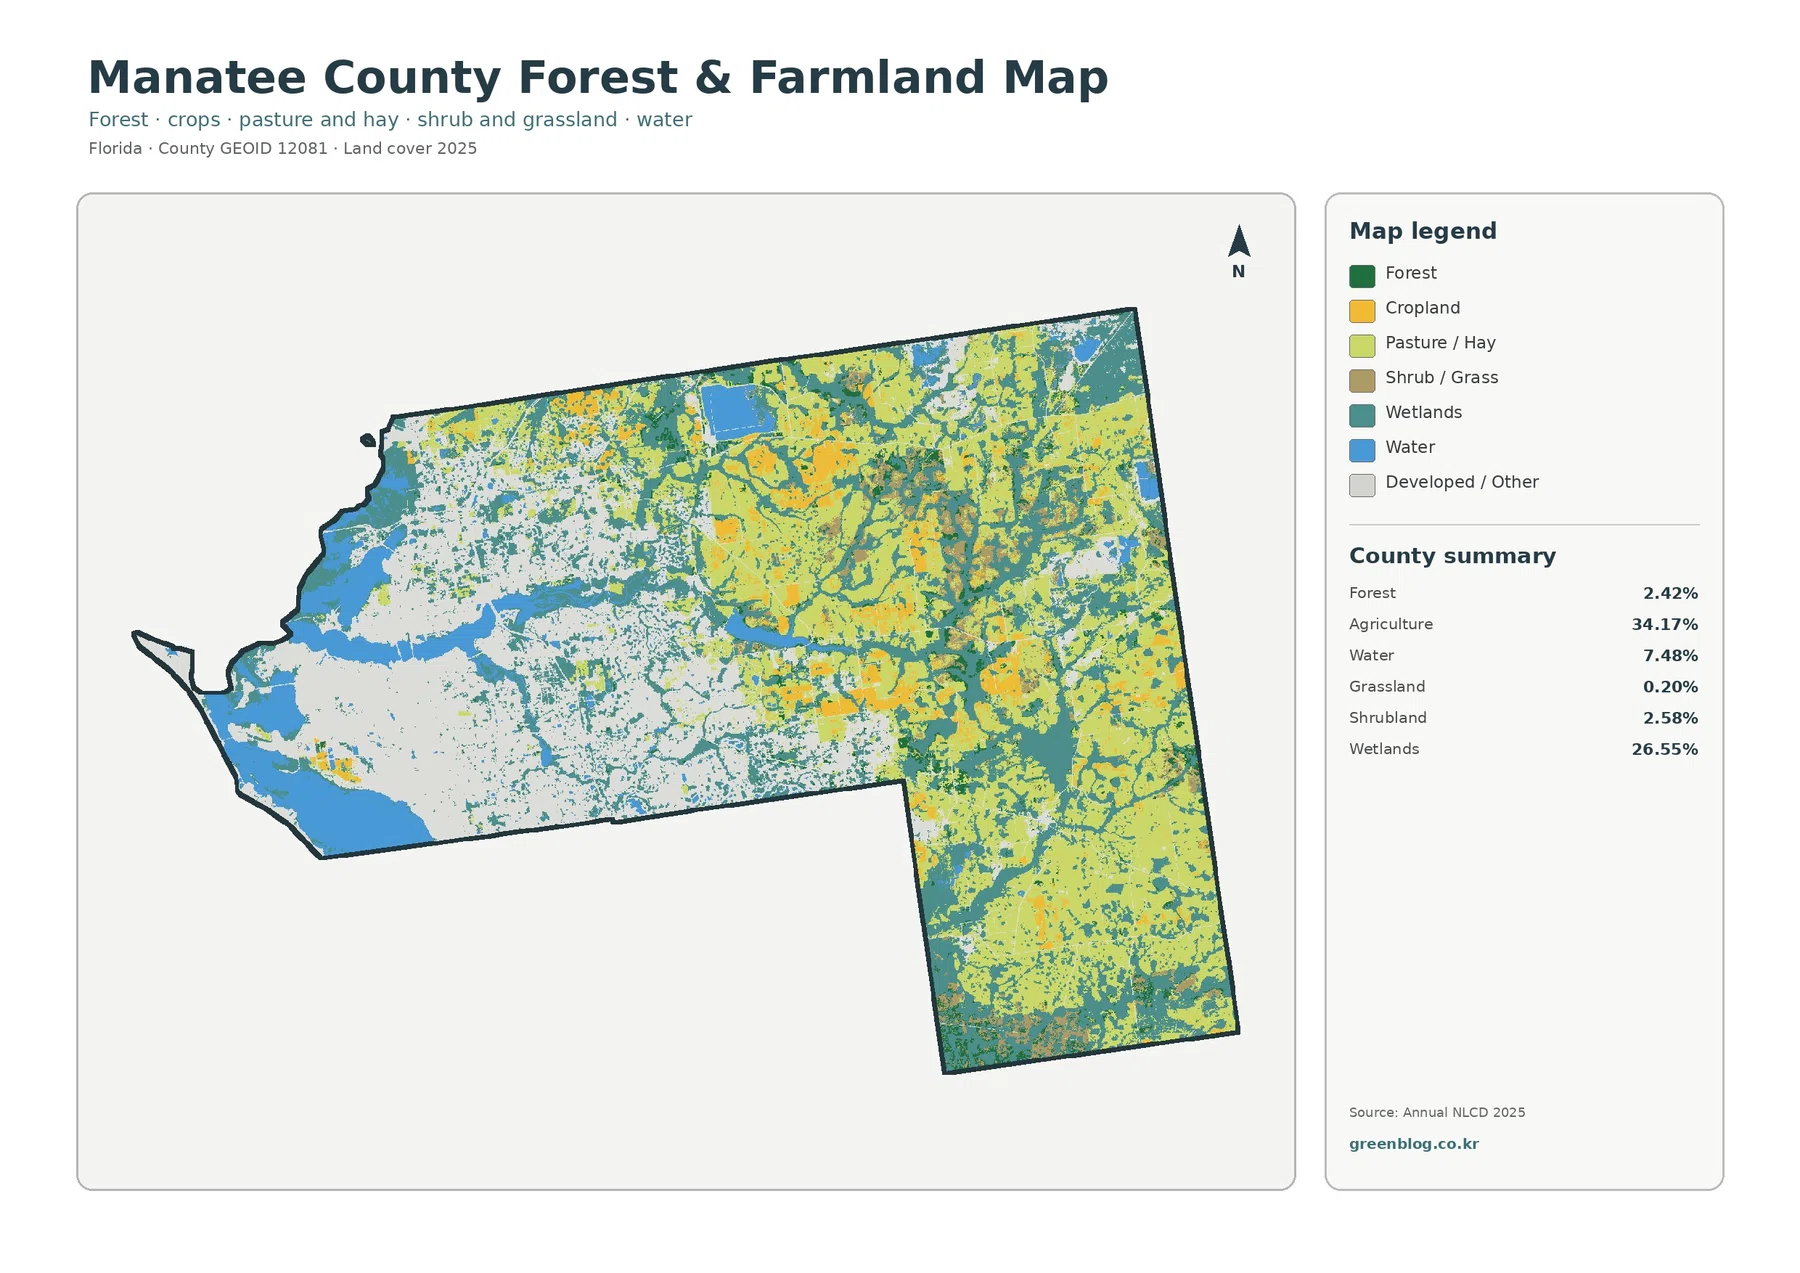
When developed and miscellaneous cover are reduced to a light background, the county’s eastern agricultural pattern becomes much easier to follow. Yellow agricultural areas dominate large parts of the northeast, east, and southeast. Wetlands remain extensive between them, while the western urban area becomes a broad pale zone beside blue water.
UF/IFAS Extension Manatee County provides agriculture and natural-resources programming. Its vegetable and row-crop information describes local production of tomatoes, snap beans, watermelons, cucumbers, potatoes, and other crops. That verified agricultural context helps explain why agriculture is such a prominent county topic, but the land-cover map does not identify individual crops or farm ownership.
Forest is only 2.42% in the summary, yet dark-green patches still occur through the east and northeast. Manatee County Natural Resources identifies Duette Preserve as the county’s largest preserve at more than 21,000 acres. The preserve provides useful inland context, although the mapped forest class should not be interpreted as the preserve boundary.
Wetlands are nearly as important as agriculture in many eastern sections. Large teal patches repeatedly divide or border farm blocks, especially toward the southeast. For classroom or environmental comparison, this view makes it easier to discuss how working land and wet areas occur side by side without suggesting that one class causes the other.
The 1985–2025 comparison contains a large developed transition
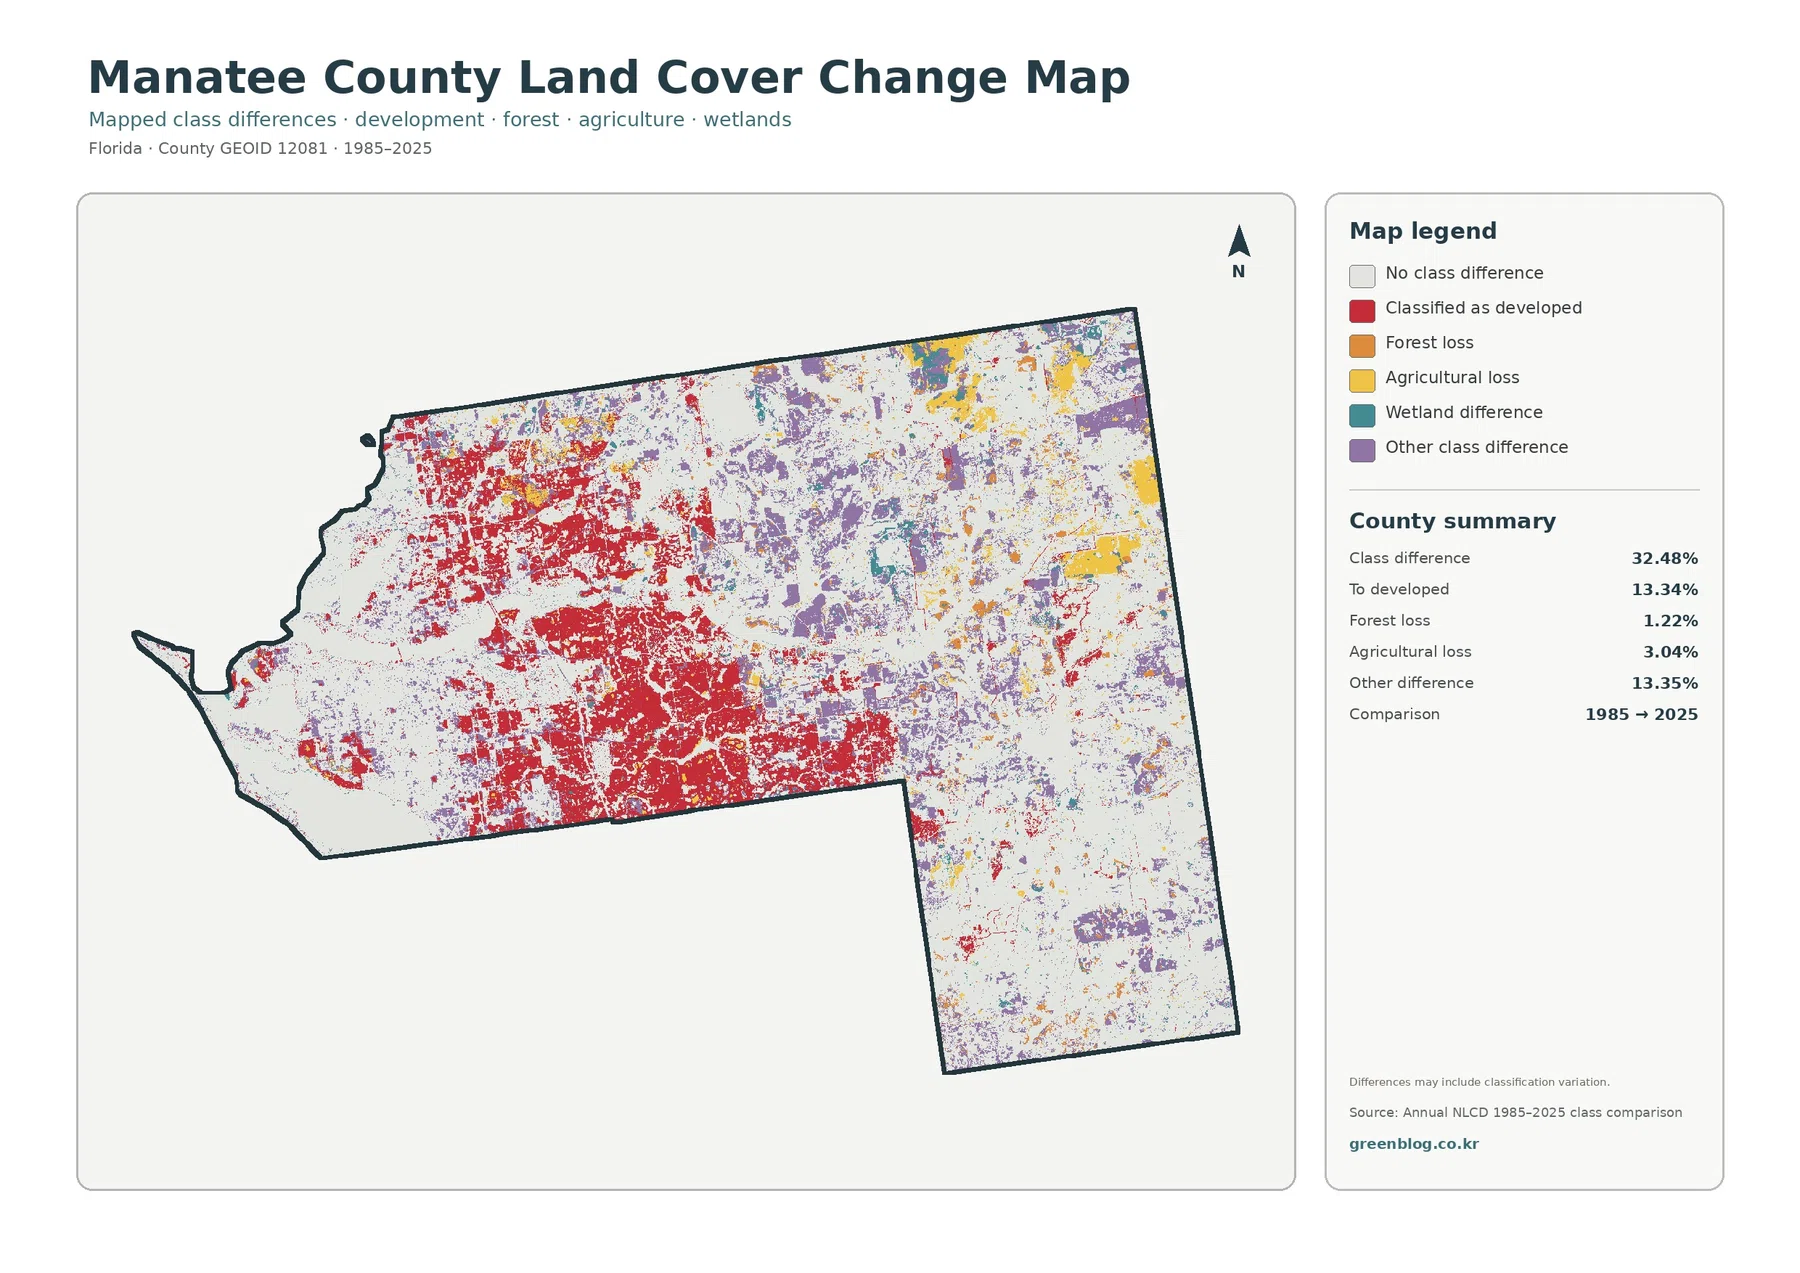
The comparison reports class differences across 32.48% of Manatee County. Transition to developed is 13.34%, forest loss 1.22%, agricultural loss 3.04%, and other class difference 13.35%. The largest concentrations of change color occur in the west and central county, with additional patches throughout the eastern interior.
Red developed transitions are especially prominent across the current western development footprint and extend into parts of the center. The east contains more purple other-class differences and scattered yellow agricultural-loss areas. The comparison therefore cannot be summarized only as urban expansion, even though developed transition is a major component.
A note on the map warns that the differences may include classification variation. The 32.48% figure should not be treated as an exact physical land-change rate. Different imagery, mixed raster cells, seasonal conditions, and classification methods can assign a different class to the same location.
Only the 1985 and 2025 endpoints are compared. The map does not show the sequence of changes during the forty years between them. Aerial photographs and additional Annual NLCD years are more appropriate for confirming a specific transition or building a detailed local history.
The Gulf-side urban landscape and eastern agriculture belong in the same county story
Manatee County Natural Resources provides useful reference points for the broader pattern. Emerson Point Preserve sits between the Manatee River and Terra Ceia Bay in the west, while Duette Preserve, the county’s largest preserve, is inland. These official locations help connect the map’s strong west-east contrast to real county geography without turning the land-cover layer into a preserve-boundary map.
A practical classroom sequence is to begin with the general land-cover map and compare agriculture, wetlands, developed land, and water. The forest-and-farmland view then clarifies the inland agricultural pattern. The impervious map reveals how strongly hard surfaces are concentrated in the west, and the change map identifies places where the 1985 and 2025 classifications differ.
Land cover answers a physical surface question: whether an area is classified as agriculture, wetland, developed land, forest, water, or another class. It does not answer who owns the land, how a parcel is zoned, where a surveyed property line lies, or whether development is permitted. Those decisions require separate county planning and property records.
The download ZIP contains four original JPG maps at 2480×1754 pixels: 2025 land cover, forest and farmland, impervious/developed land, and the 1985–2025 class comparison. The original files are easier than the WebP previews for enlarging legends, checking small class patches, and placing maps into documents or presentations.
Annual NLCD products are raster datasets, so the county is represented as a grid of cells. A cell receives a representative class or impervious value even though the real ground may contain multiple surfaces. The colored edges are generalized land-cover boundaries rather than surveyed parcel lines.
Frequently Asked Questions
What is the largest 2025 land-cover category in Manatee County?
Agriculture is the largest category at 34.17%. Wetlands follow at 26.55%, and developed land accounts for 24.87%. Agriculture and wetlands dominate much of the east, while developed land and water are far more prominent in the west.
Why is developed land 24.87% while mean impervious cover is 9.67%?
The measures describe different things. Developed land can include buildings and roads along with lawns, trees, and bare ground. Impervious cover measures hard surfaces such as pavement and rooftops more directly, so its countywide average is lower.
Does the 32.48% 1985–2025 class difference equal the true land-change rate?
No. The map notes that classification variation may be included. Important locations should be checked with aerial imagery, additional land-cover years, or other official records before a class difference is treated as a confirmed physical change.
Map File Information
Download the four original Manatee County land-cover JPG maps together in one ZIP file.
- Included Files: Use only the versions confirmed in the article and supplied images
- File Type: Use the confirmed download contents
- Intended Use: Printing, education, presentations, and map-based projects
Related Maps
- Alachua County Florida Land Cover Map
- Baker County Florida Land Cover Map
- Bay County Florida Land Cover Map
Sources and References
- MRLC Annual NLCD Data – Official source for Annual NLCD land-cover data.
- USGS Annual NLCD Land Cover Classification – Describes the principal Annual NLCD land-cover classes.
- U.S. Census Bureau TIGER/Line Shapefiles – Official geographic boundary data for county reference.
- Manatee County Natural Resources Department – Official information on Duette Preserve, Emerson Point Preserve, and county natural-resource sites.
- UF/IFAS Extension Manatee County – Vegetable & Row Crops – Local agricultural information for Manatee County.
Green Map creates custom-edited map images using open geographic data sources such as geoBoundaries, Natural Earth, OpenStreetMap, and government open data.
These maps are edited visual materials, not raw data files, and are provided for education, documents, presentations, and graphic reference.