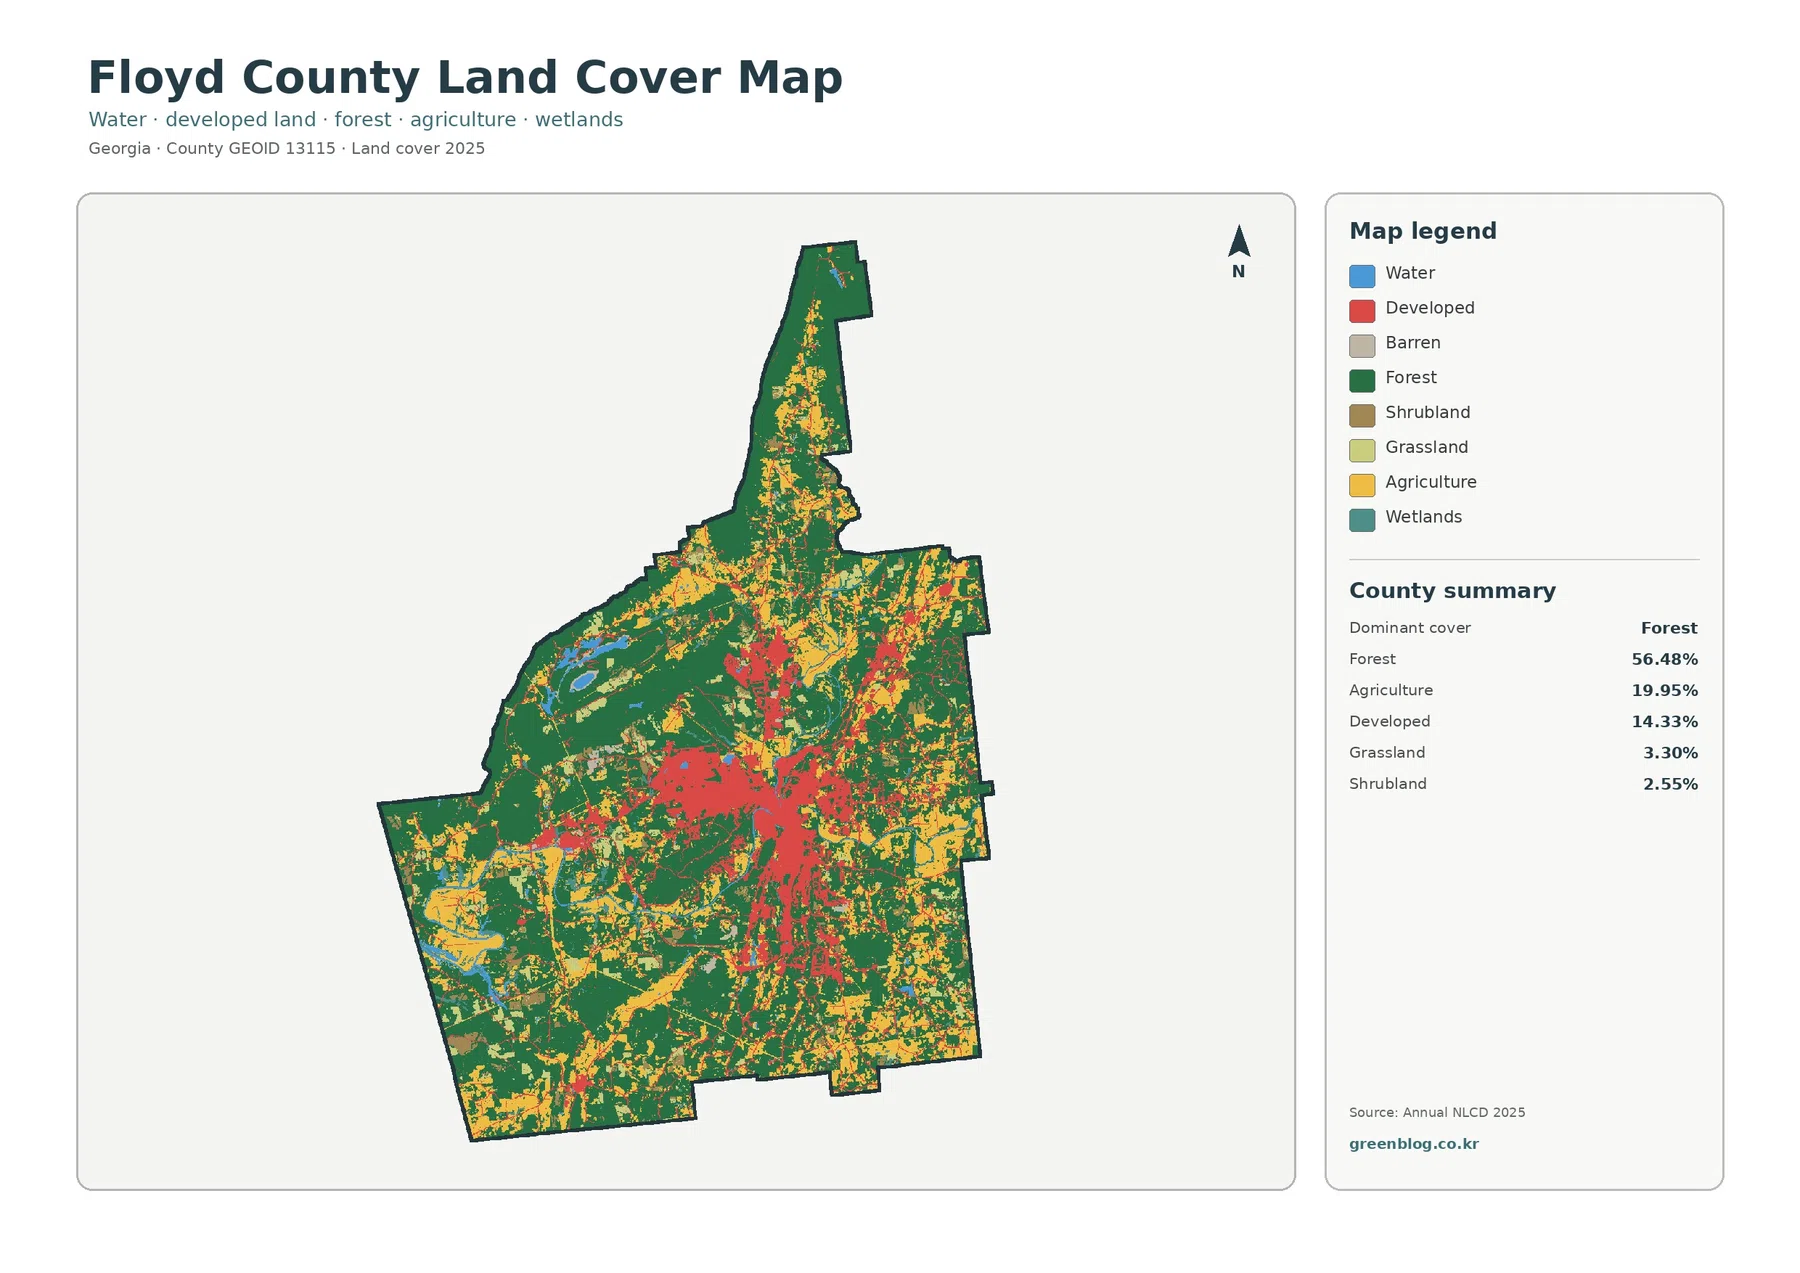
Floyd County’s 2025 land-cover pattern is defined by a strong contrast between Rome and the large wooded and agricultural areas around it. Forest is the largest class at 56.48%, followed by agriculture at 19.95% and developed cover at 14.33%. The general map shows a concentrated developed core near the middle of the county, while broad forest blocks spread across much of the north, west, and outer county.
This page uses four views to separate those patterns: general land cover, forest and farmland, impervious surface, and mapped class differences between 1985 and 2025. The WebP versions are displayed in the article, and the four original JPG maps are available together in one download below. They describe surface cover at county scale; they are not parcel, ownership, zoning, or permit maps.
Table of Contents
Start with the contrast between Rome and the county around it
The general land-cover map makes Floyd County’s internal contrast easy to see. Dark green forest covers more than half of the county and forms especially broad areas in the north, west, southwest, and along much of the outer edge. Yellow agricultural cover is interwoven with those forests rather than confined to a single district. Red developed cover, by comparison, has a clear center of gravity around Rome and becomes more fragmented as it extends outward.
The 2025 summary puts numbers behind that visual pattern. Forest accounts for 56.48% of the county, agriculture 19.95%, and developed land 14.33%. Grassland is 3.30% and shrubland 2.55%, while water and wetlands make up 1.61% and 1.34%, respectively. The smaller countywide share of developed cover can be misleading if it is read without the map, because the developed class is tightly concentrated and therefore visually prominent around the urban core.
Land cover should not be confused with legal land use. Annual NLCD classifies what is on the ground as interpreted from remote-sensing data, such as forest, agriculture, water, or developed surfaces. It does not state who owns a property, what zoning applies, or whether a site can be developed. A low-density residential area can contain trees, lawns, rooftops, and pavement within the same mapped neighborhood, so the category is best used for broad geographic comparison rather than parcel-level decisions.
Another useful feature of the map is the way forest and agriculture remain close to the developed center. Floyd County does not show a simple boundary where city ends and uninterrupted forest begins. Instead, the landscape changes through a patchwork of wooded land, agricultural cover, and developed areas. That makes the county a good example of why percentages and spatial distribution should be read together: the largest class tells what covers the most area, while the map tells where each class is actually concentrated.
The forest-and-farmland view reveals the outer county more clearly
Removing most of the developed detail changes what stands out. In the forest-and-farmland map, the northern extension of the county is predominantly green, and large wooded blocks remain visible in the west and southwest. Agricultural cover appears as a network of lighter areas among the forests, with substantial patches in the western, southern, and eastern portions of the county. The pattern is dispersed rather than centered on one broad farming belt.
Agriculture’s 19.95% share is large enough to shape the county visually even though forest remains dominant. In many places the two classes meet directly, and agricultural patches are embedded within larger wooded surroundings. That makes this map more useful than the general map when the question is not “where is development?” but “how are wooded and open working landscapes arranged outside the city?” It also prevents the bright developed core from overwhelming smaller but geographically important rural patterns.
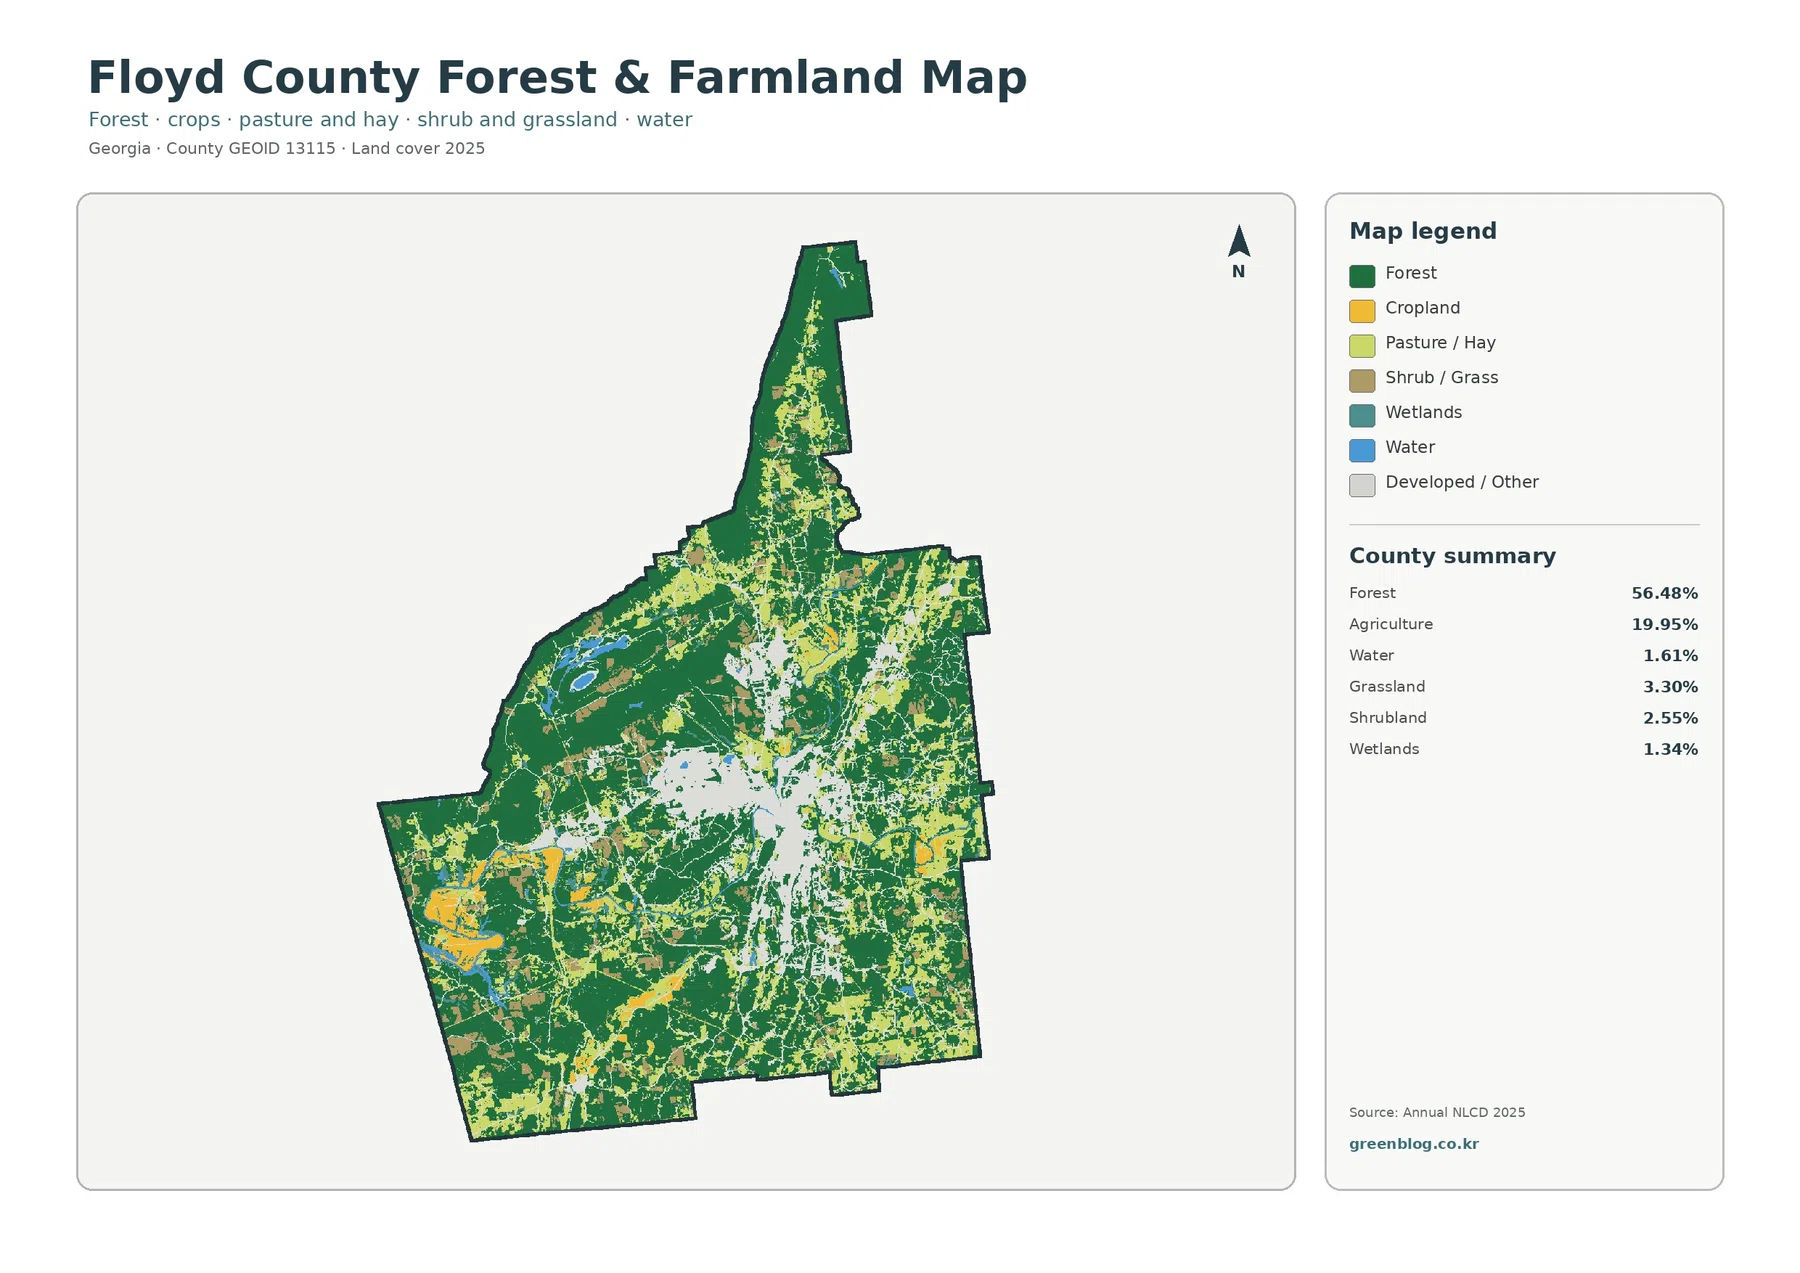
The agricultural category is still broad. It can include cropland, pasture, and hay-related classes, so the map cannot identify a specific crop or tell whether an individual field is actively farmed in a particular season. It also does not define farm ownership. What it does well is show where open agricultural cover appears relative to the forest and the developed center, which is useful for county-scale landscape comparisons and for deciding where more detailed local data may be needed.
This simplified view also prepares the reader for the impervious-surface map. The developed class covers 14.33% of Floyd County, but that percentage includes places where hard surfaces are mixed with vegetation and soil. The next map strips away that broad developed label and focuses on the share of surfaces such as pavement and rooftops, revealing a much smaller but more concentrated urban footprint.
Hard surfaces make the Rome core easier to isolate
Floyd County’s mean impervious value is 3.72%, and 2.16% of the county is mapped at 50% impervious or higher. Impervious surface means ground that water has difficulty soaking through directly, including pavement, parking areas, and many building roofs. The number is not the same as developed cover because a developed neighborhood can contain substantial vegetation, lawns, and exposed soil along with hard surfaces.
On the map, the highest values cluster around Rome. Darker tones form a compact central concentration, with thinner lines and smaller patches extending away from it. Much of the northern extension and broad western and southern outer areas remain pale. The result is a sharper urban-versus-rural contrast than the general land-cover map provides. A reader looking for the most intensively built surfaces can therefore find them much faster here than by using the 14.33% developed figure alone.
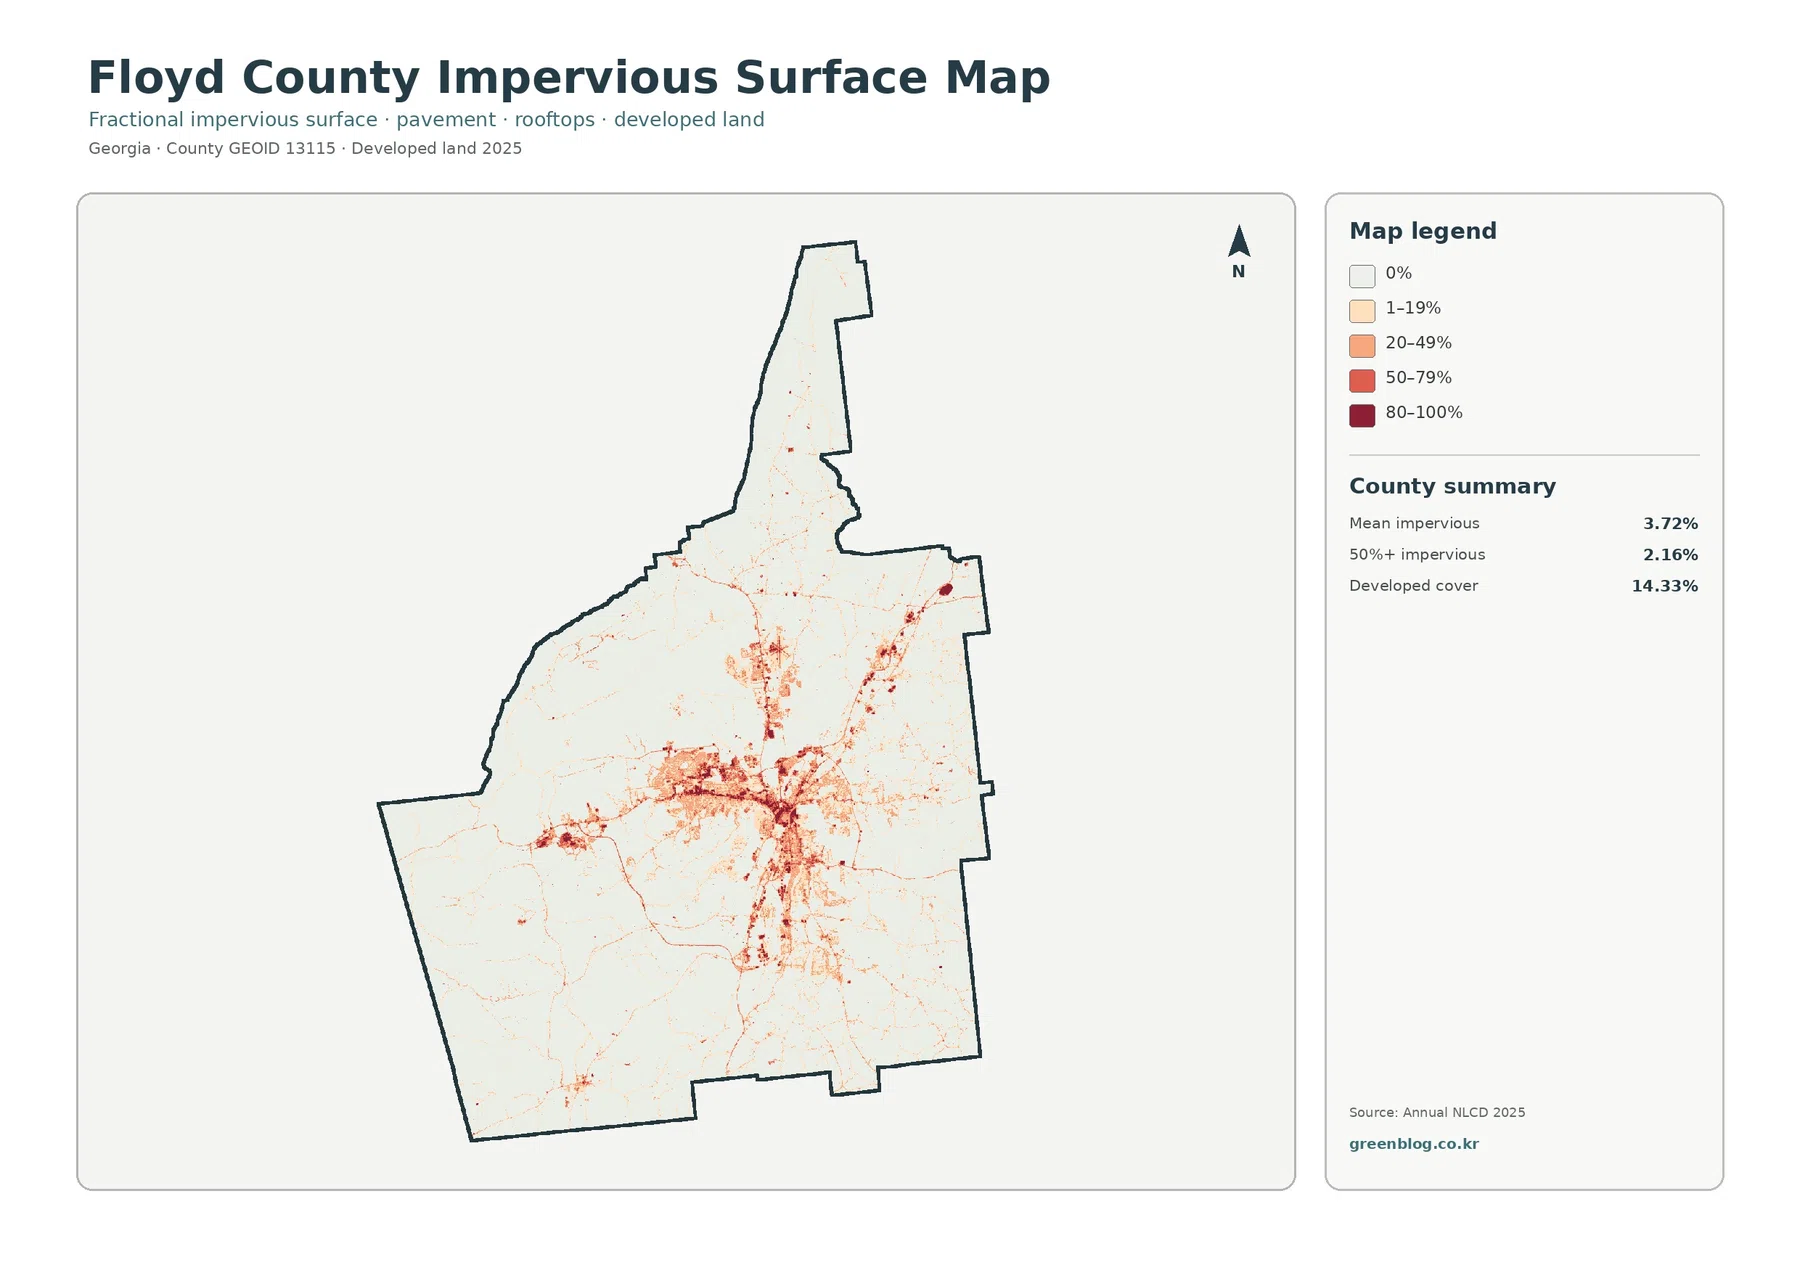
The impervious map is especially useful beside the general land-cover map. One answers where land is classified as developed; the other shows where hard surfaces occupy a larger share of the mapped area. A suburban or low-density residential zone may appear developed on the first map while remaining relatively light on the impervious map. Dense commercial or central urban areas tend to stand out more strongly because rooftops and pavement occupy a larger fraction of the surface.
It is important not to turn that pattern into a flood map. Impervious surfaces can matter for runoff, but actual flood risk also depends on terrain, drainage systems, rainfall, river levels, soil, and other conditions. The map is a surface-cover layer, not a hydrologic model. It can help identify areas where a reader may want to consult stormwater or flood information, but it cannot determine risk on its own.
Rome’s river confluence provides a useful geographic anchor
A local reference point makes the central pattern easier to understand. The City of Rome states that the Etowah and Oostanaula rivers meet in Rome to form the Coosa River. The land-cover maps are not river maps, yet this three-river setting provides real geographic context for the county’s central urban area. When the developed and impervious maps are viewed with that fact in mind, Rome becomes a practical anchor for orienting the surrounding forest, agriculture, and water features.
The Rome-Floyd comprehensive plan offers another type of context. It describes a more varied land-use mix inside Rome than in unincorporated Floyd County and notes concentrations of commercial activity in downtown and along major corridors. Land use and NLCD land cover are different datasets and should not be matched category for category. Still, the planning document helps explain why the map’s densest impervious pattern is centered on Rome rather than spread evenly across the county.
The river reference is useful, but it should not be overextended. A land-cover map at this scale does not show channel width, floodplain boundaries, water depth, or water quality. The fact that developed cover is near river corridors does not prove that rivers caused a particular development pattern. For questions about water resources or flood conditions, a dedicated hydrology or flood dataset is more appropriate. Here, the rivers are best used as geographic context for locating the county’s central urban area.
A 30.72% endpoint difference is not one kind of land change
The change map compares land-cover classifications from 1985 and 2025. It marks class differences across 30.72% of Floyd County. Within that total, 4.11% is shown as classified to developed, 8.30% as forest loss, 2.32% as agricultural loss, and 15.85% as other class difference. Those categories should be kept separate because the total does not represent one single process such as urban growth.
Red developed-change areas are more noticeable around Rome and along several connected directions, but they are only one part of the map. Orange forest-loss and purple other-difference cells occur much more broadly, including in areas that are still forest-dominated on the 2025 map. This is an important comparison: Floyd County can have a 30.72% endpoint class difference and still have forest as its largest current class at 56.48%. The two statistics describe different questions.
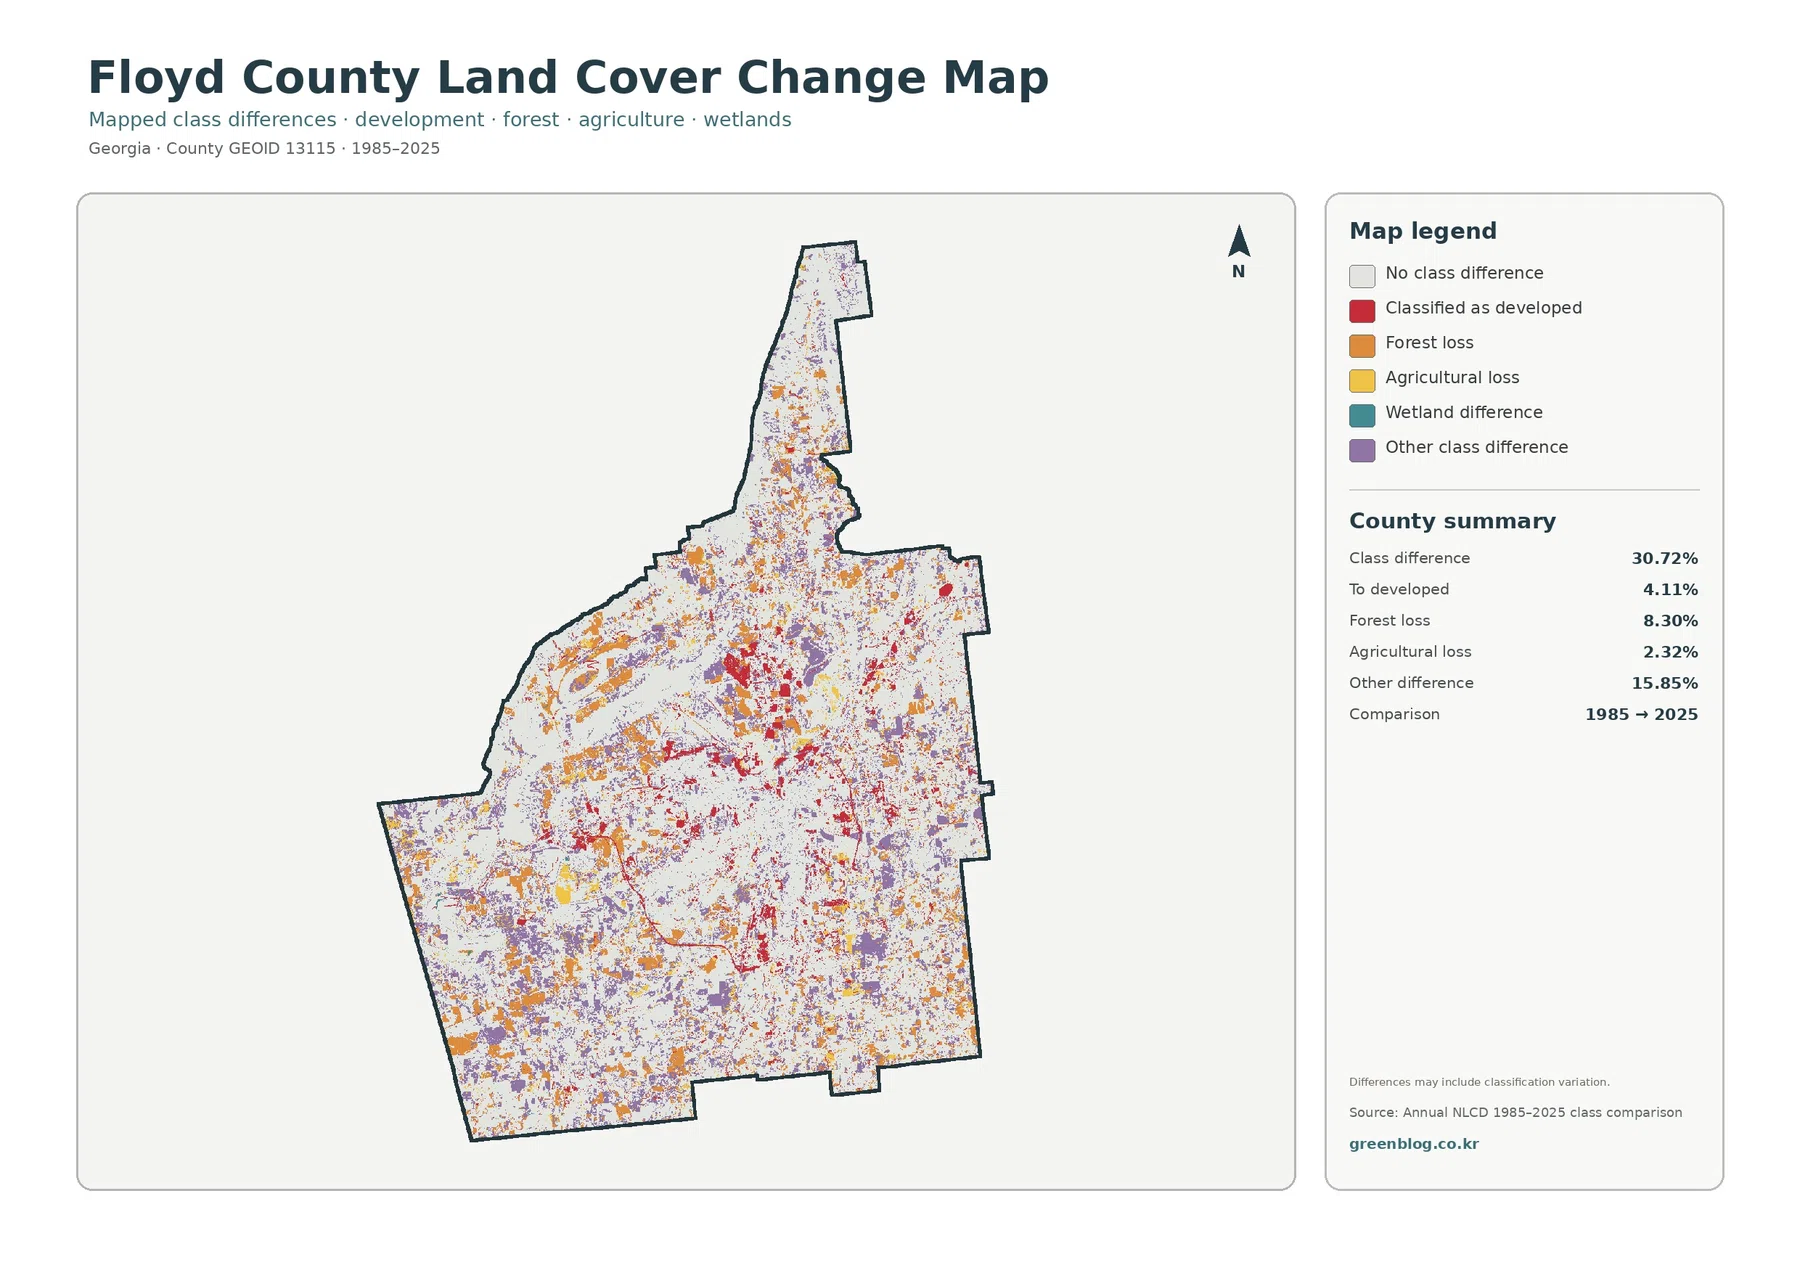
The map itself warns that some differences may include classification variation. Annual land-cover products are raster datasets, meaning the ground is represented by grid cells. A cell can contain a mix of trees, roads, lawns, roofs, and other surfaces, and changes in imagery or classification can affect how it is labeled in different years. A small colored patch should therefore not be treated as proof of a specific construction project, timber harvest, or land-management event.
For a site-level history, intermediate imagery and local records are needed. The endpoint comparison does not show whether a place changed once or several times during the forty-year interval, and it cannot establish the date of a particular change. Its strongest use is screening: find broad areas where classes differ, then check aerial imagery, planning records, or other dated sources if a more precise explanation is required.
Choosing the right map for a report, lesson, or reference page
Use the general land-cover map when the goal is a one-page overview. It places forest, agriculture, developed land, water, wetlands, and smaller classes in the same frame, making it the best starting point for explaining how Rome fits within the broader county. It is also the easiest map for comparing Floyd County with another county using the same 2025 classification system.
Choose the forest-and-farmland map when rural land is the main subject. By reducing the visual weight of development, it makes the 56.48% forest share and 19.95% agricultural share easier to compare spatially. It works well for environmental education, broad rural-landscape discussion, or a presentation that needs to show where wooded and agricultural cover are most prominent without implying parcel ownership or crop type.
The impervious map is the better option for explaining built intensity. It separates a general developed category from the surfaces most associated with pavement and rooftops, making Rome’s compact core much more obvious. For long-term comparison, use the 1985–2025 map together with the current land-cover map. The pairing prevents a common mistake: interpreting a changed cell as if it described the present surface by itself.
For printed handouts or slide decks, showing two maps side by side can be more informative than enlarging one map. General land cover beside impervious surface highlights the difference between developed classification and hard-surface concentration. Forest and farmland beside the change map lets the reader compare today’s broad rural pattern with locations where the endpoint classifications differ. Keeping the legends visible is important because the same colors do not carry the same meaning across all four maps.
Scale, date, and file limits to keep in mind
Annual NLCD is a raster product. Instead of tracing every property line, it divides the ground into cells and assigns a class or value to each cell. That approach is excellent for county-scale patterns but naturally generalizes fine boundaries. A driveway, narrow stream edge, or mixed residential lot can be represented more simply than it appears on the ground. For legal boundaries, zoning, building decisions, or ownership research, current Floyd County parcel and planning records are the appropriate sources.
The current maps use the 2025 classification year. Development, clearing, regrowth, or agricultural changes after that data period may not appear. The change map compares 1985 with 2025 rather than providing a year-by-year timeline. Readers who need a current condition at a specific address should check recent aerial imagery and local records instead of assuming the county-scale map is up to date at parcel level.
The article displays WebP images for efficient browser viewing. The downloadable archive contains the four original JPG files, each at 2480×1754 pixels: general land cover, forest and farmland, impervious surface, and 1985–2025 land-cover change. The package does not state that these images meet an A3 300-dpi reference, so large-format printing should be tested at the intended physical size before final production.
For ordinary documents, presentations, and on-screen comparison, the JPG files provide a larger source than the web preview and can be placed directly into a layout. When cropping or enlarging them, keep the legend and year information whenever possible. Those elements explain what each color means and prevent the change map from being mistaken for a current land-cover map.
Frequently Asked Questions
Is Floyd County mostly forest even though Rome is a major developed center?
Yes at the county scale. Forest is the largest 2025 class at 56.48%, while developed cover accounts for 14.33%. The map shows why both descriptions matter: development is strongly concentrated around Rome, but large forest blocks cover much of the north, west, southwest, and other outer parts of the county. Countywide percentages and local concentration are describing different aspects of the same landscape.
Why is mean impervious cover only 3.72% when developed land is 14.33%?
Developed land can include vegetation and soil mixed with buildings and pavement, especially in lower-density residential areas. Impervious cover measures hard surfaces more directly. That is why the county can have 14.33% developed cover while the mean impervious value is 3.72% and only 2.16% is mapped at 50% impervious or higher.
Does the 30.72% class difference mean that nearly one-third of the county was physically transformed?
Not necessarily. The value counts cells whose mapped class differs between the 1985 and 2025 endpoints, and the map notes that classification variation may contribute to some differences. It is useful for locating broad change patterns, but confirming actual development, clearing, or agricultural conversion requires additional dated imagery or local records.
Sources and reference material
- MRLC Annual NLCD Data – annual land-cover data access
- USGS Annual NLCD Land Cover Classification – class definitions and interpretation
- City of Rome Water Quality – local context for the Etowah, Oostanaula, and Coosa rivers
- Rome-Floyd / Cave Spring Comprehensive Plan – local land-use and planning context
- U.S. Census Bureau TIGER/Line Shapefiles – county boundary data
Map File Information
The four original JPG land-cover maps for Floyd County are provided together in one ZIP file.
- Included Versions: General land cover, forest and farmland, impervious surface, and 1985–2025 land-cover change
- Printable Size: 2480×1754 pixels each
- File Type: ZIP containing four JPG files
Related Maps
- Appling County Georgia Land Cover Map
- Atkinson County Georgia Land Cover Map
- Bacon County Georgia Land Cover Map
Green Map creates custom-edited map images using open geographic data sources such as geoBoundaries, Natural Earth, OpenStreetMap, and government open data.
These maps are edited visual materials, not raw data files, and are provided for education, documents, presentations, and graphic reference.