Cook County is dominated by working land, but the supplied 2025 maps show a much more mixed landscape than a simple farm-country label suggests. Agriculture covers 42.70% of the county, wetlands account for 27.25%, and forest adds another 15.88%. The Cook County Georgia Land Cover Map also reveals a concentrated developed area around the county’s central community of Adel and a narrow north-south pattern of built surfaces extending beyond that center.
This page pairs four views: 2025 land cover, forest and farmland, impervious surface and developed land, and a 1985–2025 class-difference map. The four original 2480 × 1754-pixel JPG maps are available together in one ZIP, making it easy to move from a countywide overview to a closer discussion of agriculture, wetlands, hard surfaces, or long-term mapped differences.
Table of Contents
A farm-dominant county with wetlands woven through the same landscape
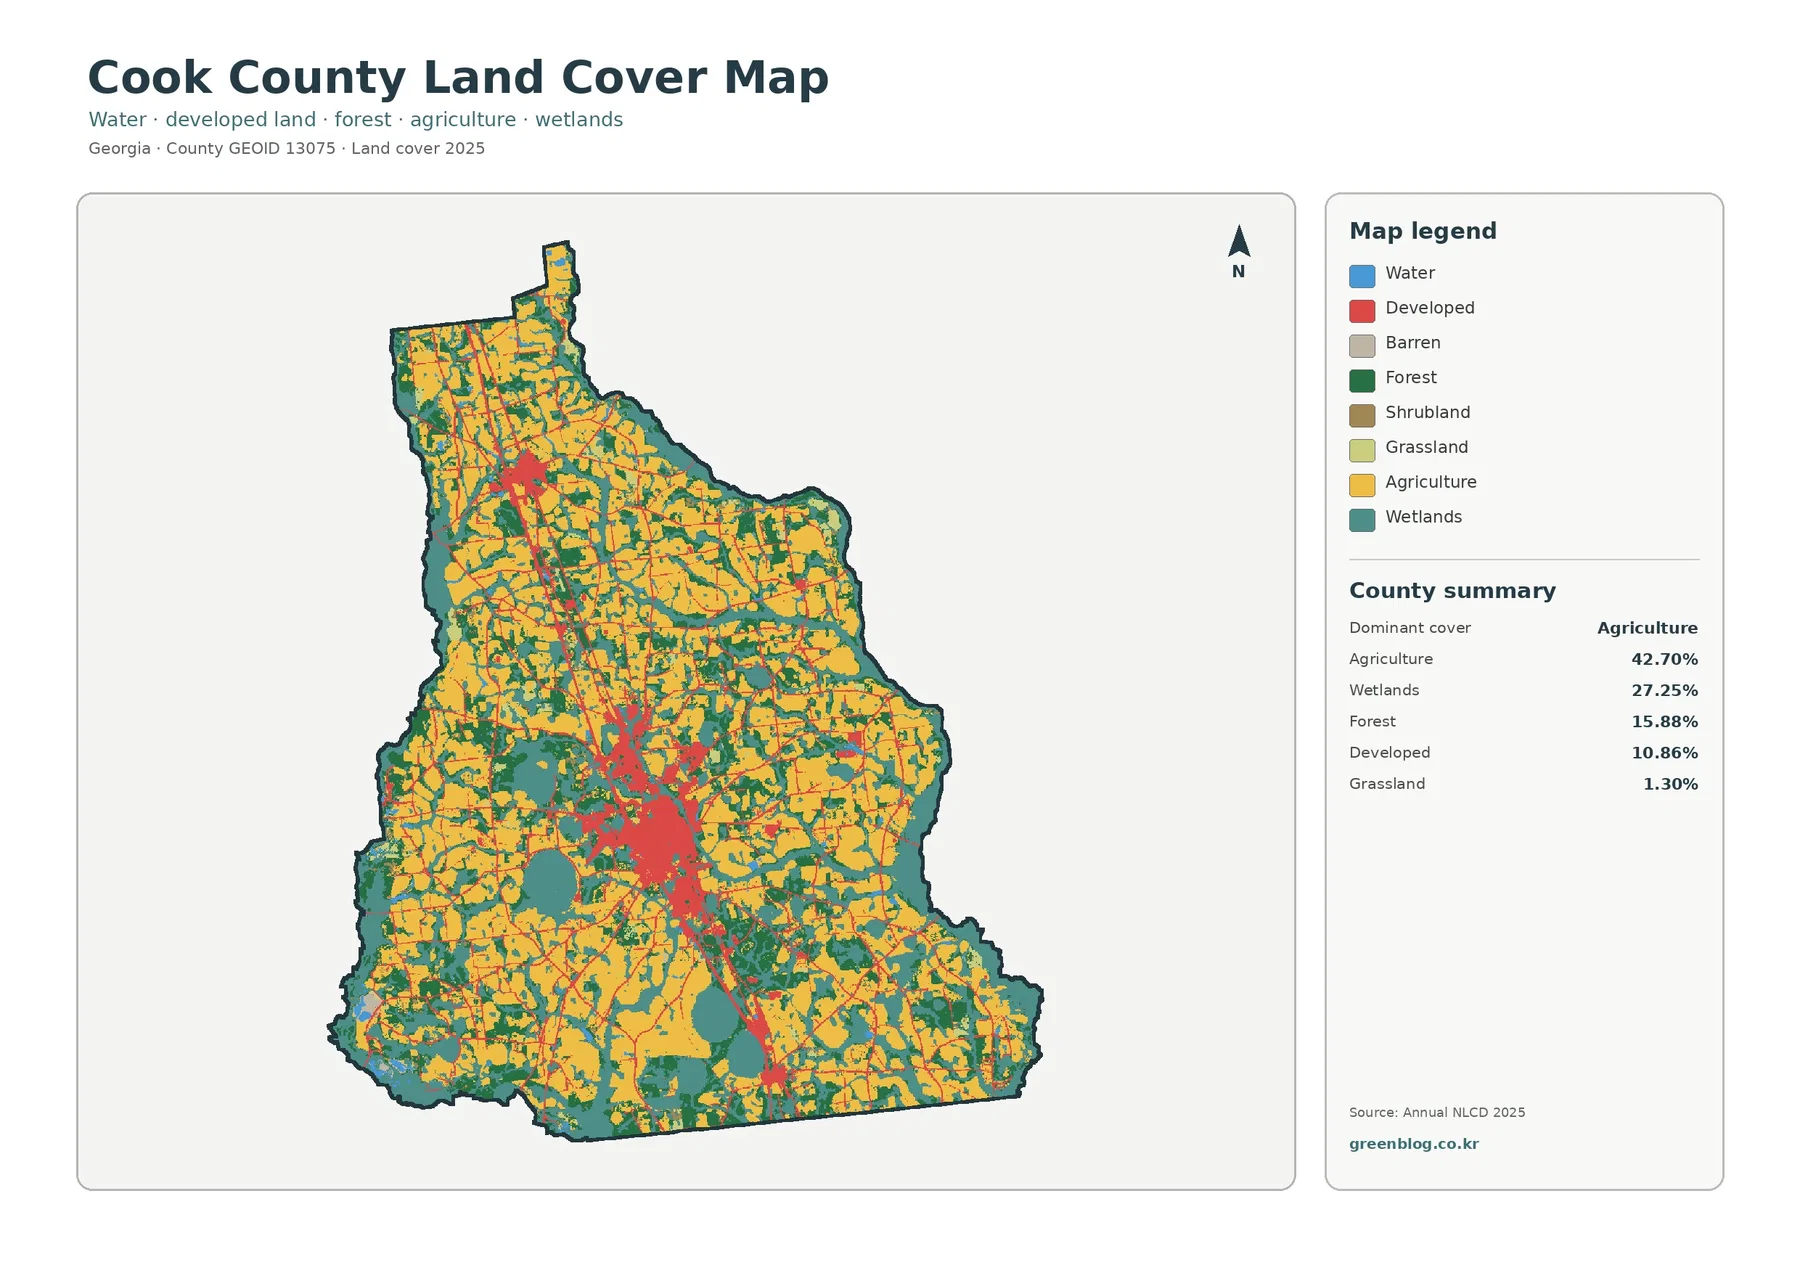
Agriculture is the largest class at 42.70%. Yellow farm cover appears across nearly every part of the county, including broad blocks in the north, east, and south. It does not form one uninterrupted field zone. Forest and wetland patches repeatedly divide the agricultural areas, producing a patchwork that is easy to miss when only the countywide percentage is considered.
Wetlands are the second-largest class at 27.25%. Teal areas occupy substantial portions of the southwest, central-west, southeast, and several interior corridors. In many places the wetland color sits directly beside agriculture, so the map is useful for explaining why Cook County’s rural landscape cannot be understood from cropland alone. Wet ground and vegetated wetland cover make up more than one quarter of the mapped county.
Forest covers 15.88%, while developed land accounts for 10.86%. Dark green forest appears as both narrow connections and larger blocks, especially where the agricultural pattern becomes less continuous. Developed cover behaves differently: the strongest red concentration sits near the center, with thinner extensions running north and south. Cook County government offices are located in Adel, and Georgia planning records identify Adel, Cecil, Lenox, and Sparks as the county’s incorporated communities. That local context helps place the developed pattern without treating the land-cover map as a municipal boundary map.
Several smaller classes matter even though their percentages are modest. The forest-and-farmland summary reports 1.30% grassland, 1.08% shrubland, and 0.81% open water. Blue water is limited compared with the much larger wetland area. Shrub and grass appear mostly as small pieces among farms, forest, and developed land rather than as a dominant landscape of their own.
Why the 42.70% agriculture figure is only the beginning of the story
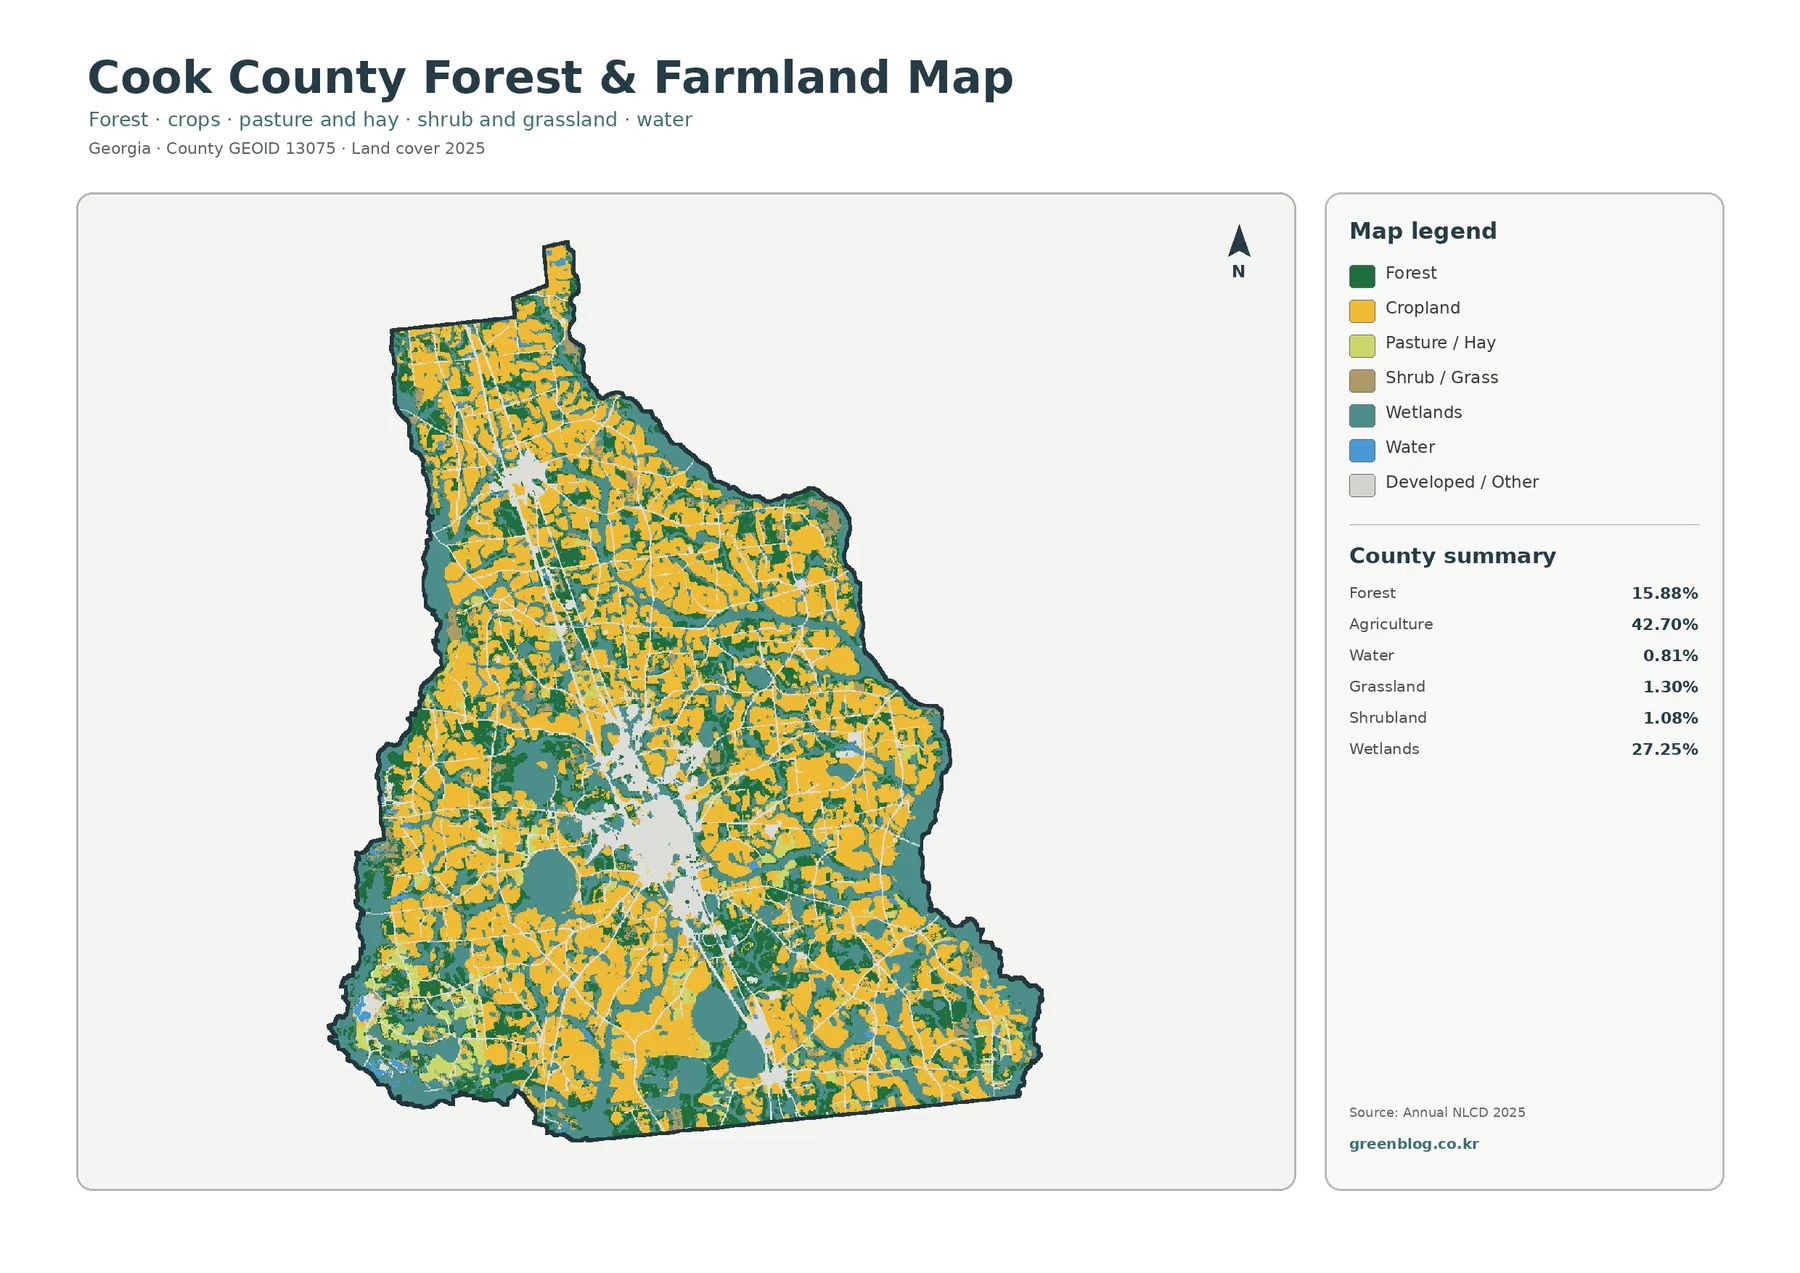
The forest-and-farmland view makes the agricultural footprint easier to follow. Large yellow areas spread across the county, yet they are repeatedly interrupted by teal wetlands and dark green forest. In the north and east, farm blocks often look broader and more continuous. Around the central developed area and toward the wetter southwest, the pattern becomes more fragmented.
Cook County’s UGA Extension office publishes local production information on crops such as cotton, peanuts, and pecans. That local agricultural activity is useful background for understanding why agriculture occupies such a large share of the map, but it should not be used to assign a crop to any individual yellow pixel. Annual NLCD classifies surface cover from remote-sensing data; it does not identify field ownership, exact crop type, farm boundaries, or current planting decisions.
The farm-wetland boundary deserves extra care. Annual NLCD uses 30-meter raster cells, so a cell can contain a field edge, trees, a drainage ditch, wet soil, and a road while still receiving only one dominant class. Enlarging the image makes the cells bigger on the screen but does not create parcel-level detail. Questions about regulated wetlands, drainage on a specific farm, or a legal property boundary require higher-resolution imagery and the appropriate current records.
Forest is also distributed in more than one way. Some green strips connect larger natural patches, while other forest sits between agricultural blocks. In the southwest, forest and wetland colors often occur together across a broader natural-cover zone. This is why the map works best as a comparison rather than a single-class display: the character of Cook County comes from the repeated contact between farms, wet ground, forest, and small developed centers.
Adel stands out in a county where hard surfaces remain limited overall
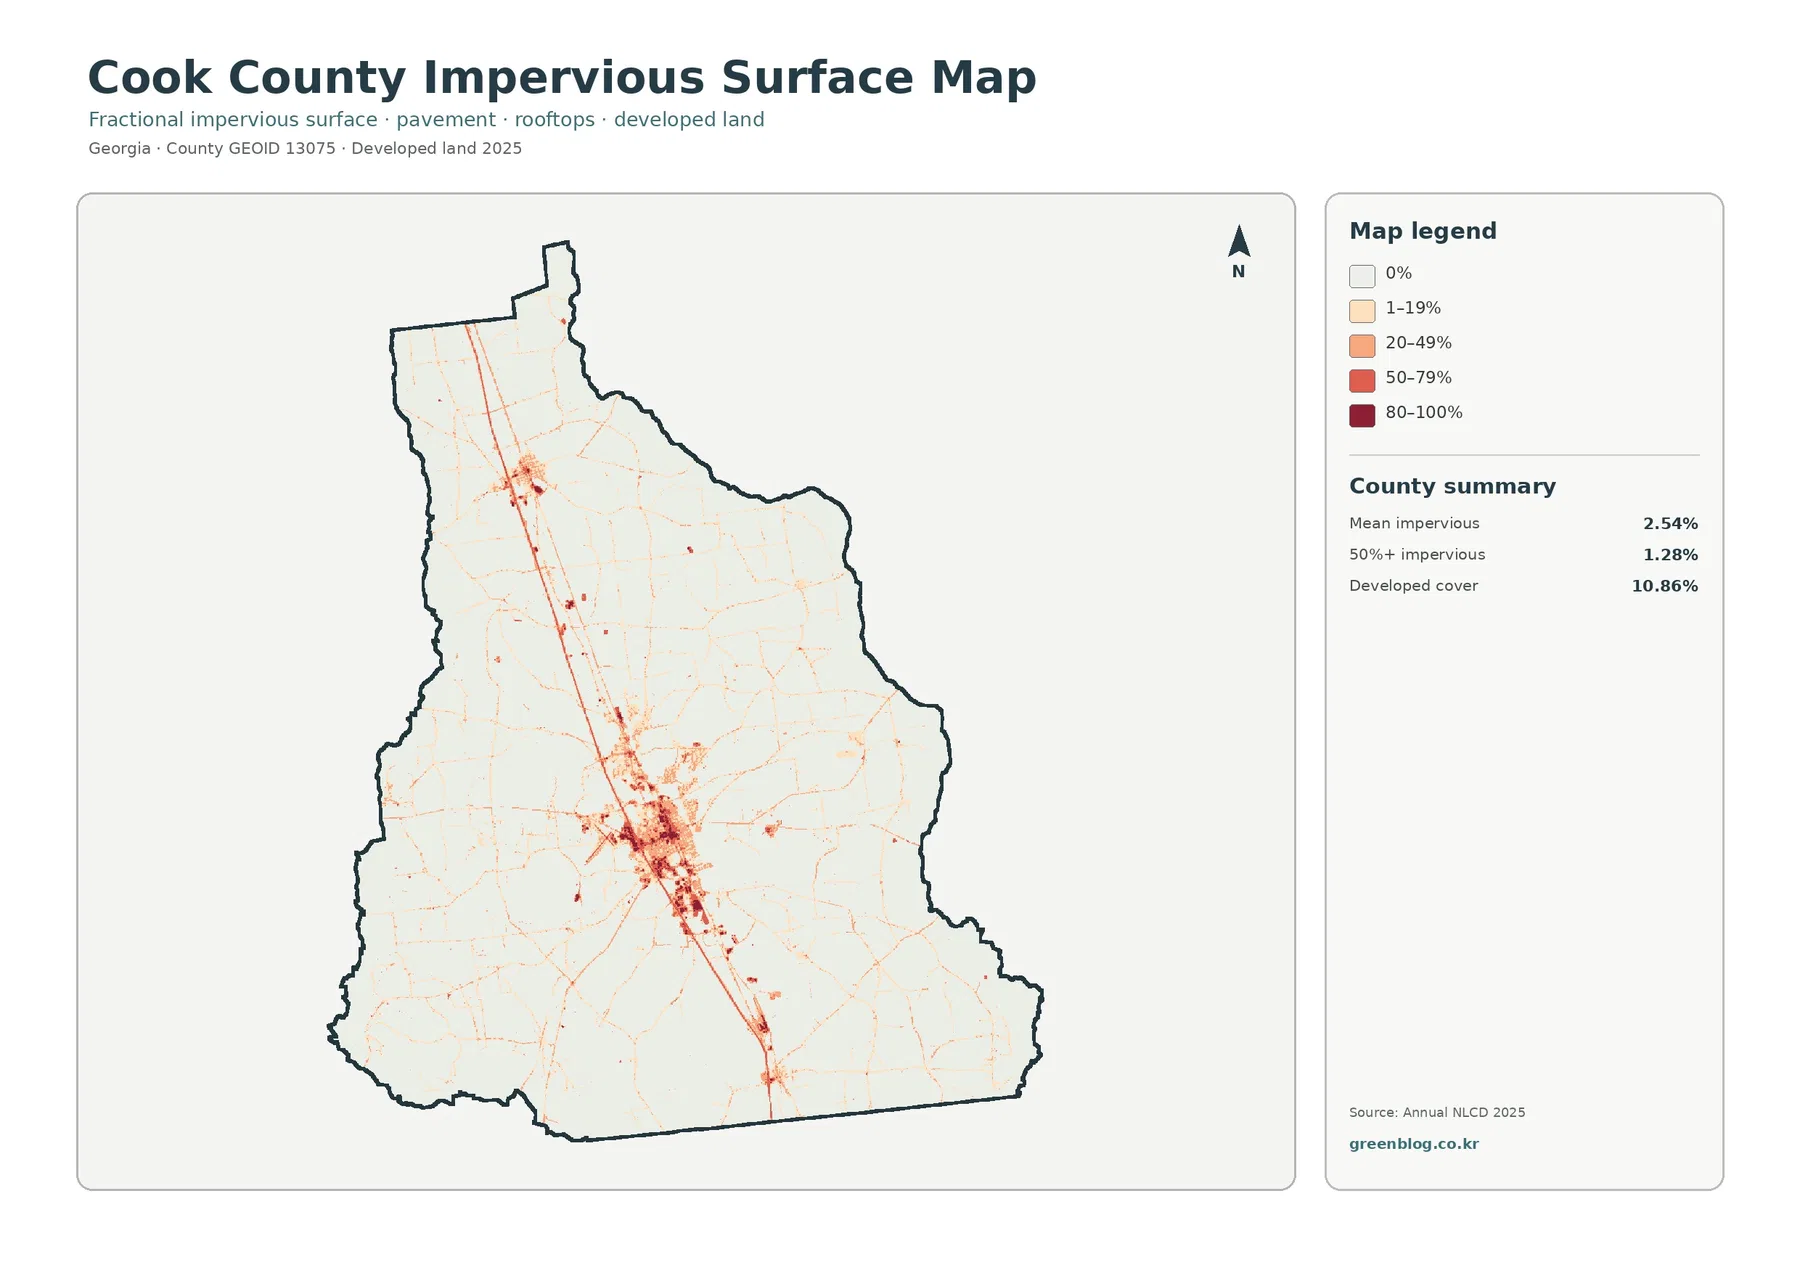
Developed cover is 10.86%, but the countywide mean impervious surface is only 2.54%. Those values measure different things. Developed land-cover classes can contain lawns, trees, bare ground, and other permeable surfaces around homes, businesses, and roads. Impervious cover isolates the harder parts of that landscape, such as rooftops, pavement, and parking areas.
The darkest impervious cluster sits near the middle of the county. Cook County’s administration is based in Adel, so the central concentration can reasonably be discussed in relation to the Adel urban area. From that center, narrow red and orange traces extend north and south, creating a visible transportation-and-settlement corridor. The map does not print road names, however, so a transportation map should be used before assigning a specific name to any individual line.
Only 1.28% of Cook County falls in the 50%-or-higher impervious category. That small share is important because it shows how concentrated the hard-surface footprint is. The county is not covered by dense pavement even though developed classes occupy more than one tenth of the land. High values are clustered around the central built-up area and a limited number of roads and sites, while the agricultural countryside quickly returns to low impervious percentages.
A smaller built concentration is visible in the north, and scattered developed marks appear along the southern corridor and at a few isolated locations elsewhere. Georgia’s comprehensive planning page treats Adel, Cecil, Lenox, and Sparks as communities within the Cook County planning area. Because the land-cover graphic lacks city outlines, these scattered clusters should not be drawn as exact municipal shapes. What the map does support is a clear distinction between one strong central concentration and a series of smaller settlement and road-related hard-surface patches.
The 1985–2025 comparison records several kinds of class difference, not one development story
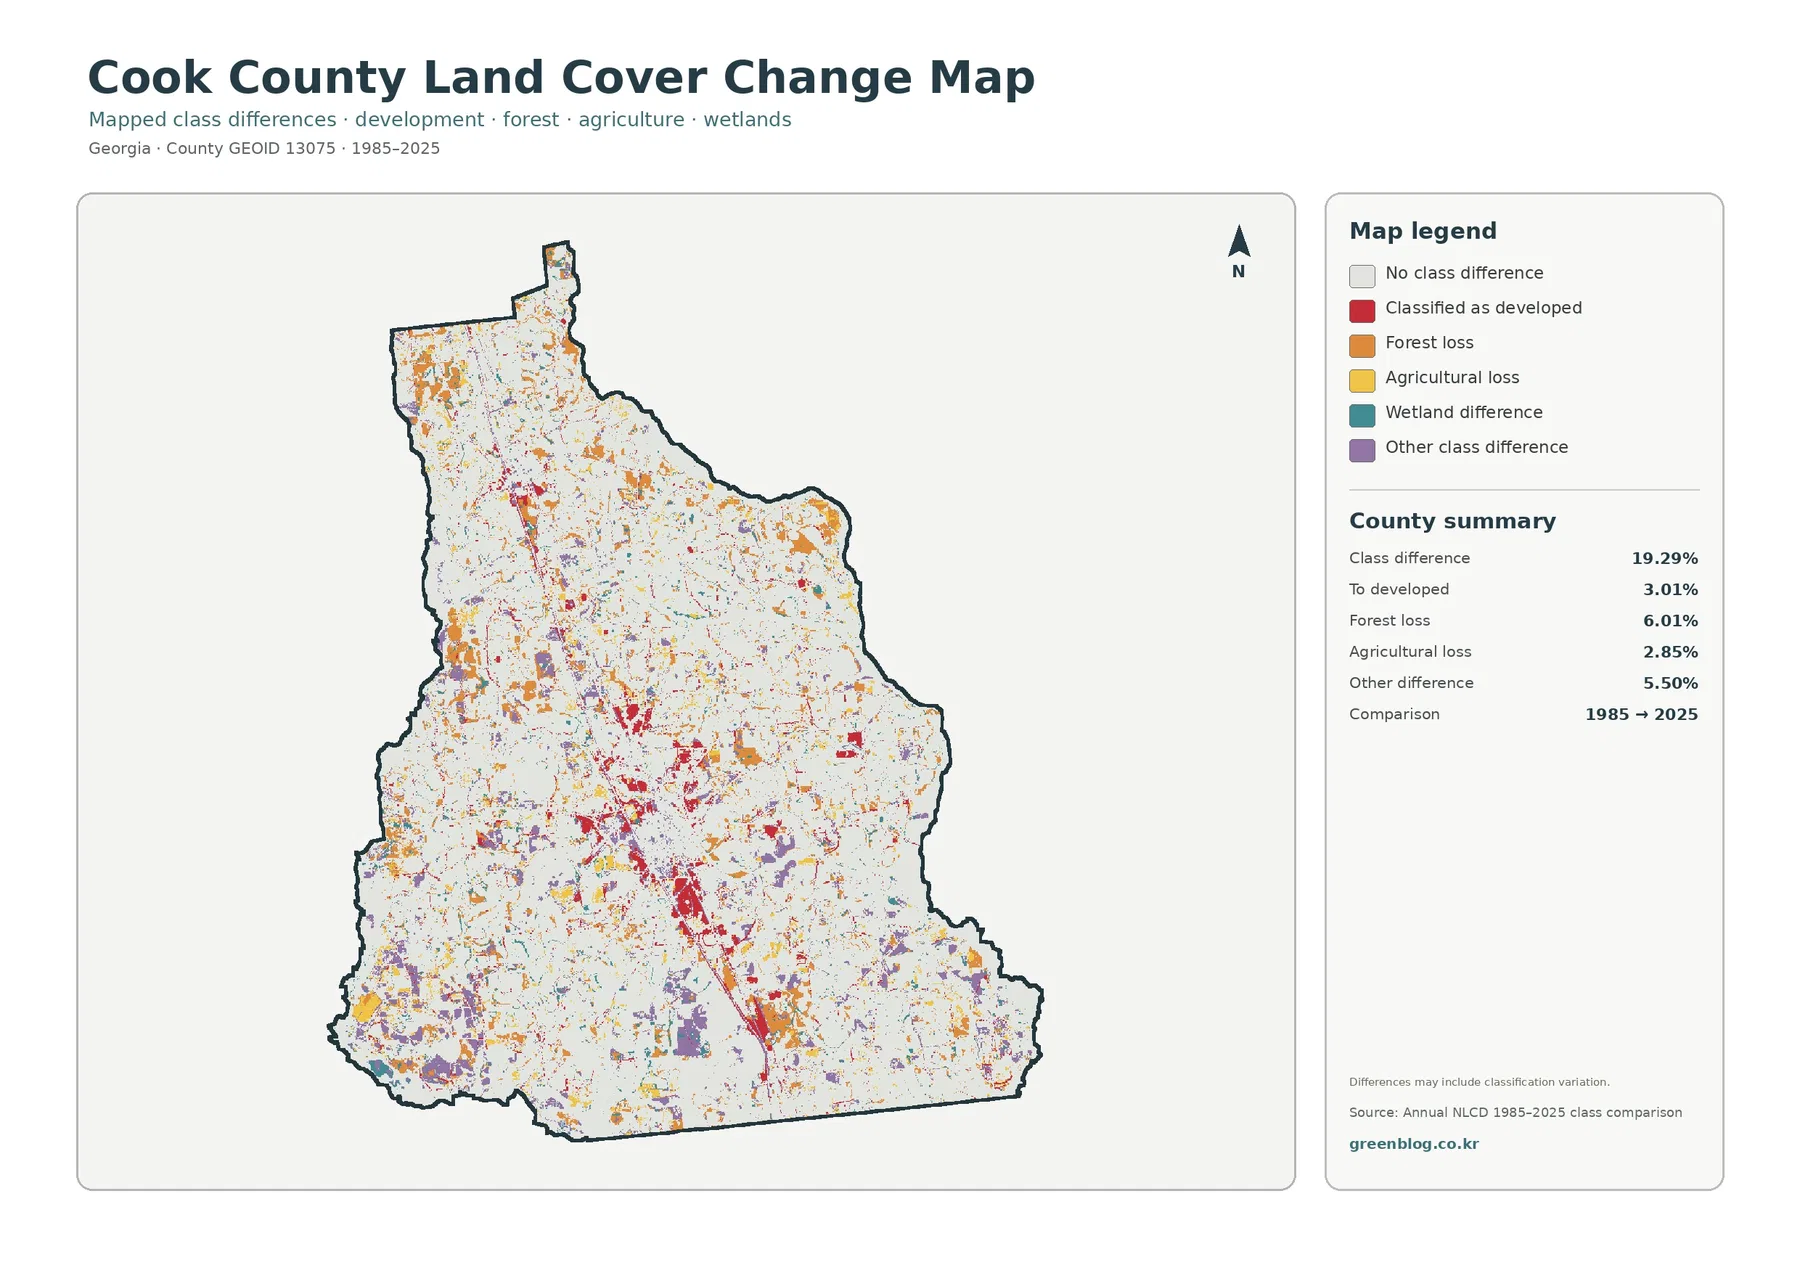
The change map reports a 19.29% overall class difference between 1985 and 2025. Of the mapped categories summarized on the figure, 3.01% was classified as developed at the 2025 endpoint after another class in 1985. Forest loss accounts for 6.01%, agricultural loss for 2.85%, and other class differences for 5.50%. Forest-related change is therefore larger than the developed-transition figure, which immediately argues against reducing the entire comparison to suburban growth.
Red developed transitions cluster most visibly around the central built area and along parts of the north-south corridor. Some of these locations resemble the current impervious pattern, which makes the two maps useful side by side. Orange forest-loss cells and purple other differences are much more scattered, appearing across agricultural and natural areas rather than forming one continuous zone. Yellow agricultural-loss marks are also dispersed.
Proximity between colors should not be treated as proof of cause. A forest-loss cell next to a developed-transition cell does not, by itself, prove that a construction project removed that forest. The comparison records the class assigned at two endpoints. Determining when a change occurred, whether it persisted, or what caused it requires intermediate imagery, local records, and sometimes field evidence.
The figure itself notes that differences may include classification variation. That caution is especially important in a county with extensive farm-wetland boundaries, because mixed pixels and seasonal conditions can influence how a cell is classified. The change map is best used as a screening layer: identify where the two endpoints differ, then investigate those locations with more detailed sources if the question requires a site-specific conclusion.
How to combine the four maps for county profiles, lessons, and local comparisons
For a general Cook County profile, begin with the 2025 land-cover map. It gives the clearest one-page summary of the county: agriculture leads at 42.70%, wetlands follow at 27.25%, forest covers 15.88%, and developed land accounts for 10.86%. That overview prevents a reader from overemphasizing the central built area simply because it is visually bright.
When the topic is agriculture or natural resources, the forest-and-farmland map adds the most useful detail. It separates the working-land pattern from forest, wetlands, water, grass, and shrub cover. Combined with Cook County Extension’s agriculture resources, it can support an explanation of why farming is important to the county while still making clear that the map is not a crop inventory or parcel map.
For settlement and transportation context, the impervious map is more precise than the general developed class. The 2.54% mean and 1.28% high-impervious share show that hard surfaces are concentrated rather than countywide. The visual cluster around Adel and the narrow north-south traces can then be compared with current road or municipal maps when names and boundaries are needed.
The endpoint change map works best after the present-day maps have been understood. A red change cell has more meaning when the reader already knows whether the surrounding 2025 landscape is a developed center, a farm block, a wetland margin, or a forest patch. This sequence is particularly helpful in environmental lessons and presentation graphics because it separates current condition from mapped difference over time.
The four images can also be used to compare different parts of Cook County without pretending that every part of the county behaves the same way. The broad farm-wetland mosaic, the wetter natural-cover areas in the southwest, the central Adel concentration, and the smaller dispersed built patches each tell a different part of the story. That county-specific contrast is more informative than a generic statement that Cook County contains farms, forests, and towns.
Scale, classification date, and what these maps cannot answer
Annual NLCD is a generalized land-cover product rather than a parcel survey. Its 30-meter cells simplify the surface into a dominant class, so narrow roads, small ponds, tree rows, field edges, and mixed residential lots may not be represented exactly as they appear on high-resolution aerial photography. The boundary between two colors should therefore be read as a mapped classification boundary, not a surveyed legal line.
The 2025 map describes the supplied observation year. Construction, harvest, timber activity, vegetation recovery, drainage changes, or flooding after that date may not appear. Agricultural land can also look different across seasons, so a current site condition should be checked against newer imagery when timing matters.
Land cover is not the same as zoning, ownership, or legal land use. A cell classified as agriculture does not establish that a parcel is zoned exclusively for farming. A wetland class is not a regulatory wetland determination, and a developed class does not define the limits of Adel, Sparks, Lenox, or Cecil. Cook County planning, assessor, and other official records should be used for legal or administrative questions.
Each original JPG is 2480 × 1754 pixels. That size works well for web reference, slides, ordinary documents, and many classroom uses, but the package does not identify the files as meeting an A3 high-resolution reference. Test a large print before relying on it for a poster. Upscaling the image can increase pixel dimensions, but it cannot create land-cover detail that was not present in the source.
Four original JPG maps in one download
The ZIP contains one JPG each for 2025 land cover, forest and farmland, impervious surface and developed land, and the 1985–2025 land-cover comparison. Use the countywide map for the main overview, then add the specialized view that matches the question: farm and wetland relationships, hard-surface concentration, or endpoint class differences.
Frequently Asked Questions
Is Cook County mostly farmland?
Agriculture is the largest single class at 42.70%, but it does not cover a majority of the county. Wetlands account for 27.25% and forest for 15.88%, so the more accurate description is a farm-dominant landscape with extensive wet and forested cover mixed throughout it.
Why is developed cover 10.86% while mean impervious cover is only 2.54%?
Developed land-cover classes may include lawns, trees, bare ground, and other permeable surfaces around buildings and roads. Impervious cover focuses on roofs, pavement, parking areas, and similar hard surfaces. In Cook County, the highest values are concentrated around Adel and a limited number of road and settlement locations.
Does the 19.29% class difference mean 19.29% of Cook County was developed after 1985?
No. The 19.29% figure includes every cell assigned a different class at the two endpoints. Only 3.01% is summarized as classified to developed, while forest loss is 6.01%, agricultural loss is 2.85%, and other differences account for 5.50%. The map does not identify the exact year or cause of each change.
Sources and Reference Data
- MRLC Annual NLCD Data – official access point for annual land-cover and comparison products
- USGS Annual NLCD Land Cover Classification – definitions and guidance for agriculture, forest, wetlands, developed land, and related classes
- U.S. Census Bureau TIGER/Line Shapefiles – official county-boundary reference for Cook County
- Georgia DCA – Cook County Comprehensive Plan – planning materials for Cook County and the communities of Adel, Cecil, Lenox, and Sparks
- UGA Extension – Cook County Agriculture & Natural Resources – local agricultural and natural-resource information
- Cook County Georgia – Administration – county government information and the administration office in Adel
Map File Information
The ZIP contains four original JPG maps for comparing Cook County's agricultural landscape, extensive wetlands, Adel-area development, impervious surfaces, and 1985–2025 class differences.
- Included Files: Use only the versions confirmed in the article and supplied images
- File Type: Use the confirmed download contents
- Intended Use: Printing, education, presentations, and map-based projects
Related Maps
- Appling County Georgia Land Cover Map
- Atkinson County Georgia Land Cover Map
- Bacon County Georgia Land Cover Map
Green Map creates custom-edited map images using open geographic data sources such as geoBoundaries, Natural Earth, OpenStreetMap, and government open data.
These maps are edited visual materials, not raw data files, and are provided for education, documents, presentations, and graphic reference.