The strongest feature of the Columbia County Georgia Land Cover Map is not a single land-cover class but a sharp geographic split. Nearly half of the county is forest, yet the eastern side contains a broad developed area, while large blue water surfaces line the north. The result is a county that shifts from lake shore and wooded land to a dense Augusta-area suburban landscape over a relatively short distance.
This page uses four supplied views to explain that contrast: 2025 land cover, forest and farmland, impervious surface and developed land, and a 1985–2025 class comparison. The four original 2480 × 1754-pixel JPG maps are also available together in one ZIP for county profiles, lessons, presentations, and side-by-side map reference.
Table of Contents
The eastern built-up area stands apart from a mostly wooded west
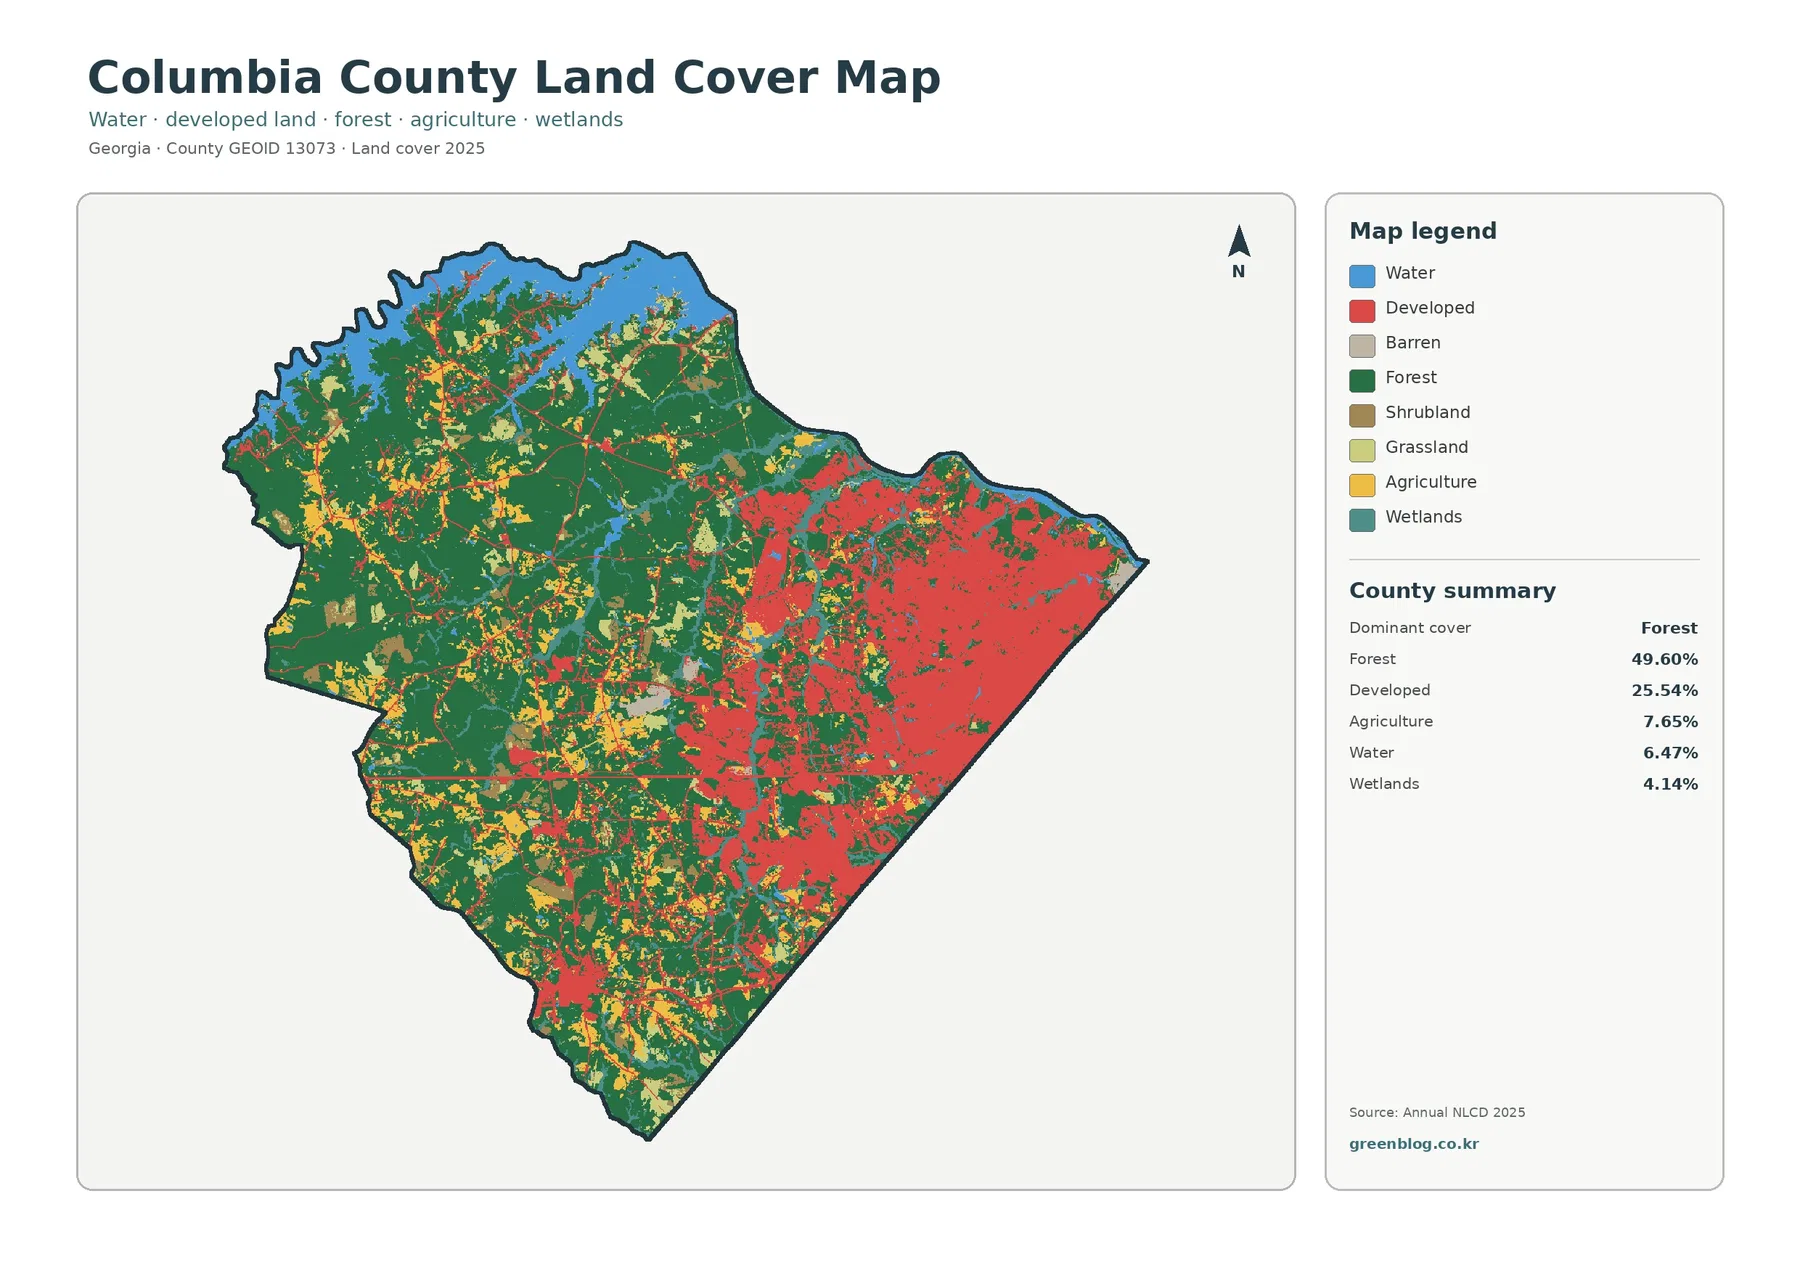
Forest leads the 2025 summary at 49.60%, followed by developed land at 25.54%. Agriculture accounts for 7.65%, open water for 6.47%, and wetlands for 4.14%. Those numbers are useful, but the image makes the county much easier to understand. Green forest dominates much of the west and northwest, whereas red developed cover expands across a large part of the east and southeast.
The eastern concentration is consistent with the Augusta-side communities of Evans and Martinez and with development extending toward Grovetown farther south. The map does not draw city limits or label roads, so a red boundary should not be treated as the legal edge of any community. It is better read as a broad surface-cover pattern: built and landscaped developed classes are far more continuous on the eastern side than in the rural and wooded west.
Columbia County’s own stormwater information gives that pattern useful local context. The county describes its stormwater service area as generally covering Martinez and Evans within the Reed Creek, Jones Creek, Betty’s Branch, and Euchee Creek watersheds, noting that these areas have been strongly affected by urban and suburban development. That does not prove the history of any individual mapped cell, but it supports the broader distinction between the heavily developed east and less developed parts of the county.
Moving west across the map, the red surface becomes broken into smaller patches and narrow lines. Forest becomes more continuous, while agricultural fields and open vegetation appear more often among the trees. The difference matters when using the countywide percentage. A 49.60% forest figure combines large wooded blocks in the west with smaller forest fragments inside and around developed areas in the east, even though those settings look very different on the ground.
Clarks Hill Lake adds a major water edge to the northern county
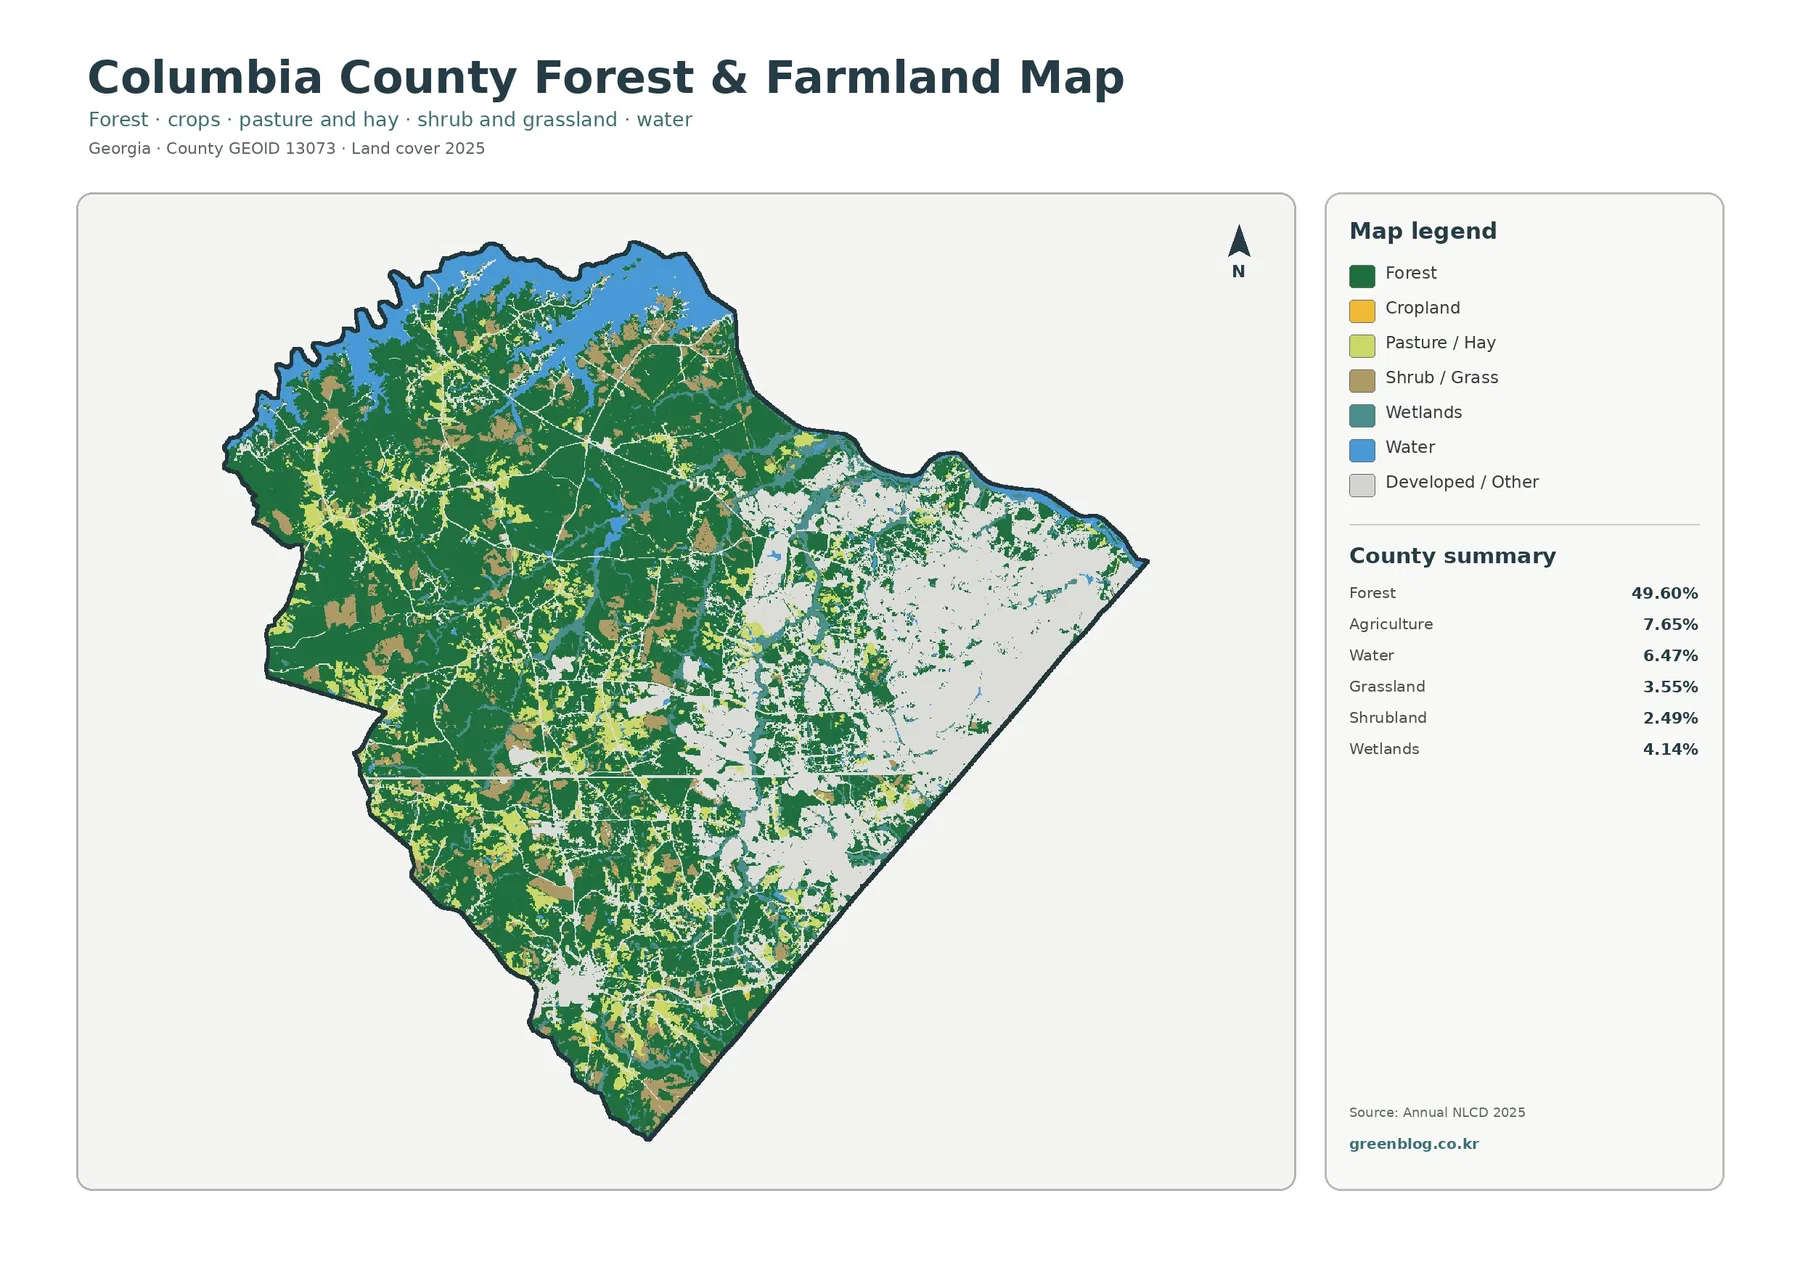
The forest-and-farmland view gives the northern water a clearer role. Open water covers 6.47% of the county and forms a broad, irregular band along the north. Local sources identify this reservoir as Clarks Hill Lake, also known as J. Strom Thurmond Lake. Its shoreline is closely associated with wooded land in the map, creating a northern landscape that looks very different from the broad developed cover farther east and southeast.
Forest still occupies 49.60%, but this specialized map also lists agriculture at 7.65%, grassland at 3.55%, shrubland at 2.49%, and wetlands at 4.14%. Agricultural cover is more visible in the west and southwest, where yellow blocks are scattered among forest and lighter open-cover classes. It is not one continuous agricultural belt. Instead, farms and open areas appear as separated patches within a county whose western half remains strongly wooded.
Wetlands and open water need to be kept separate. Blue areas represent exposed water surfaces, while the wetland class can include land with water-influenced soils and vegetation. The 4.14% wetland share appears in smaller teal areas rather than the large northern water body. A reader interested in watershed or habitat context should therefore compare both classes instead of using the 6.47% water figure as a complete measure of water-related landscape.
Agriculture is a modest countywide share compared with forest and development, but it remains relevant to local land management. UGA Cooperative Extension maintains an Agriculture & Natural Resources program in Columbia County. The land-cover map, however, does not identify crop species, farm ownership, pasture management, or field boundaries. Yellow and light-green classes are broad surface categories, not a farm inventory.
This view is particularly useful for showing why a simple “suburban county” label is incomplete. The eastern population and development center is visually prominent, but the western and northern parts still contain large forests, open land, and lake shoreline. Using the forest-and-farmland map after the countywide map helps keep those less-built landscapes visible in a county profile.
Hard surfaces are concentrated inside the larger developed footprint
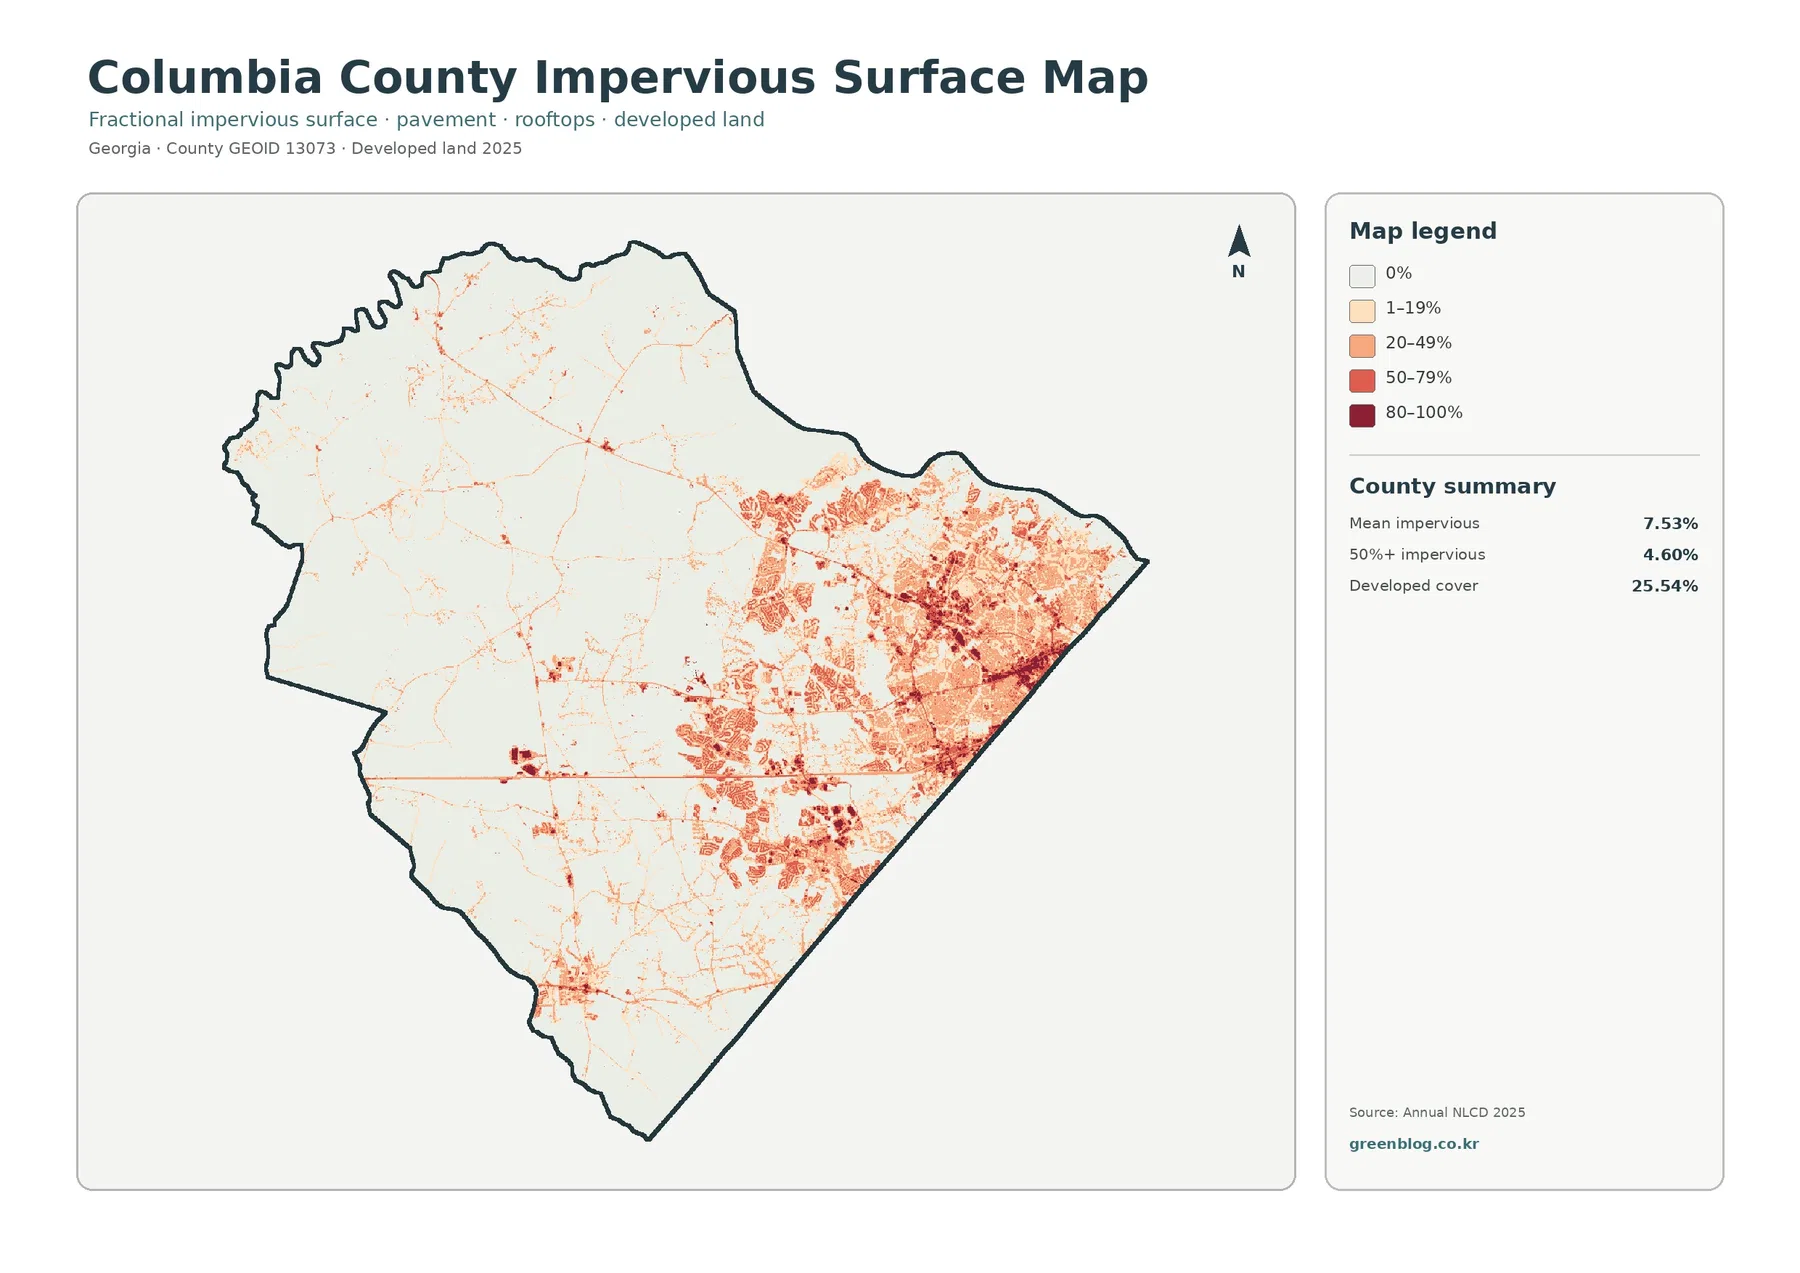
Developed cover makes up 25.54% of the 2025 land-cover summary, but the county’s mean impervious cover is only 7.53%. The difference is important. Developed classes can contain lawns, trees, landscaped ground, bare soil, and other permeable surfaces around homes and businesses. Impervious cover isolates hard surfaces such as roofs and pavement, making it a more direct way to see where built infrastructure is dense.
Only 4.60% of the county is mapped at 50% or greater impervious cover. Those higher values are not spread evenly. The darkest reds cluster across the eastern and southeastern side, while the west is mostly pale with thin linear features and occasional small nodes. In the transition zone near the middle of the county, the hard-surface pattern becomes more fragmented, which matches the shift from dense suburban development toward forest and open land.
The map can help explain where stormwater planning, road networks, and dense development overlap at a county scale, but it is not a drainage model. A darker pixel does not state that flooding occurs there, nor does it show pipe capacity, culverts, detention facilities, or a parcel’s required stormwater controls. Columbia County’s planning and plan-review pages should be used for current zoning, development review, floodplain, and stormwater requirements.
It is also useful to compare this image with the forest view. Some areas classified as developed on the countywide map contain only moderate impervious percentages, while the most urbanized eastern areas contain much denser hard-surface clusters. That difference prevents a common mistake: treating every developed land-cover cell as if it were completely paved or built over.
The 1985–2025 comparison records a large developed conversion in the east
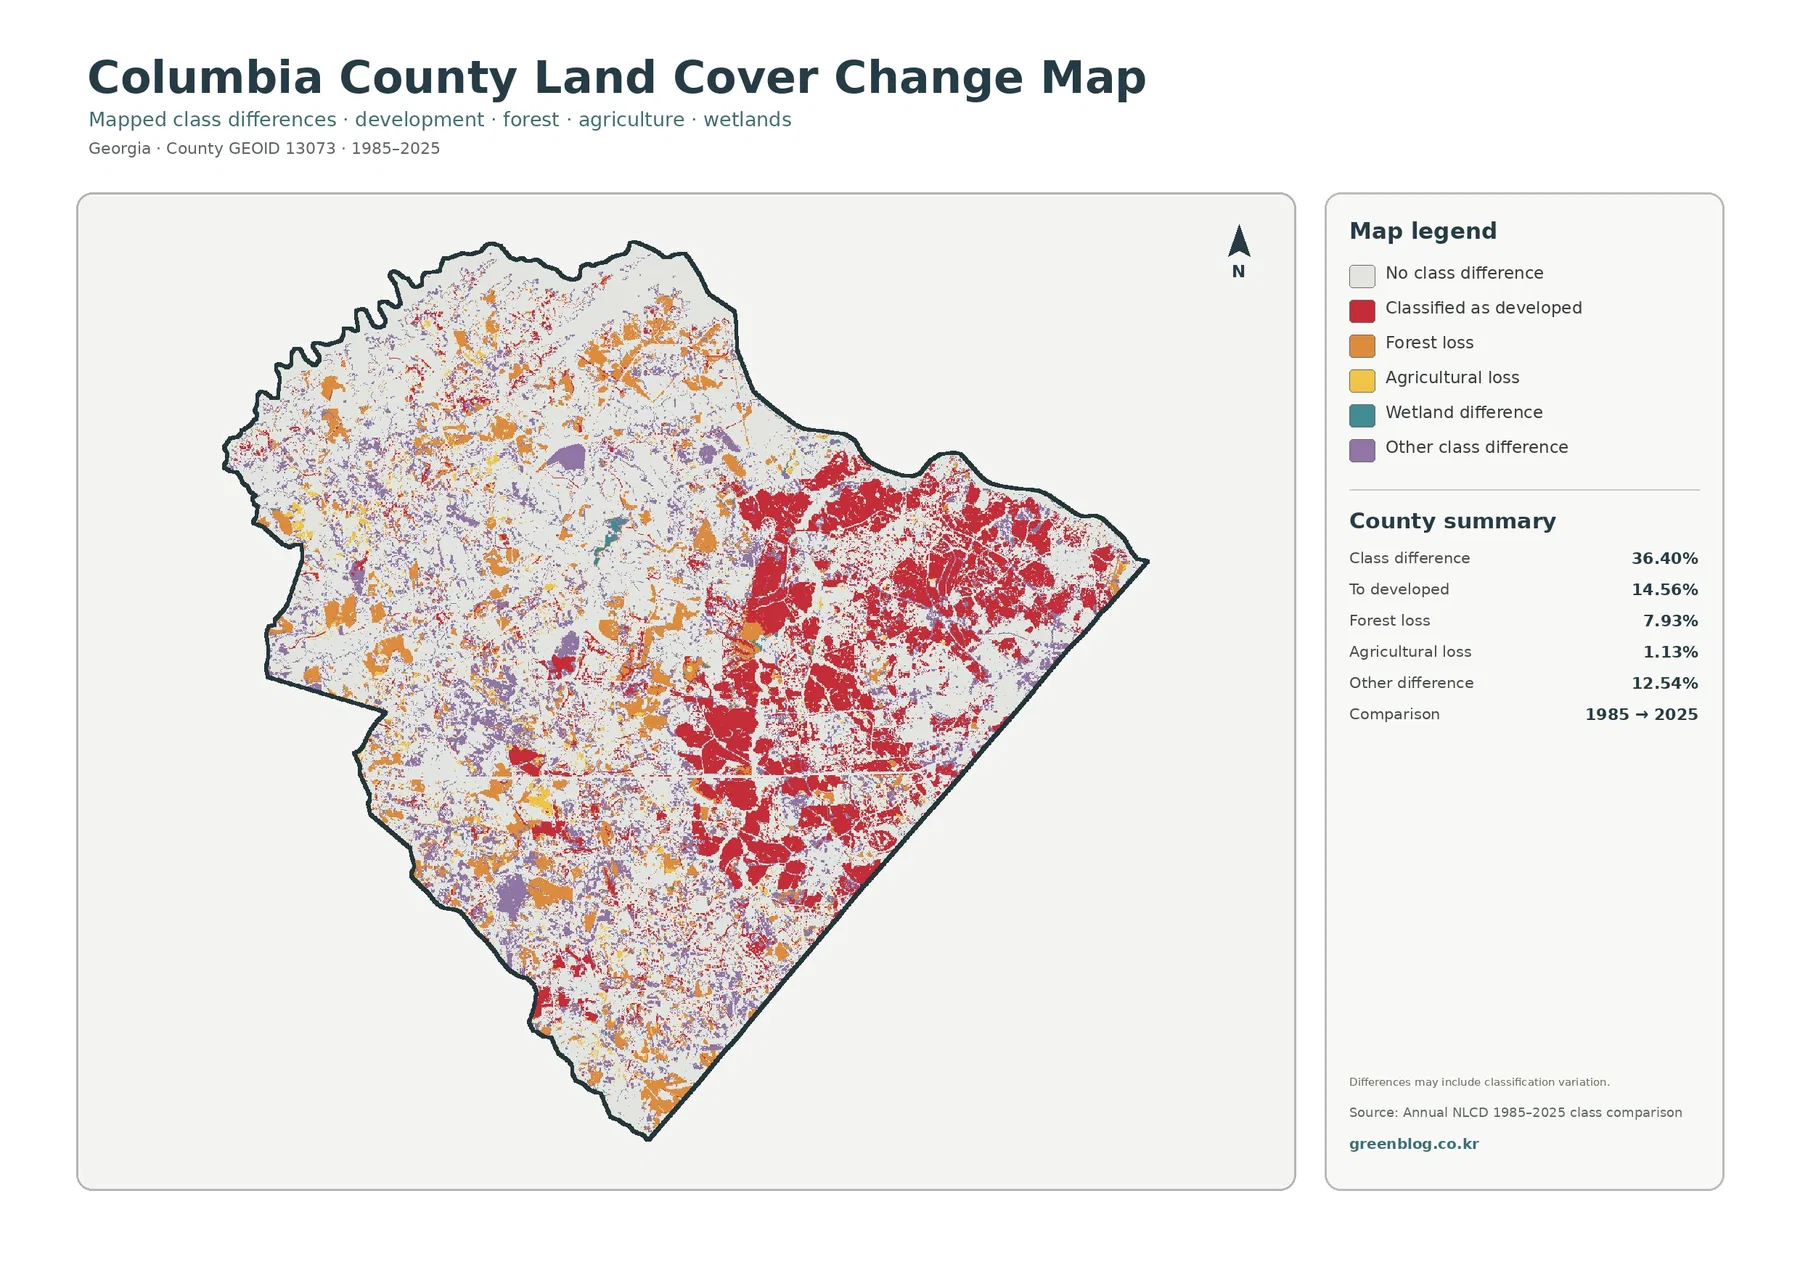
The endpoint comparison marks 36.40% of the county as having a different mapped class in 2025 than in 1985. Conversion to developed is the largest named component at 14.56%. Forest loss accounts for 7.93%, agricultural loss for 1.13%, and other class difference for 12.54%. The remaining colored cells include wetland differences, while large white areas indicate no class difference between the two endpoints.
Red conversion-to-developed cells are especially extensive across the eastern half. Their concentration lines up broadly with the same side of the county that now has the largest developed and impervious footprint. This makes the change map useful for describing long-term expansion of developed cover at a regional scale. It does not, however, provide the construction date of a subdivision, road, shopping area, or individual building.
Western Columbia County tells a more mixed story. Orange forest-loss cells and purple other-class differences are scattered through wooded areas, with smaller red developed conversions and yellow agricultural losses. That is why the 36.40% total should never be described as the share of the county that became urban. Less than half of the total is specifically categorized as conversion to developed, and the comparison can include classification variation.
The forest-loss category also requires restraint. A pixel assigned to forest in 1985 and another class in 2025 does not identify the cause or the year of change. Timber harvest, land clearing, development, agricultural conversion, vegetation recovery cycles, or classification differences can all require closer investigation. Intermediate-year imagery and local records are necessary before attaching a specific explanation to one location.
Current county planning documents serve a different purpose from this historical comparison. Columbia County’s Foundations for the Future comprehensive plan addresses goals for growth and development and includes participation from Grovetown, Harlem, and other local interests. The land-cover change map looks backward at two classified surfaces. It should not be used as a forecast of where future zoning or development approvals will occur.
Choosing the right map for a county profile or local comparison
The 2025 land-cover map is the best starting image when a document needs the whole county in one view. It quickly communicates the three major pieces of Columbia County’s landscape: a forested west, a large northern water edge, and a built-up east. The forest-and-farmland image is better when the discussion moves to natural cover, smaller agricultural blocks, wetlands, or the landscape around Clarks Hill Lake.
For an urban-development discussion, the impervious map adds information that the general red developed class cannot provide. It distinguishes the hard-surface core from developed places that still contain considerable vegetation or open ground. The 1985–2025 comparison is most useful as a final layer when the reader needs to see where endpoint classes differ and how strongly conversion to developed is concentrated on the eastern side.
Keeping the maps together also improves interpretation of the percentages. Developed cover at 25.54% does not mean one quarter of the county is pavement. Forest at 49.60% does not mean every forested cell belongs to one continuous woodland. Water at 6.47% is strongly influenced by the large northern reservoir rather than being evenly distributed. Each percentage becomes more meaningful when the reader can see its location.
For classroom use, a useful sequence is to ask students to identify the water first, then compare western forest with eastern development, and finally check whether the impervious and change maps reinforce that pattern. In a planning presentation, the same four images can be used to separate current surface cover from hard-surface intensity and historical class difference. The key is to keep the legends and observation years visible so the maps are not mistaken for one another.
Download files, scale, and limits of the source data
The download contains four original JPG maps: 2025 land cover, forest and farmland, impervious surface and developed land, and 1985–2025 land-cover change. Each image measures 2480 × 1754 pixels. The package does not identify these files as meeting an A3 high-resolution reference, so large poster printing should be tested before the images are used at an enlarged size.
Annual NLCD is a raster product built from 30-meter cells. A cell receives a predominant class even when trees, grass, pavement, roofs, and other surfaces occur together. Zooming in makes the cells larger on screen but does not create parcel lines or building outlines that were absent from the source. Mixed pixels are especially important near shorelines, narrow roads, development edges, and small patches of vegetation.
The 2025 maps are also a snapshot of the supplied observation year. Later construction, clearing, vegetation growth, lake-level conditions, or land-management changes may not appear. For property decisions, zoning, ownership, permits, or site design, use the county’s current Maps Online, zoning information, plan-review records, and other authoritative local sources rather than relying on this map set alone.
Frequently Asked Questions
What is the largest 2025 land-cover class in Columbia County?
Forest is the largest class at 49.60%. Developed land follows at 25.54%. The two are not evenly mixed: broad forest dominates much of the west, while developed cover is far more continuous across the eastern and southeastern side of the county.
Why is developed cover 25.54% when mean impervious cover is 7.53%?
Developed land-cover classes can include lawns, trees, soil, and other permeable surfaces around homes, offices, roads, and commercial sites. Impervious cover focuses on hard surfaces such as rooftops and pavement. Only 4.60% of the county is mapped at 50% or greater impervious cover.
Does the 36.40% class difference mean that more than one-third of the county became developed?
No. Conversion to developed accounts for 14.56%. The total also includes 7.93% forest loss, 1.13% agricultural loss, 12.54% other class difference, wetland differences, and possible classification variation. The map compares two endpoints rather than documenting every change year.
Sources and Reference Data
- MRLC Annual NLCD Data – official access point for annual land-cover and comparison products
- USGS Annual NLCD Land Cover Classification – definitions and guidance for forest, developed land, agriculture, water, wetlands, and related classes
- U.S. Census Bureau TIGER/Line Shapefiles – official county-boundary reference for Columbia County
- Columbia County Foundations for the Future – official comprehensive-planning information for county growth and development
- Columbia County Stormwater FAQ – local context for urban and suburban development in Martinez, Evans, and nearby watersheds
- UGA Cooperative Extension – Columbia County Agriculture & Natural Resources – local agriculture and natural-resource programming
- Visit Columbia County – Clark’s Hill Lake – local reference for the major reservoir along Columbia County’s northern side
Map File Information
The ZIP contains four original JPG maps for comparing Columbia County's western forest, Clarks Hill Lake water, eastern hard surfaces, and 1985–2025 land-cover class differences.
- Included Files: Use only the versions confirmed in the article and supplied images
- File Type: Use the confirmed download contents
- Intended Use: Printing, education, presentations, and map-based projects
Related Maps
- Appling County Georgia Land Cover Map
- Atkinson County Georgia Land Cover Map
- Bacon County Georgia Land Cover Map
Green Map creates custom-edited map images using open geographic data sources such as geoBoundaries, Natural Earth, OpenStreetMap, and government open data.
These maps are edited visual materials, not raw data files, and are provided for education, documents, presentations, and graphic reference.