Clay County in southwest Georgia has a land-cover pattern that changes quickly from the broad water along its western side to forest and working farmland farther inland. In the supplied 2025 data, forest is the largest class at 41.21%, followed by agriculture at 24.47%, open water at 10.00%, and wetlands at 7.65%. This Clay County Georgia Land Cover Map set makes it easy to compare the Lake Walter F. George and Chattahoochee River edge, the small developed footprint around Fort Gaines, and the larger farm and forest blocks to the east and south.
The page includes a 2025 land-cover view, a forest-and-farmland view, an impervious-surface map, and a 1985–2025 class-difference map. The WebP previews are placed with the discussion, while the four original 2480 × 1754-pixel JPG maps are available together in one ZIP. They can be used for county profiles, classroom materials, environmental comparisons, and presentations that need a clear picture of how water, woods, agriculture, and developed surfaces are arranged.
Table of Contents
A broad western water edge gives way to forest and farm country inland
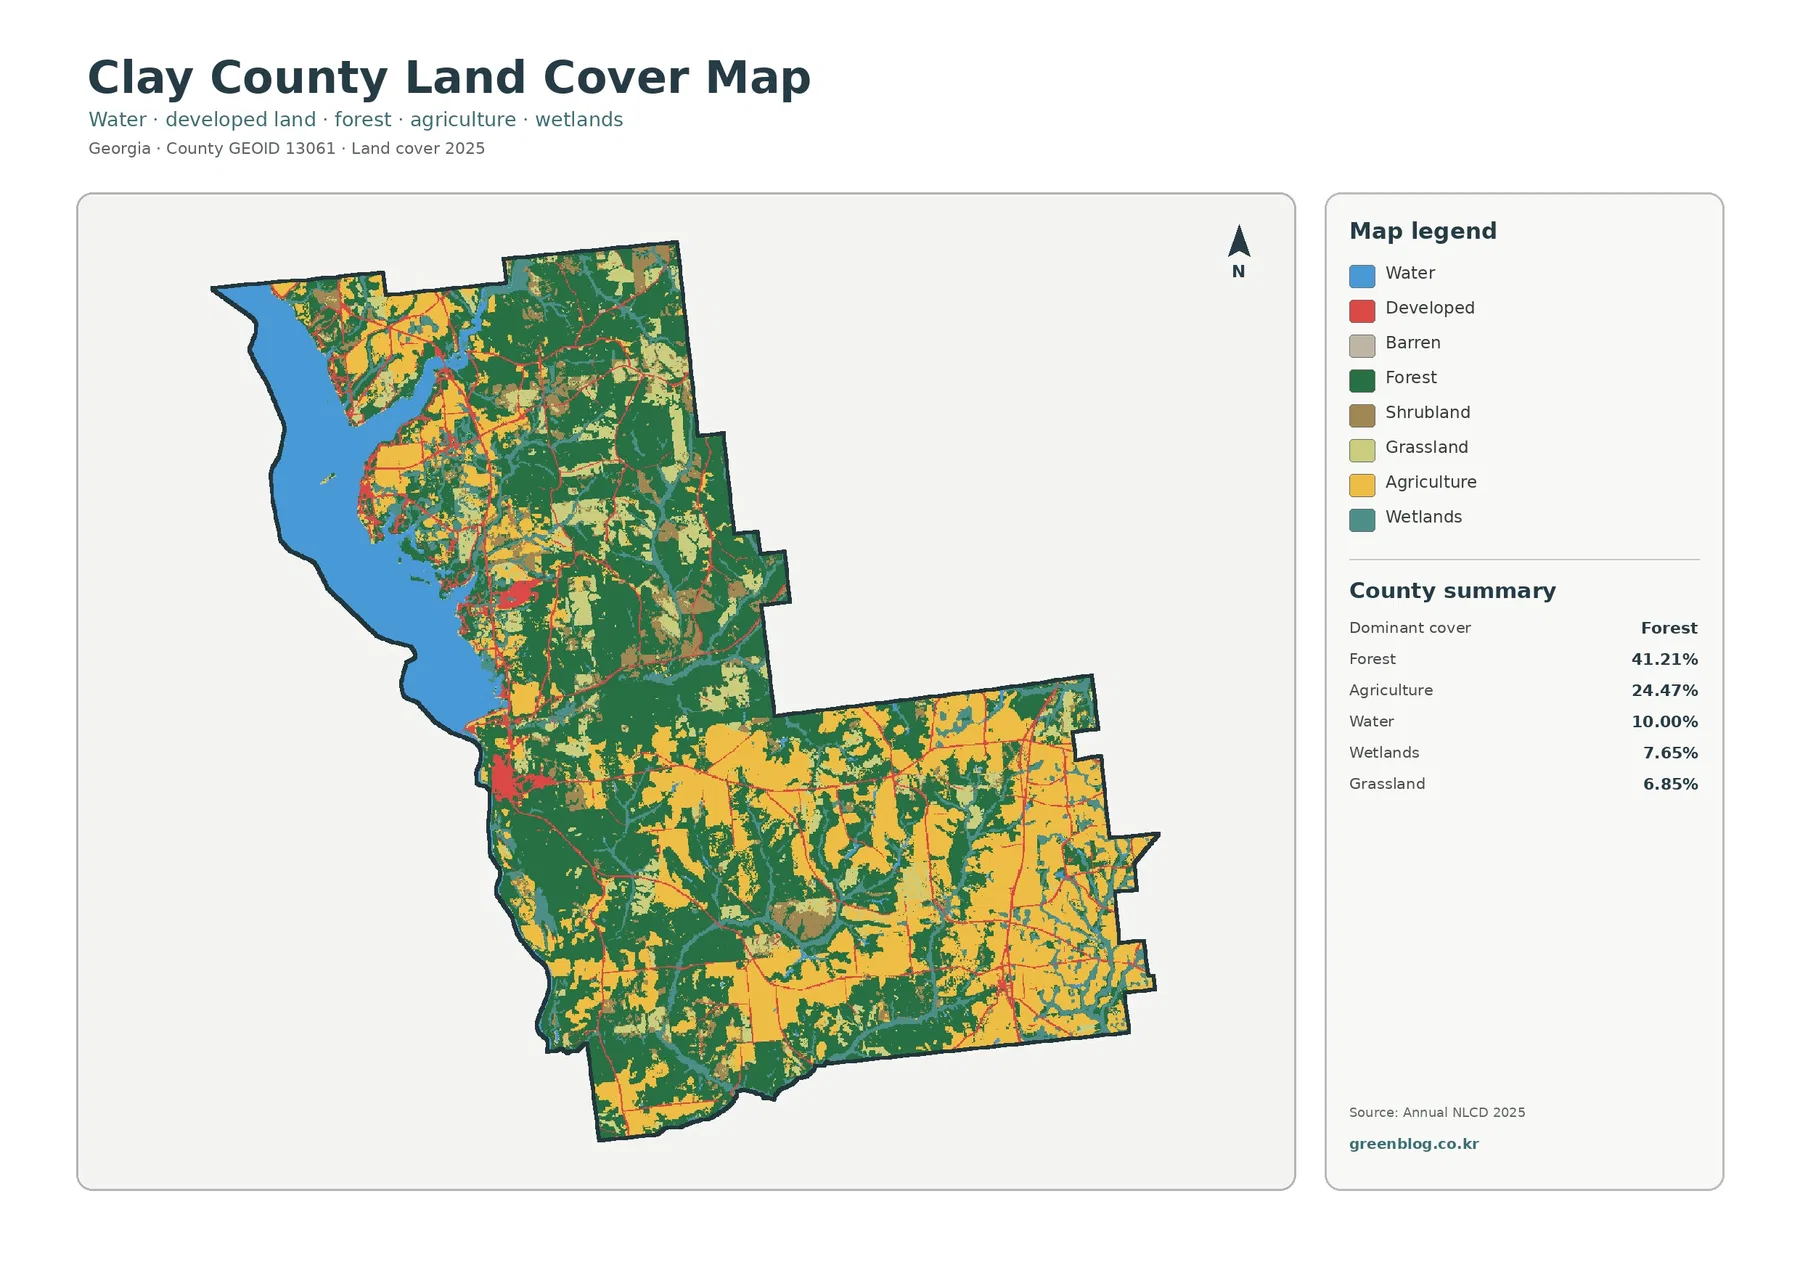
The first feature that stands out is the large blue area on the west. Clay County borders the Chattahoochee River and Lake Walter F. George, and Georgia planning documents for the county repeatedly treat the river and reservoir as major natural features around Fort Gaines. On the map, water occupies a much larger share of the western side than it does in most of the interior. Forest, wetlands, and cultivated land meet the shoreline in a complicated edge rather than forming one simple band.
Forest covers 41.21% of the mapped county, making it the dominant 2025 class. Agriculture accounts for 24.47%, water 10.00%, wetlands 7.65%, grassland 6.85%, and shrubland 4.90%. Those numbers match the visible division of the map: large dark-green blocks occur through much of the northern section and parts of the southwest, while broad yellow farm areas become more common across the eastern and southeastern interior. No single land-cover type fills the whole county, so the most useful description is a mix of forested uplands, farm country, reservoir and river water, and smaller wet or developed areas.
Developed land is present, but it does not form a large continuous urban field. Red cells gather most clearly near the western middle of the county, close to Fort Gaines, and then appear as smaller patches and narrow lines elsewhere. The county’s official offices and its UGA Extension office are located in Fort Gaines, which helps identify that cluster as the principal local center. The eastern half is much more strongly defined by agriculture and forest than by built cover.
Water and wetlands should be read separately. The blue class represents exposed water surfaces, while wetland classification can include vegetated ground that is regularly influenced by water. Teal wetland cells occur along parts of the western shore and also trace smaller interior low areas. These colors are useful for comparing broad surface conditions, but they are not legal wetland boundaries, flood-insurance zones, or parcel-level determinations. A site-specific question still requires current local records and more detailed environmental data.
Northern woods and eastern farm blocks become clearer when development is muted
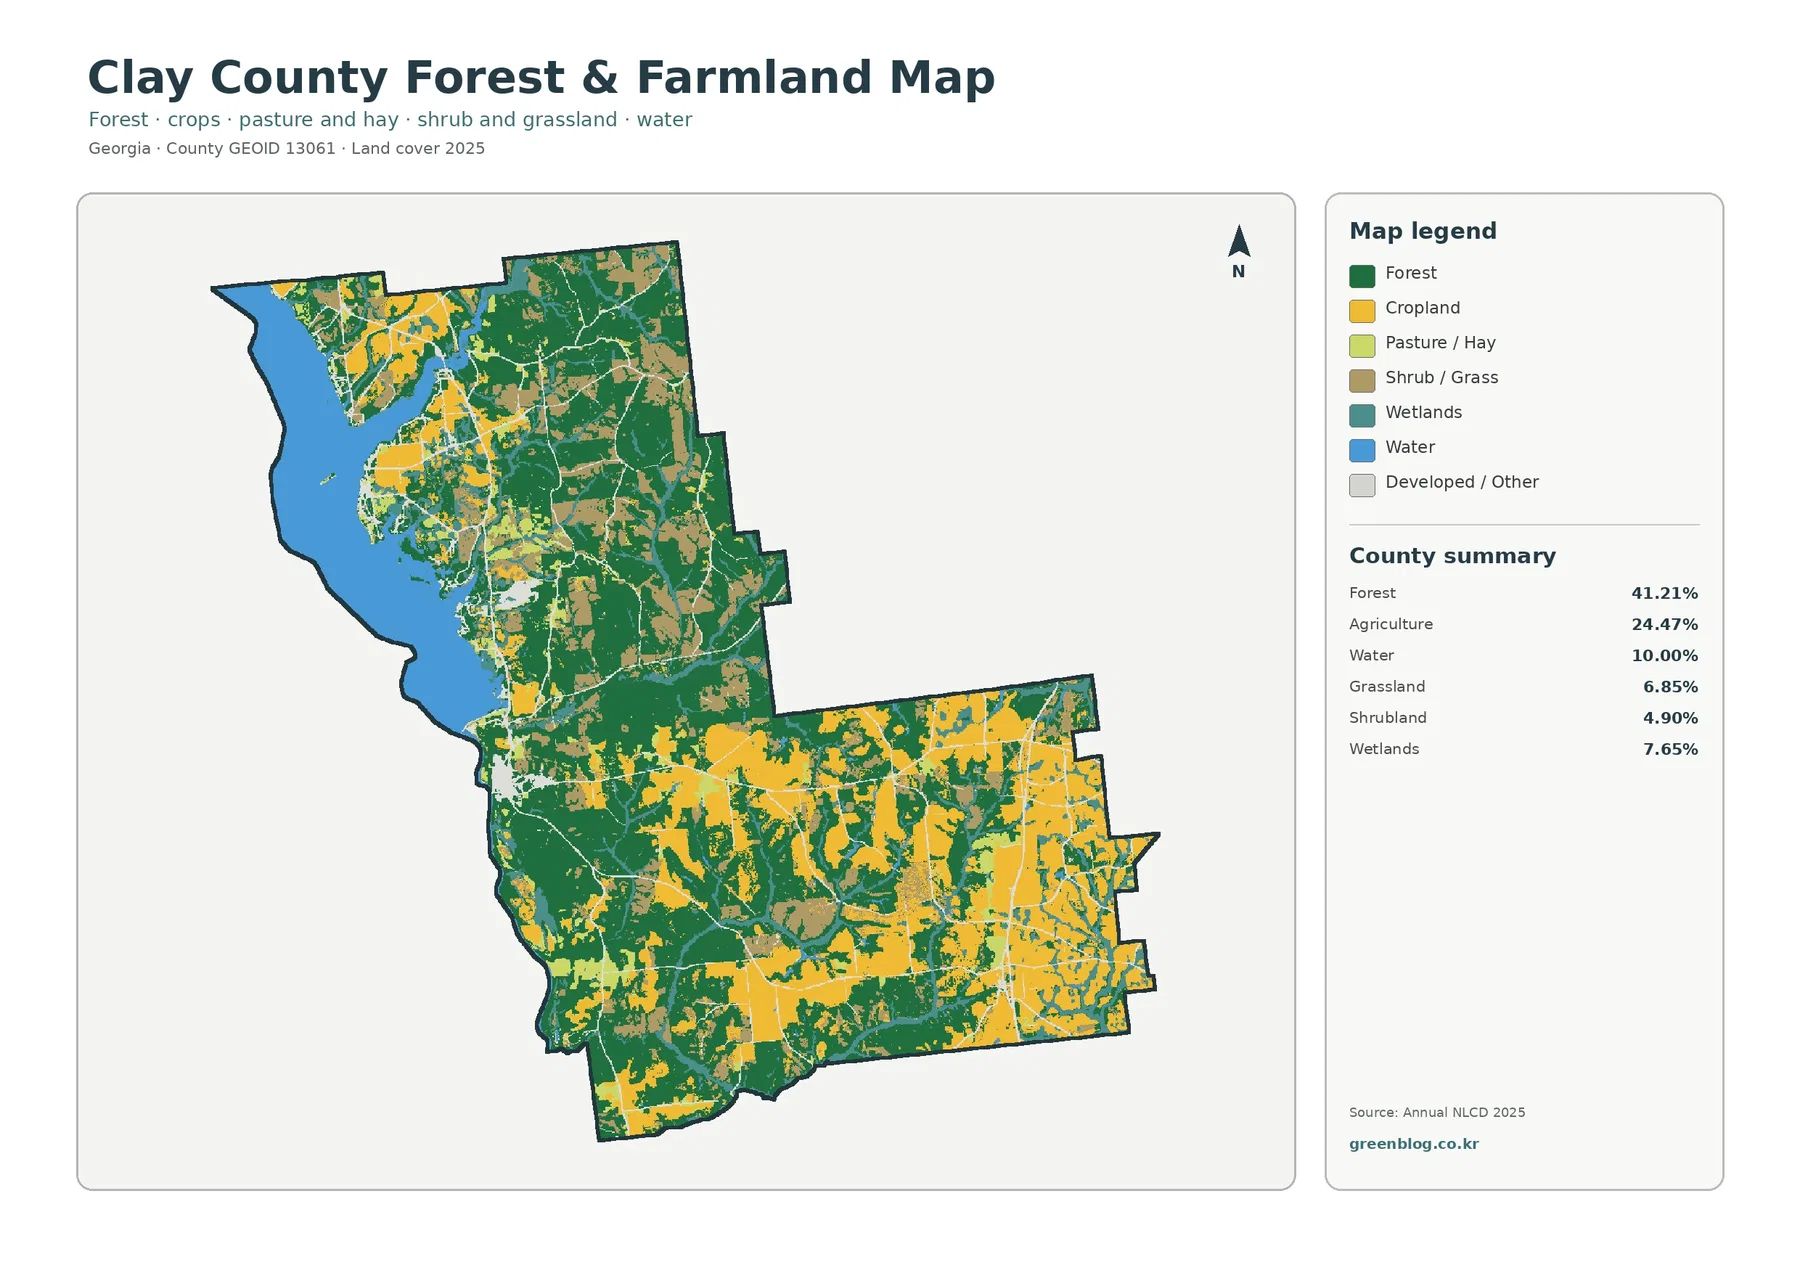
Removing most of the developed-color emphasis makes the rural pattern much easier to see. The long northern part of Clay County contains large connected areas of forest, with farm fields appearing between them and near the reservoir side. Farther south, forest remains important through the western and central interior, but yellow agricultural blocks become much larger toward the east and southeast. The map therefore shows two different rural settings within a relatively small county: more continuous woods in several northern and western areas, and larger farm blocks across much of the eastern half.
Agriculture’s 24.47% share is substantial, and it is visible in blocks rather than a thin scattering of isolated cells. Large yellow areas are especially noticeable in the southeast, while smaller fields occur in the northwestern interior and around the middle of the county. UGA Extension maintains an Agriculture and Natural Resources program for Clay County, and its local material includes production-agriculture resources. That local context supports describing farming as an important part of the county, although the map itself cannot identify individual crops, farm ownership, or the legal use of a parcel.
Grassland at 6.85% and shrubland at 4.90% add another layer to the forest-farm mix. These classes appear in smaller patches between woods and agricultural areas, especially through parts of the north and center. A 30-meter land-cover cell receives one predominant class, so an area containing trees, grass, a field edge, and a narrow road may be simplified to just one category. For that reason, the map is strongest as a county-scale comparison rather than a detailed vegetation inventory.
The western water edge is also easier to interpret in this view because the surrounding natural classes are separated. Forest and wetland cells meet the Lake Walter F. George shoreline in many places, while cultivated land becomes more extensive as the view moves inland. Georgia’s 2019 joint comprehensive-plan update for Clay County notes that wetlands, soils, slopes, and the Chattahoochee River are natural factors relevant to local development decisions. The land-cover map does not decide where development may occur, but it does show why the river-reservoir edge and the interior farm landscape need to be discussed as different settings.
An average impervious share of 0.80% keeps the hard-surface footprint very small
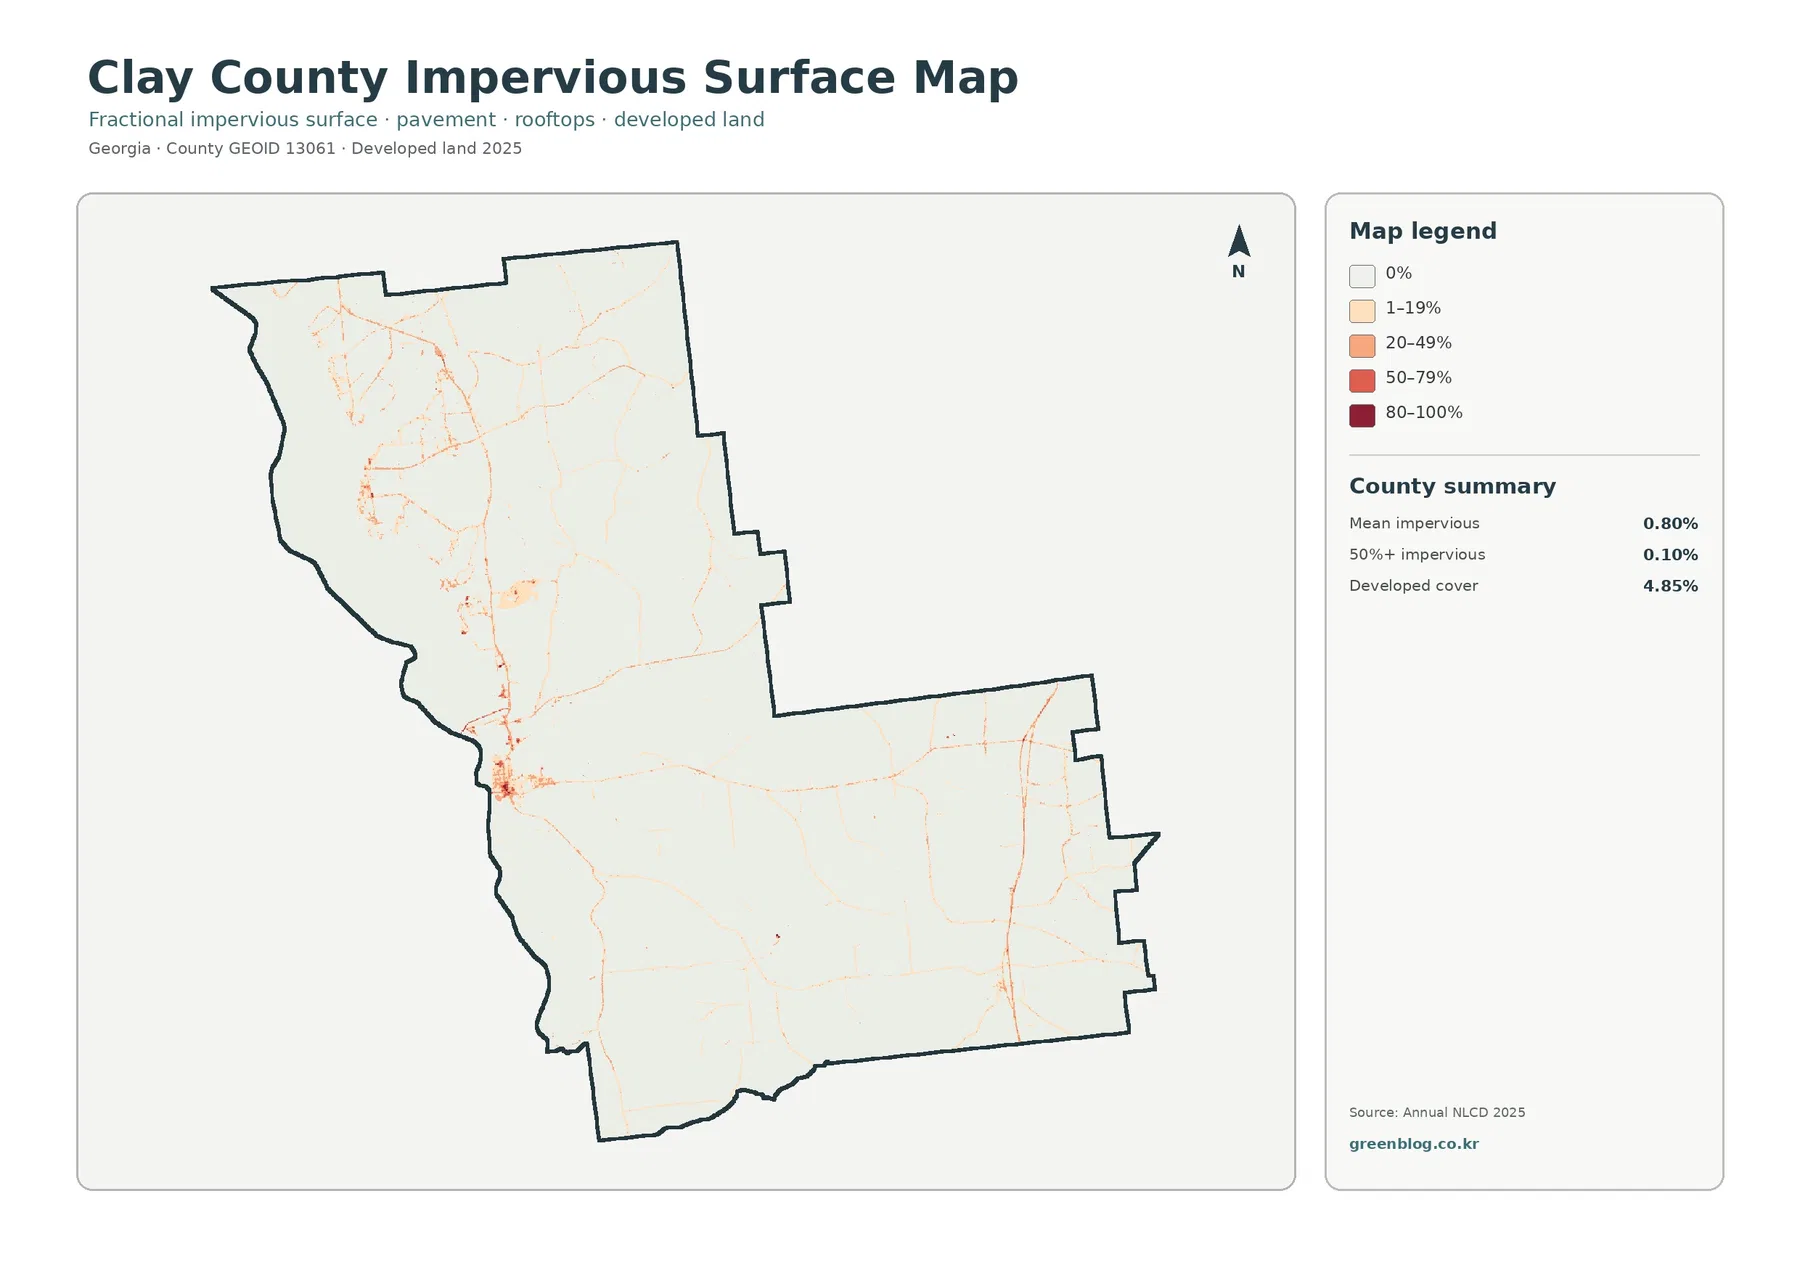
Impervious surface means pavement, rooftops, parking areas, and similar materials that do not readily absorb rainfall. Clay County’s mean impervious share is only 0.80%, and just 0.10% of the mapped area falls into cells that are at least 50% impervious. Developed cover is higher at 4.85% because a developed land-cover class can include lawns, trees, bare soil, and other permeable surfaces around buildings and roads. The difference between 4.85% developed cover and 0.80% mean imperviousness is therefore expected rather than contradictory.
The darkest concentrations occur near the western-middle part of the county, where Fort Gaines is located. From there, thin lines of low-to-moderate impervious cover follow the road network, and another long linear feature is visible in the eastern half. An older Georgia DCA planning document describes Georgia Highway 39 along the Chattahoochee and Lake Walter F. George and U.S. 27 through the eastern part of the county. The impervious map does not label those roads, so the image should not be used as a transportation map, but the local road context helps explain why hard surfaces appear as narrow lines instead of broad urban blocks.
This view is especially useful for separating a small town center from the much larger rural landscape around it. The countywide land-cover map shows where developed classification occurs; the impervious map narrows that information to places with actual hard surfaces. Most of the county remains nearly white or very pale, while a limited number of orange and red pixels identify roads, buildings, and compact clusters. That contrast is more informative than simply saying that Clay County is rural because it shows where the exceptions are.
Impervious percentage is not a flood-risk score. Runoff also depends on slope, drainage systems, soil, rainfall intensity, nearby streams, and reservoir or river levels. The map can help a reader locate comparatively hard surfaces, but it should not be used by itself to determine drainage capacity, flood exposure, property value, or whether a site can be developed.
The 1985–2025 comparison is driven more by forest and other class differences than by new development
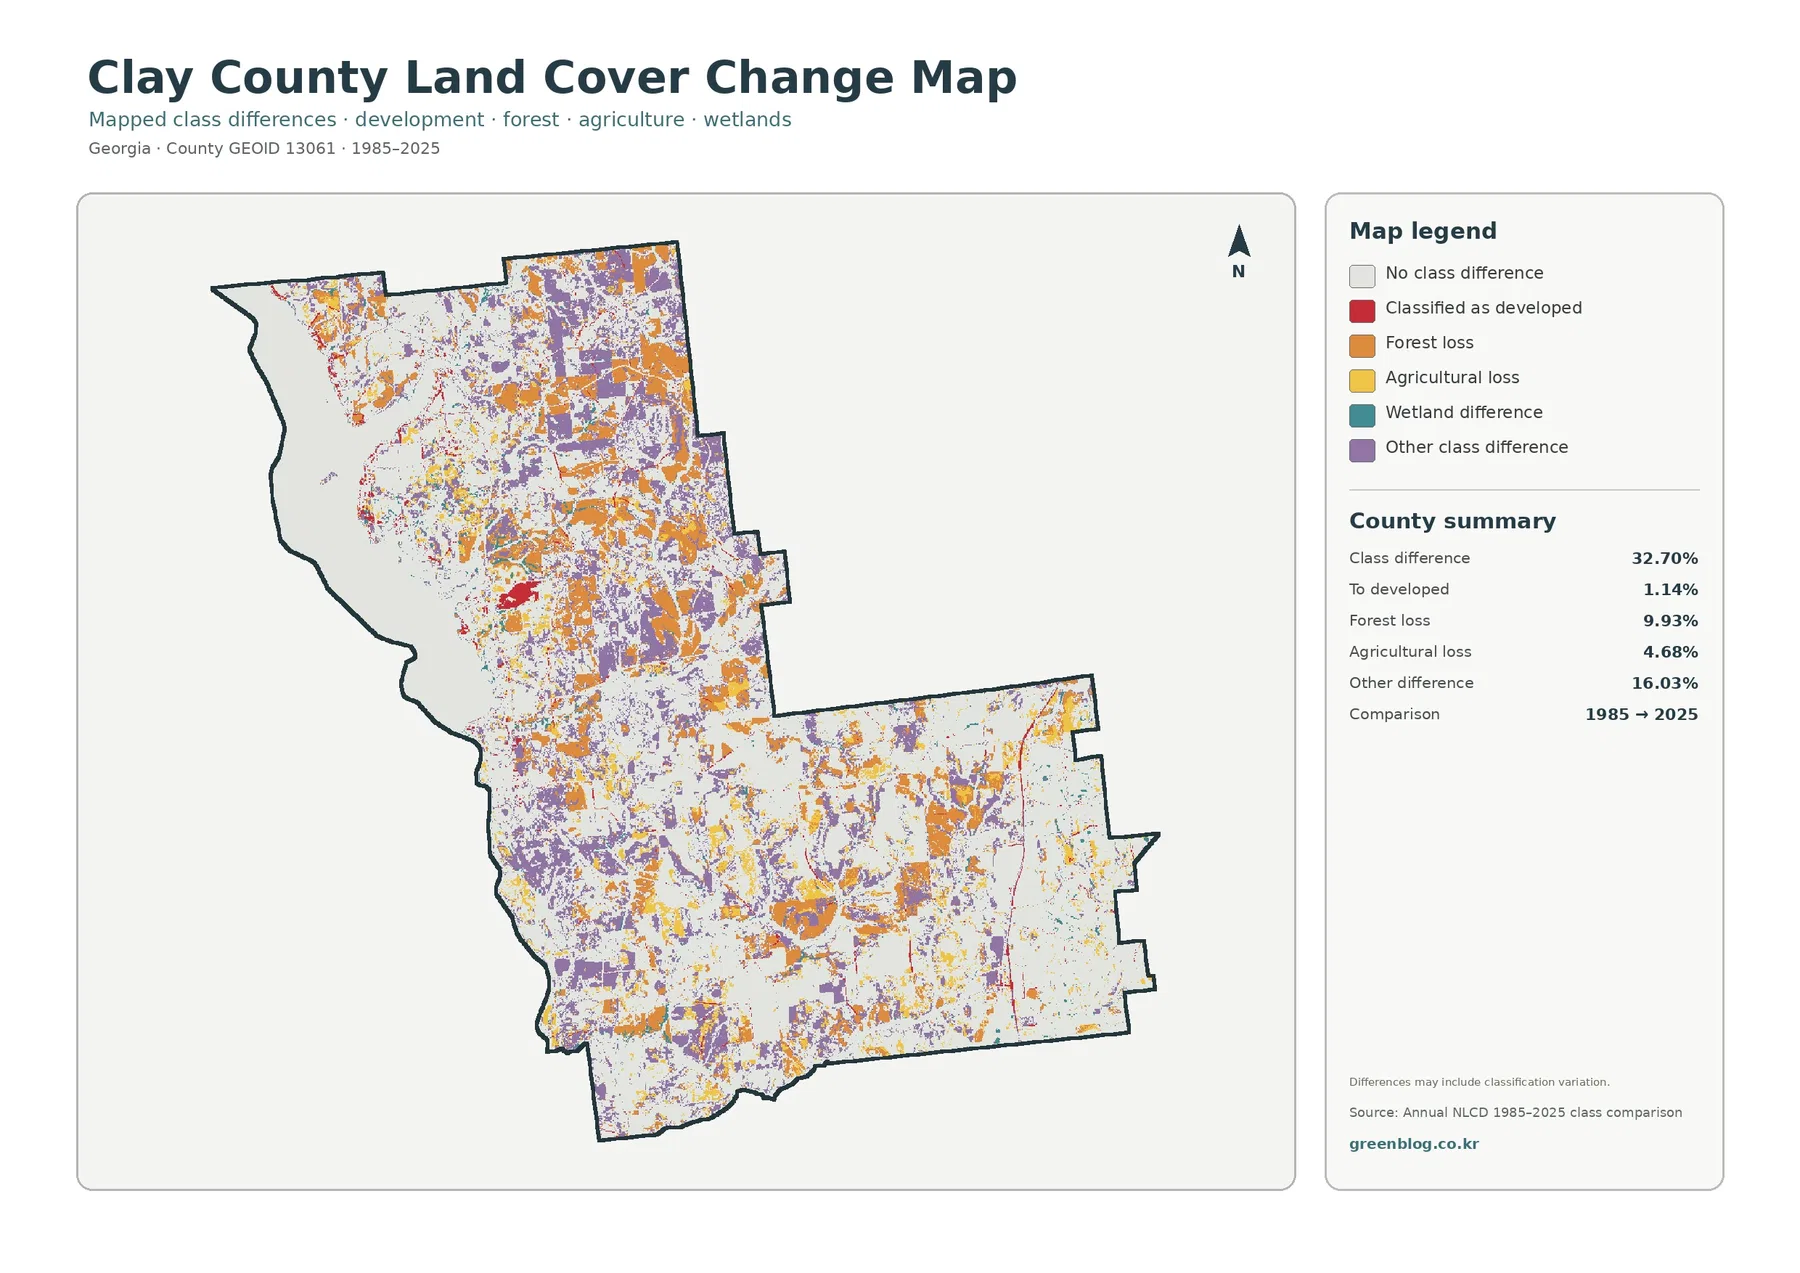
Across Clay County, 32.70% of cells have a different mapped class in 2025 than in 1985. The largest listed category is “other difference” at 16.03%, followed by forest loss at 9.93% and agricultural loss at 4.68%. Cells that end in a developed class account for 1.14%. Orange forest-loss and purple other-difference cells appear across both the northern and southern sections, while red developed outcomes remain much more localized near Fort Gaines and along a few narrow corridors.
That 32.70% figure is not the share of the county that was destroyed, cleared, or urbanized. It only means that the class assigned to a 30-meter cell differs between the two endpoints. Real changes such as timber harvest, regrowth, farm conversion, changing wet conditions, or construction can contribute, but classification variation and mixed surfaces can also produce differences. The map itself warns that class differences may include classification variation.
The 9.93% forest-loss category also should not be translated directly into developed acreage. It identifies cells that were forest at the 1985 endpoint and received another class at the 2025 endpoint. The later class might be agriculture, grassland, shrubland, developed land, or something else. Since only 1.14% of the county is specifically summarized as changing to developed, the change map is better described as a broad rearrangement of several land-cover classes than as a simple story of urban expansion.
For a project that needs the timing of a change, use this map as a screening layer. First locate a cluster of orange, purple, yellow, teal, or red cells, then compare intermediate Annual NLCD years, historical aerial photographs, and local records. Two endpoint years can show where a difference exists, but they cannot identify the exact year or cause of every change.
Choosing the right map for the reservoir shore, Fort Gaines, or the farm interior
For a general explanation of the county, start with the 2025 land-cover map. It places the large western water body, forest, agriculture, wetlands, and developed land on the same page, so a reader can immediately see how different the reservoir side is from the inland east. Add the forest-and-farmland view when the purpose is to focus on rural surfaces rather than settlements.
Fort Gaines is easier to explain by pairing the countywide map with the impervious-surface map. The first shows the developed class in relation to forest and farms; the second reveals that the actual hard-surface concentration is much smaller and follows streets and facilities. With a mean impervious share of 0.80%, this pairing avoids giving the impression that 4.85% developed cover means 4.85% of the county is pavement or rooftops.
The eastern and southeastern interior is better served by the forest-and-farmland view because the large agricultural blocks stand out clearly after developed and other surfaces are muted. For a historical comparison, pair that present-day view with the 1985–2025 class-difference map. “Where is farmland now?” and “Which cells changed class between 1985 and 2025?” are different questions, and using the correct image keeps those ideas separate.
A presentation usually reads better with one or two maps chosen for a specific question instead of all four placed at the same size. A reservoir-and-rural-landscape slide can use the countywide and forest/farmland maps. A Fort Gaines development slide can use the countywide and impervious maps. A long-term-change slide can use the current land-cover map beside the change map. The four-map download makes those combinations available without forcing every image into every project.
Thirty-meter cells and observation years set important limits on what the colors can prove
Annual NLCD works with 30-meter square cells. Each cell is assigned one predominant class even when a field edge, trees, a narrow road, grass, and a building share the same space. Small ponds, narrow roads, irregular shoreline features, and parcel boundaries can therefore appear simplified. Zooming enlarges the pixels but cannot create parcel-level detail that was not present in the source data.
The current maps represent the supplied 2025 observation year. Construction, harvest, timber activity, vegetation recovery, and changes in water or wetland conditions after that observation may not appear. This is particularly important near the reservoir and river, where visible water and vegetation conditions can vary. When current site conditions matter, combine the maps with recent aerial imagery, local GIS records, and field information.
Land cover is also different from land use and zoning. Land cover describes what the surface is classified as from remotely sensed data—forest, agriculture, water, wetlands, developed cover, and similar classes. Land use and zoning address how land is used, planned, or legally regulated. Georgia DCA planning documents and Clay County administrative records can provide that planning context, but a land-cover color should never be treated as a zoning designation or a statement about ownership or development rights.
Files included in the four-map JPG download
The ZIP contains one original JPG for 2025 land cover, forest and farmland, impervious surface and developed land, and 1985–2025 land-cover change. Each file measures 2480 × 1754 pixels. They are suitable for on-screen reference, ordinary documents, lessons, and presentation graphics. The package does not identify the images as meeting an A3 high-resolution reference, so a test print is recommended before large-format use.
Frequently Asked Questions
What is the largest land-cover class in Clay County in 2025?
Forest is the largest class at 41.21%, followed by agriculture at 24.47%. Open water is also important at 10.00%, reflecting the large western water area associated with Lake Walter F. George and the Chattahoochee River edge.
Why is developed cover 4.85% while mean impervious cover is only 0.80%?
A developed land-cover class can include lawns, trees, soil, and other permeable surfaces around buildings and roads. Impervious cover isolates hard materials such as pavement and rooftops, so its countywide mean is much lower. The map shows the strongest hard-surface concentration near Fort Gaines and along a limited road network.
Does the 32.70% class difference mean that one-third of Clay County was developed after 1985?
No. The 32.70% figure includes every cell whose mapped class differs between the 1985 and 2025 endpoints. Only 1.14% is summarized as changing to a developed class; the rest includes forest loss, agricultural loss, wetland and other class differences, plus possible classification variation.
Sources and Reference Data
- MRLC Annual NLCD Data – official access point for the land-cover and annual comparison data used in the map set
- USGS Annual NLCD Land Cover Classification – class definitions and guidance for forest, agriculture, wetlands, developed land, water, and related surfaces
- U.S. Census Bureau TIGER/Line Shapefiles – official county-boundary reference for Clay County
- UGA Extension – Clay County Agriculture & Natural Resources – local agriculture and natural-resource information and programs
- Georgia DCA – 2019 Clay County Joint Comprehensive Plan Update – planning context for Fort Gaines, wetlands, and the Chattahoochee River area
- Clay County Board of Commissioners – official county information and Fort Gaines-based county offices
Map File Information
The ZIP contains four original JPG maps for comparing Clay County's forest, farm areas, western water edge, Fort Gaines hard surfaces, and 1985–2025 class differences.
- Included Files: Use only the versions confirmed in the article and supplied images
- File Type: Use the confirmed download contents
- Intended Use: Printing, education, presentations, and map-based projects
Related Maps
- Appling County Georgia Land Cover Map
- Atkinson County Georgia Land Cover Map
- Bacon County Georgia Land Cover Map
Green Map creates custom-edited map images using open geographic data sources such as geoBoundaries, Natural Earth, OpenStreetMap, and government open data.
These maps are edited visual materials, not raw data files, and are provided for education, documents, presentations, and graphic reference.