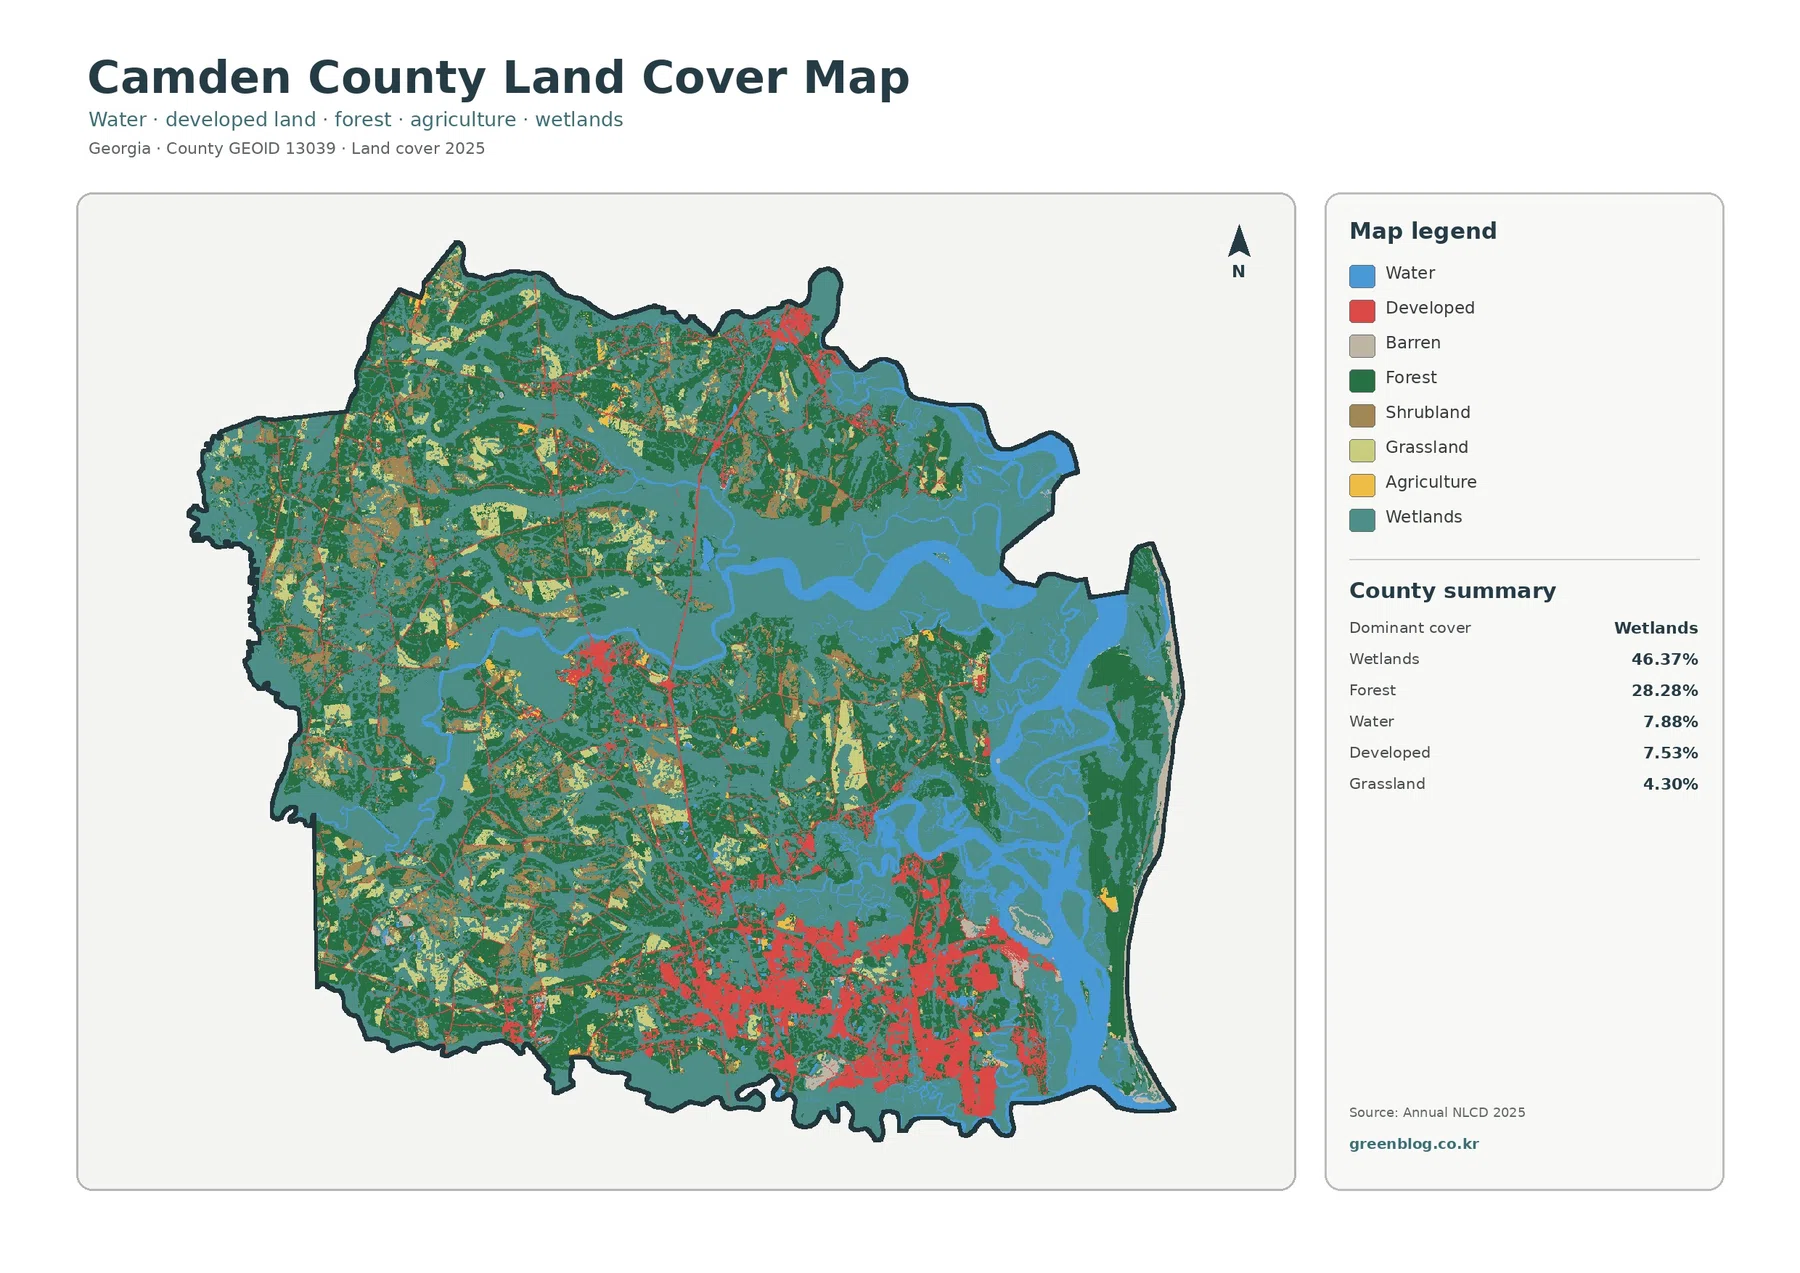
Camden County sits at Georgia’s southeastern corner, where inland forest gives way to broad wetlands, tidal water, developed communities, and the long barrier-island landscape of Cumberland Island. In the supplied 2025 summary, wetlands cover 46.37% of the county, followed by forest at 28.28%, water at 7.88%, and developed land at 7.53%. The four maps on this page make those contrasts easier to separate by showing general land cover, forest and farmland, impervious surfaces, and mapped class differences from 1985 to 2025.
The four original JPG maps are available together in one download near the lower part of the page. Use the general map when you need the broad coastal pattern, the forest-and-farmland map when you want to isolate wooded and open land, the impervious map when the hard-surface footprint matters, and the change map when you want to locate areas whose land-cover class differs between the two comparison years. These maps are county-scale reference products rather than parcel, zoning, ownership, or regulatory wetland maps.
Table of Contents
A county where wetlands occupy nearly half of the 2025 map
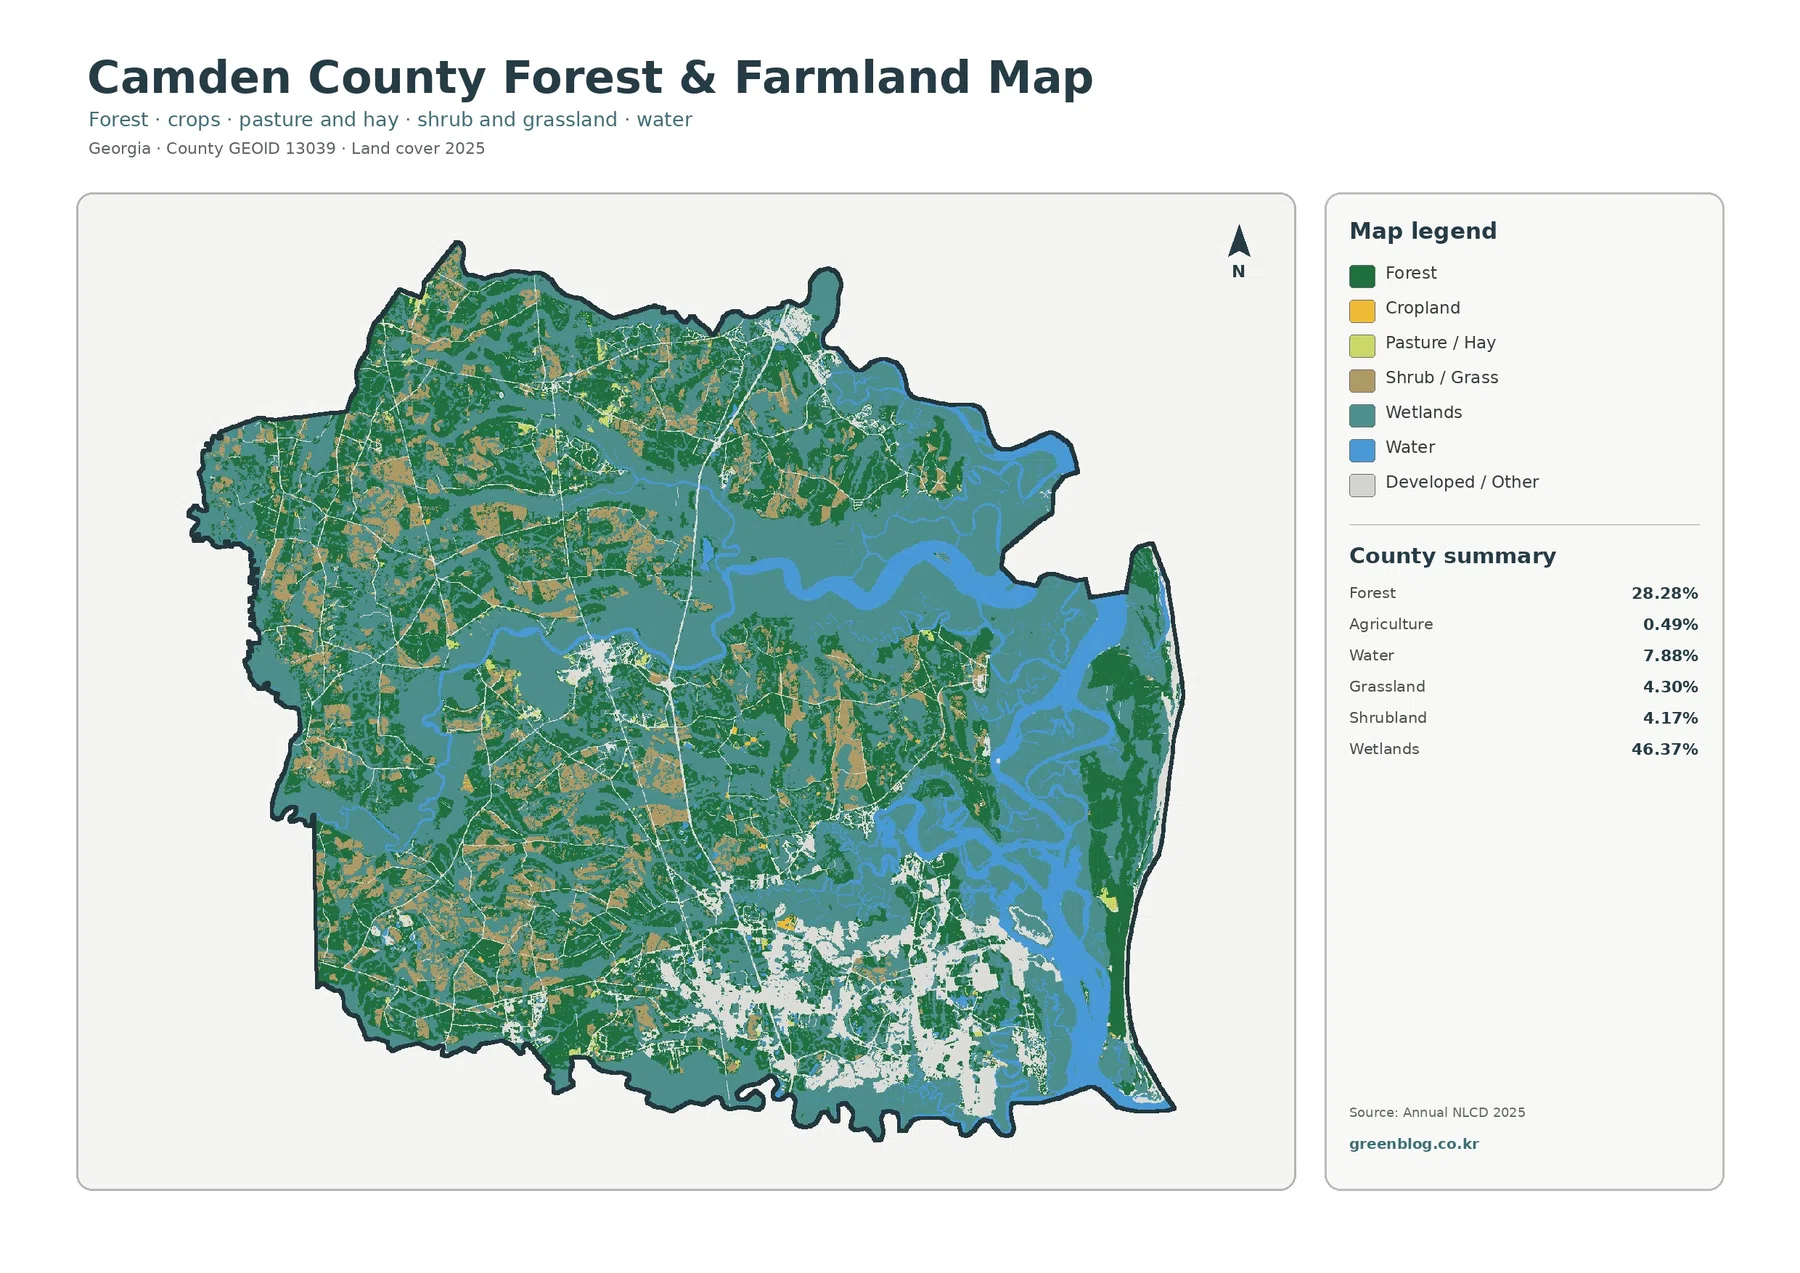
The most important number in Camden County’s 2025 land-cover summary is 46.37% wetlands. That share is large enough to shape the appearance of the entire county map. Teal wetland cover expands across the central and eastern portions of the county, surrounds many water channels, and fills much of the low coastal side. Smaller wetland branches also extend into the wooded interior, so the wet pattern is not confined to a narrow strip along the Atlantic-facing edge.
The general map separates the wet eastern side from the more wooded interior
Start with the general land-cover map if you want to understand Camden County at a glance. Water and wetlands dominate the eastern half, while the western side contains a stronger mix of forest, grassland, shrubland, and small agricultural patches. Open water appears in blue and totals 7.88%, which is substantial but still far below the wetland share. This distinction matters because the coastline can look overwhelmingly aquatic even though most of the teal area is mapped as wetland rather than open water.
Hard surfaces cluster around the southern mainland instead of following the whole shoreline
Impervious surface means pavement, rooftops, parking lots, and other hard surfaces that limit direct infiltration of rainfall. Camden County’s mean imperviousness is 2.03%, while land mapped at 50% or greater imperviousness makes up 0.99%. Developed land cover is higher at 7.53% because developed classes can include lawns, trees, soil, and other permeable surfaces mixed with buildings and pavement. Those values should not be used interchangeably.
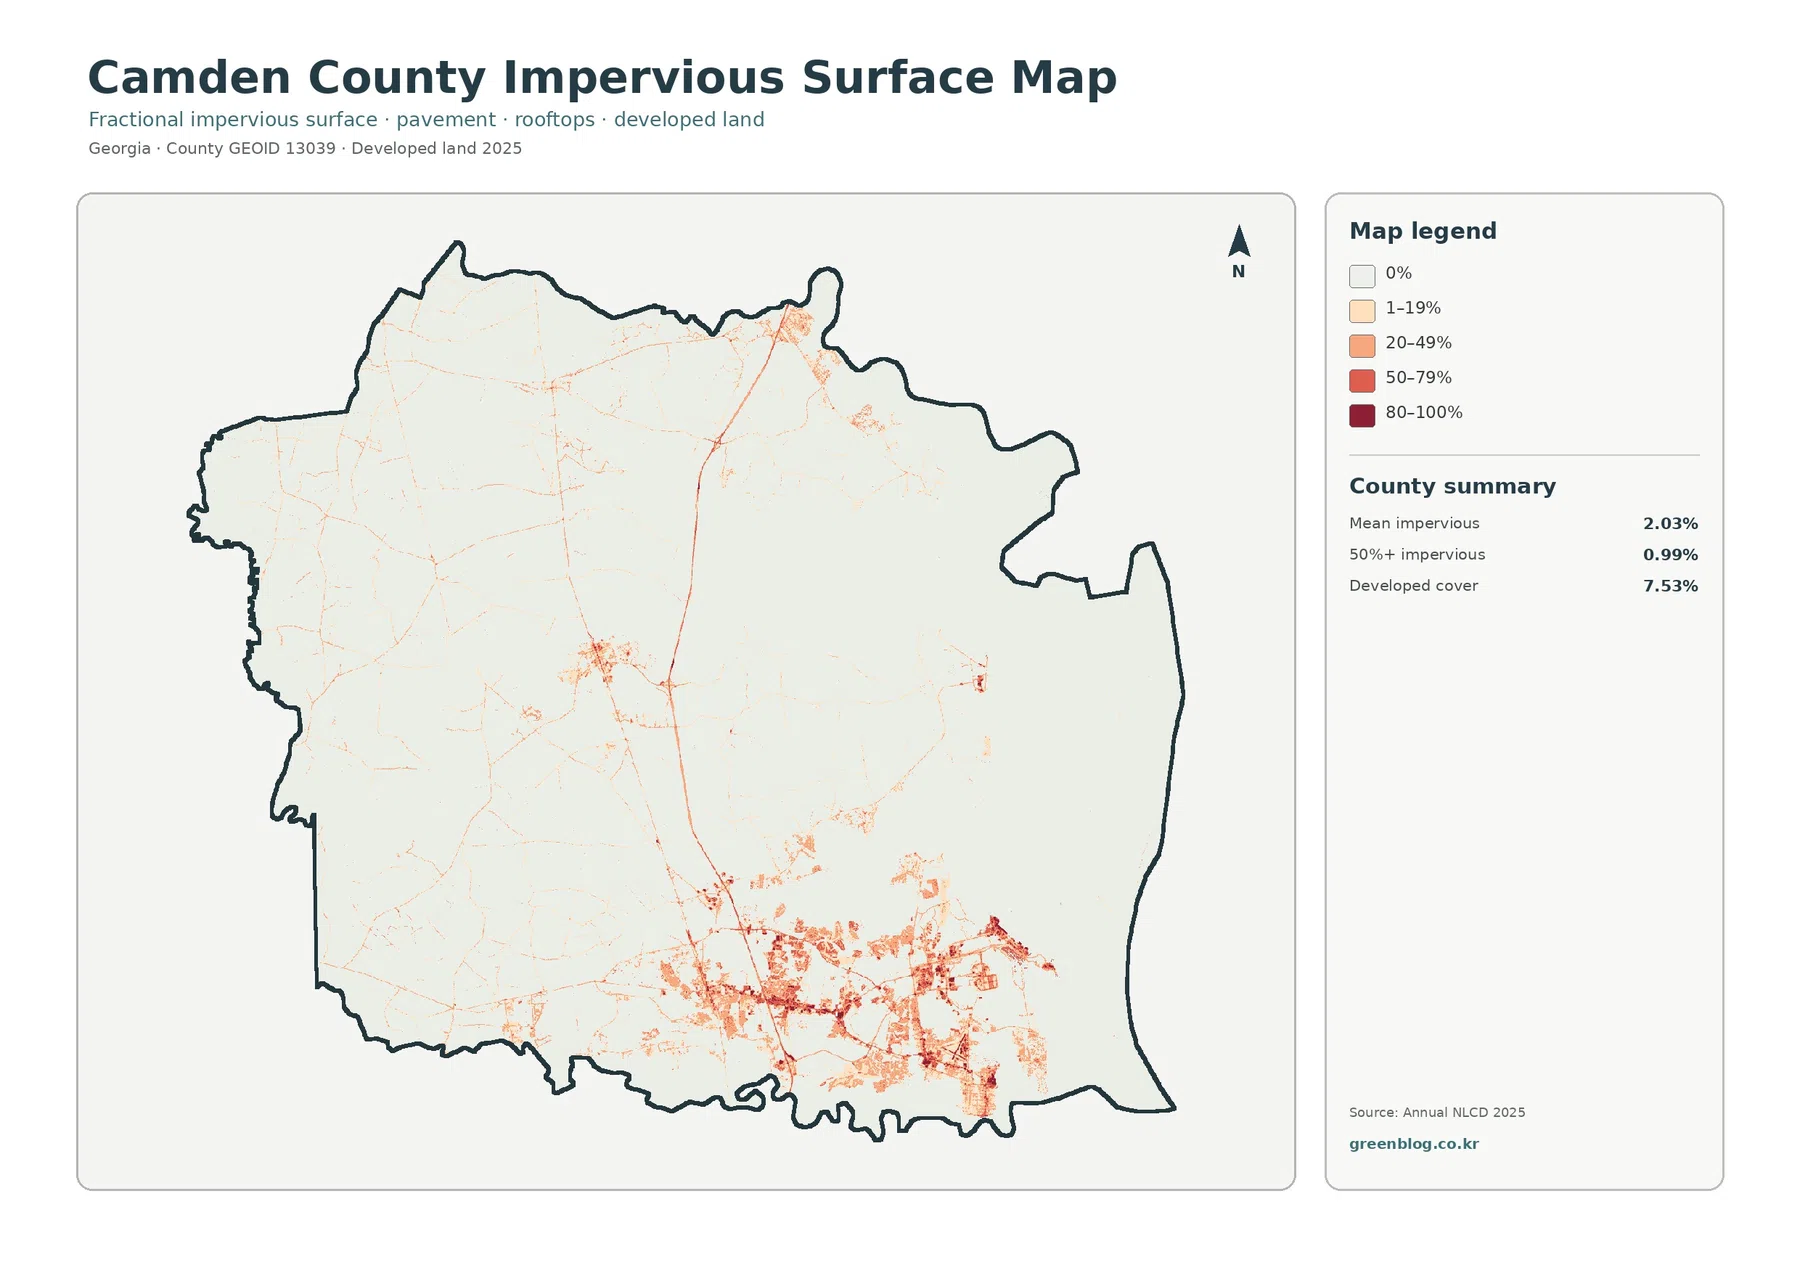
The darkest impervious colors concentrate in southern Camden County, with smaller nodes and thin linear traces extending elsewhere through the interior. The Census reference map places Kingsland and St. Marys in this southern area, and a Navy source locates Naval Submarine Base Kings Bay in the southeast corner of Georgia a short distance north of St. Marys. That outside context helps orient the map, but it does not turn the NLCD image into a facility map. Individual hard-surface patches cannot be assigned to a specific base, city, road, or property without a separate boundary layer.
Cumberland Island gives the eastern edge a land-cover pattern unlike the mainland
Camden County’s long eastern island is not just a thin outline on the county boundary. On the land-cover maps, it carries a persistent forest strip with wetland and water around it. The National Park Service describes Cumberland Island as a mosaic of ocean and estuary, beaches and dunes, oak and pine forests, salt marshes, and freshwater wetlands. That description is more ecologically detailed than Annual NLCD, but it provides useful local context for why several broad land-cover classes appear close together on the island.
Agriculture is only 0.49%, making the forest-and-farmland view unusually revealing
Many county forest-and-farmland maps are useful because they compare two large working-land categories. Camden County is different. Agriculture is only 0.49% in the supplied summary, so yellow cropland and pasture-related areas appear as scattered, small pieces rather than broad farm blocks. The map therefore becomes more useful as a way to see how limited open agricultural land sits within a landscape dominated by forest and wetlands.
The 1985–2025 map records 18.09% class difference, led by forest loss
The change map compares the class assigned to each mapped location in 1985 with the class assigned in 2025. Camden County’s summary reports 18.09% total class difference. Forest loss is the largest listed category at 7.73%, followed by other difference at 6.57%. Areas classified as developed in the comparison account for 3.29%, while agricultural loss is only 0.10%. The legend also contains a wetland-difference color, but the summary does not state a separate percentage for it, so no value is reconstructed from the remaining total.
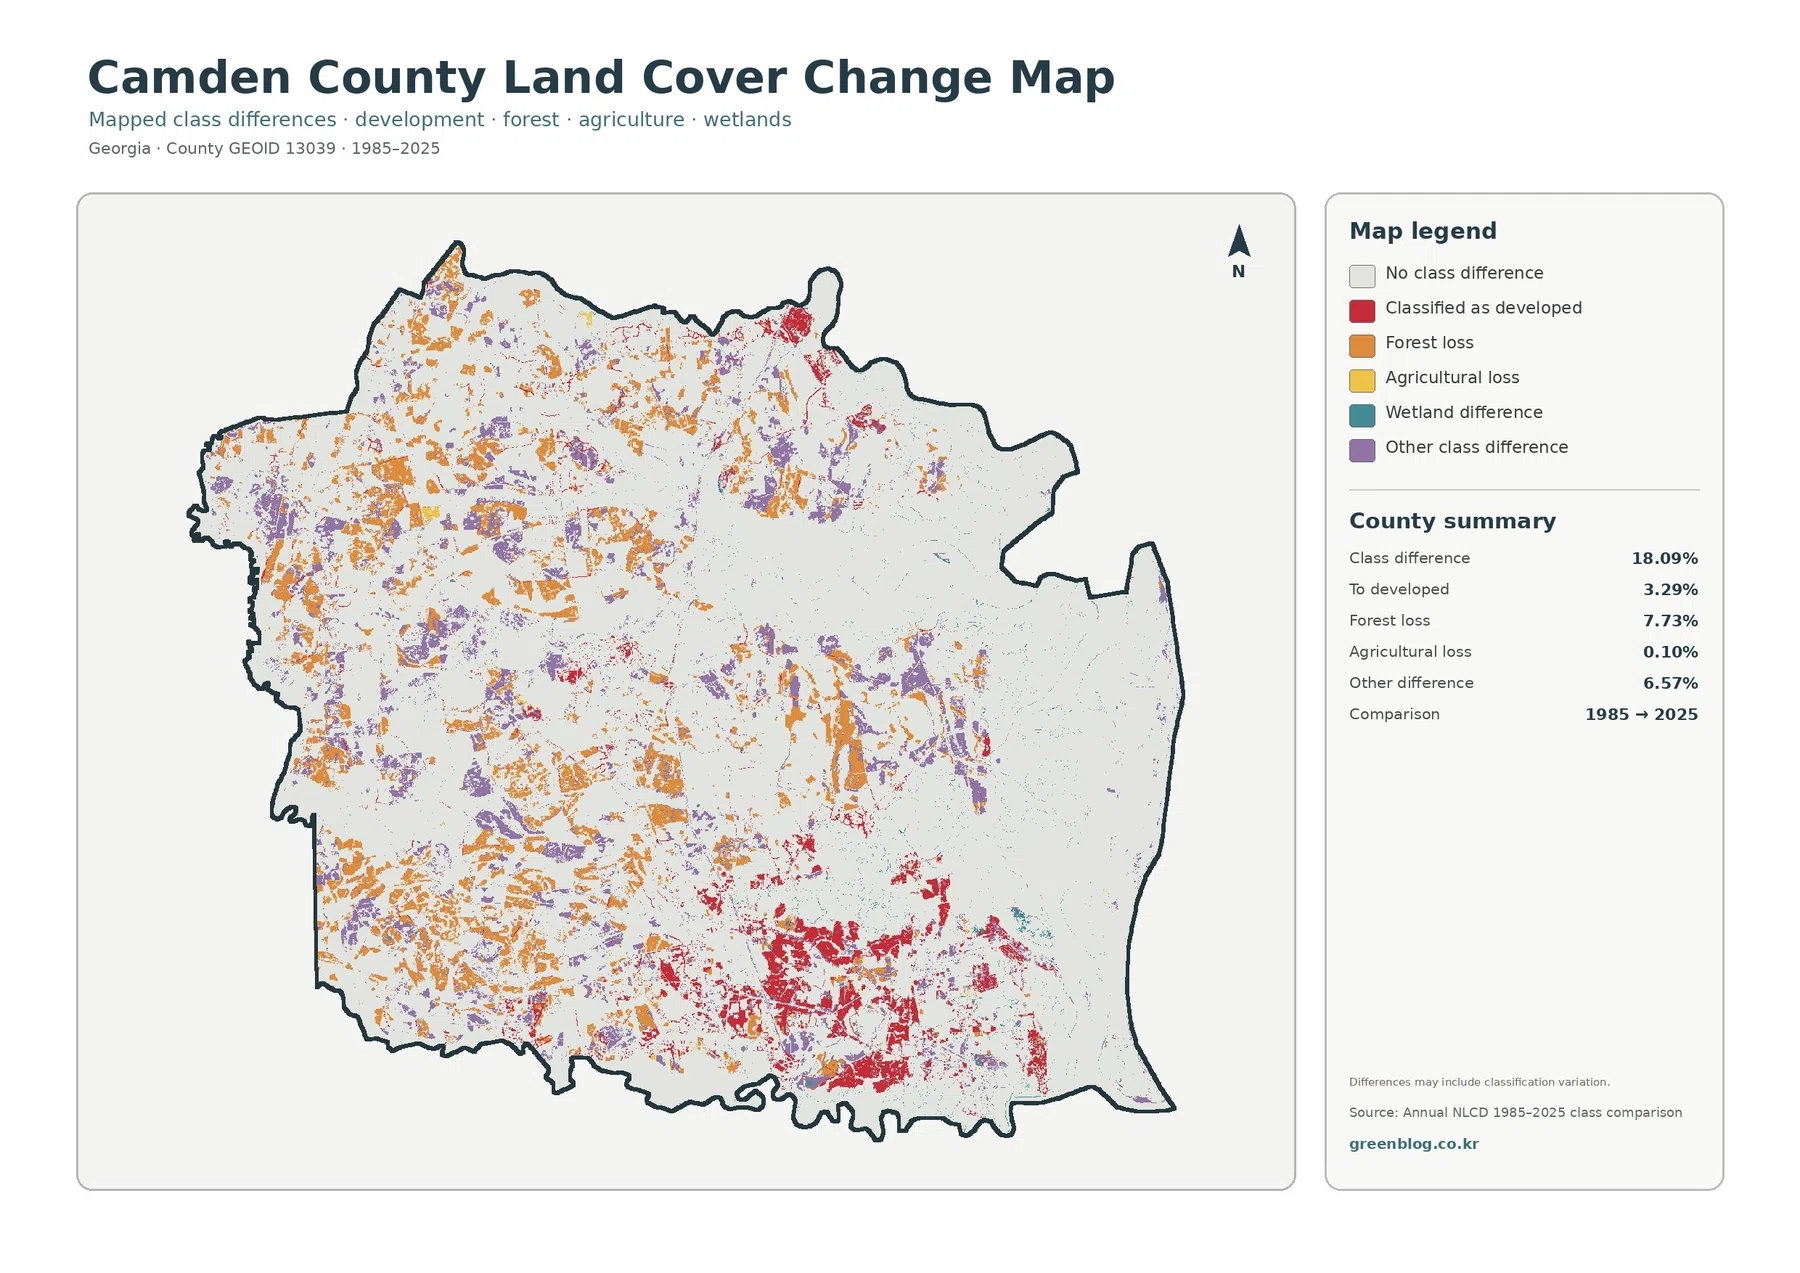
Orange forest-loss patches are scattered widely through the western and central portions of the county rather than forming a single block. Purple “other difference” areas are also dispersed through much of the interior. Red developed-change areas become much more concentrated in the south, echoing the location of the current developed and impervious pattern. The broad eastern wetland and barrier-island side contains extensive light areas with no mapped class difference, although smaller change patches remain along portions of the wetland and water margins.
Four original JPG maps are included, with print size worth checking before A3 use
The download package contains the original JPG versions of all four maps rather than the smaller WebP previews used in the article body. The supplied asset manifest lists each JPG at 2480×1754 pixels and does not mark the files as meeting the project’s A3 high-resolution reference. They are well suited to screen use, documents, many presentations, and moderate-size printing. For a large A3 print, test the intended output size first so the legend text and county boundary remain sharp enough for your printer and layout.
Thirty-meter cells are useful for county patterns but not for parcel-level edges
Annual NLCD is a Landsat-based raster product at 30-meter spatial resolution. A raster divides the landscape into grid cells and assigns a representative value to each cell. One 30-meter cell can contain more than one real-world surface, such as trees, pavement, lawn, shoreline, and part of a building. Small roads, narrow tidal creeks, isolated structures, and sharp wetland edges can therefore be simplified or blended into the surrounding class.
Frequently Asked Questions
Why is wetland cover 46.37% when open water is only 7.88%?
Wetlands and open water are separate land-cover classes. Open water represents rivers, broad channels, ocean water, and similar surfaces, while wetlands can include saturated ground and wetland vegetation that does not look like open blue water. Camden County’s eastern side contains large teal wetland areas crossed by blue water channels, so the two percentages should be compared rather than combined into one undifferentiated “water” category.
Which map best shows the built footprint around Kingsland, St. Marys, and Kings Bay?
The impervious-surface map is the clearest choice when you want to see concentrated pavement and rooftops, because the southern hard-surface cluster stands out strongly against the rest of the county. Pair it with the general land-cover map if you also need wetland, forest, and water context. For exact city limits, road names, or Naval Submarine Base boundaries, use the Census, Camden County, or Navy reference sources instead of treating the NLCD colors as administrative boundaries.
Map File Information
The downloadable ZIP contains the four original JPG maps for Camden County: general land cover, forest and farmland, impervious/developed land, and 1985–2025 land-cover change.
- Included Versions: Land cover / Forest & farmland / Impervious & developed land / Land-cover change
- Included Files: 4 JPG maps
Related Maps
- Appling County Georgia Land Cover Map
- Atkinson County Georgia Land Cover Map
- Bacon County Georgia Land Cover Map
Sources and References
- MRLC Annual NLCD Data – Annual NLCD access and product information used for the supplied 2025 land-cover maps
- USGS Annual NLCD Land Cover Classification – official class definitions and interpretation guidance
- Camden County Plans & Resources – official county, Kingsland, St. Marys, and Kings Bay planning resources
- Cumberland Island National Seashore – Natural Features & Ecosystems – NPS context for island forest, salt marsh, freshwater wetland, beach, and dune environments
- U.S. Census Bureau 2020 Georgia County Reference Maps – official reference locations for Kingsland, St. Marys, Woodbine, Kings Bay Base, and major water features
- NAVFAC Naval Submarine Base Kings Bay – official location and background information for the Kings Bay installation
Green Map creates custom-edited map images using open geographic data sources such as geoBoundaries, Natural Earth, OpenStreetMap, and government open data.
These maps are edited visual materials, not raw data files, and are provided for education, documents, presentations, and graphic reference.