Agriculture covers 29.21% of Burke County in the supplied 2025 summary, while wetlands follow at 28.77% and forest adds another 22.95%. The county is therefore a close farm-wetland-forest mix rather than a landscape led by one class. This Burke County Georgia Land Cover Map also reveals two distinct developed concentrations: Waynesboro near the center and a separate cluster near the Savannah River.
The page compares current land cover, forest and farmland, impervious surface, and class differences between 1985 and 2025. Four WebP previews appear beside the discussion, and the original 2480 × 1754-pixel JPG maps can be downloaded together in one ZIP. They work well for county profiles, classroom use, presentations, and broad landscape comparison.
Table of Contents
Two built centers stand apart in the 2025 countywide pattern
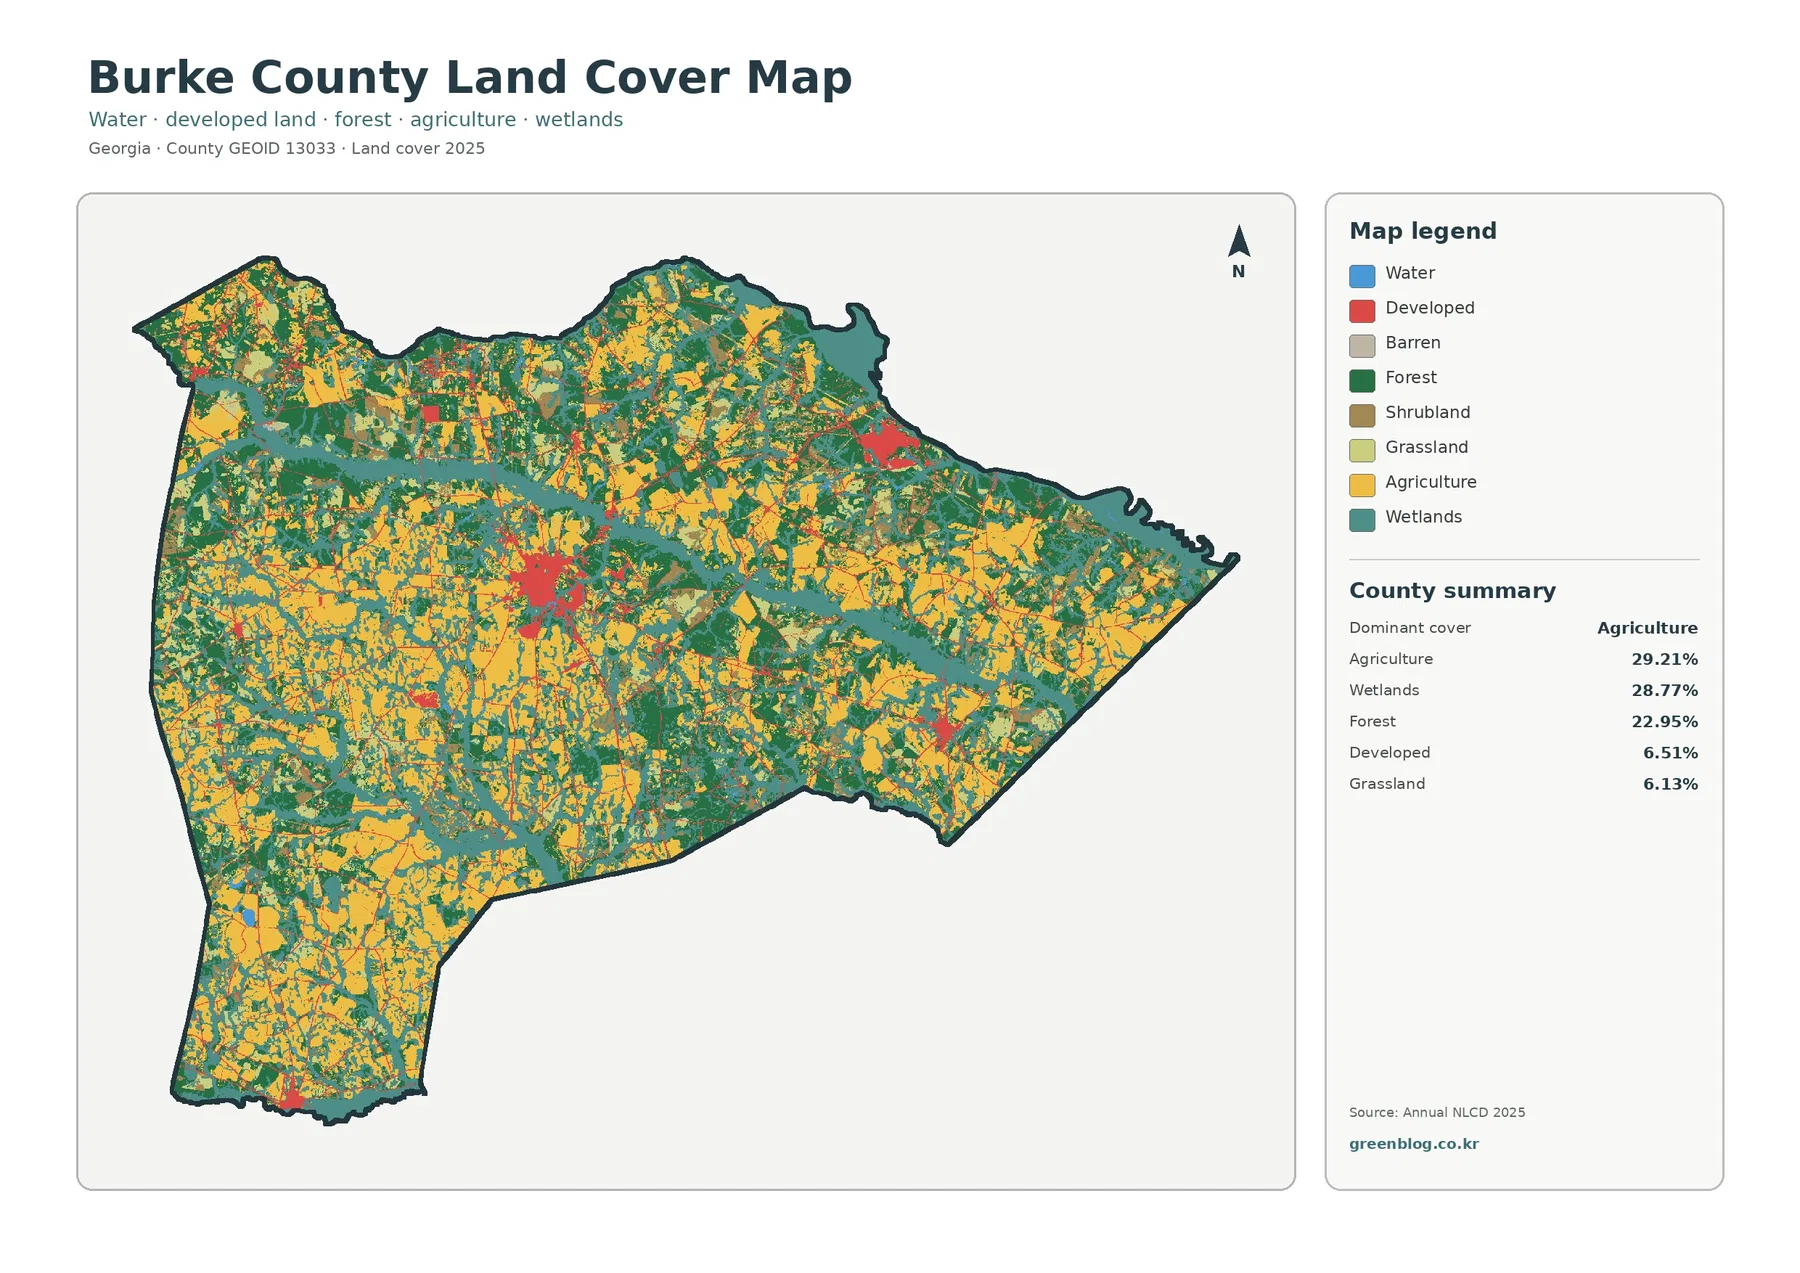
Agriculture leads wetlands by only 0.44 percentage points. Forest covers nearly another quarter of the county, while developed land represents 6.51%; the focused summary also lists 6.13% grassland, 5.82% shrubland, and 0.57% water. These figures describe a rural mosaic in which working fields, wet ground, and woods repeatedly meet.
Yellow farm blocks are broadest in the southwest extension and western half. Branching teal wetlands cross the middle and widen near the irregular eastern boundary, while forest fills many margins and gaps. Developed color is concentrated around Waynesboro and in a detached northeastern group. Smaller marks lack road and municipal labels, so they should not be treated as exact town or site boundaries.
Land cover identifies the predominant surface class assigned from imagery. It does not show ownership, zoning, farm parcels, building rights, or legal wetland limits. A developed cell may include lawns and trees, and an agricultural cell may contain a ditch or tree row. The colors support county-scale comparison, not parcel decisions.
Hard surfaces distinguish Waynesboro from the Vogtle area
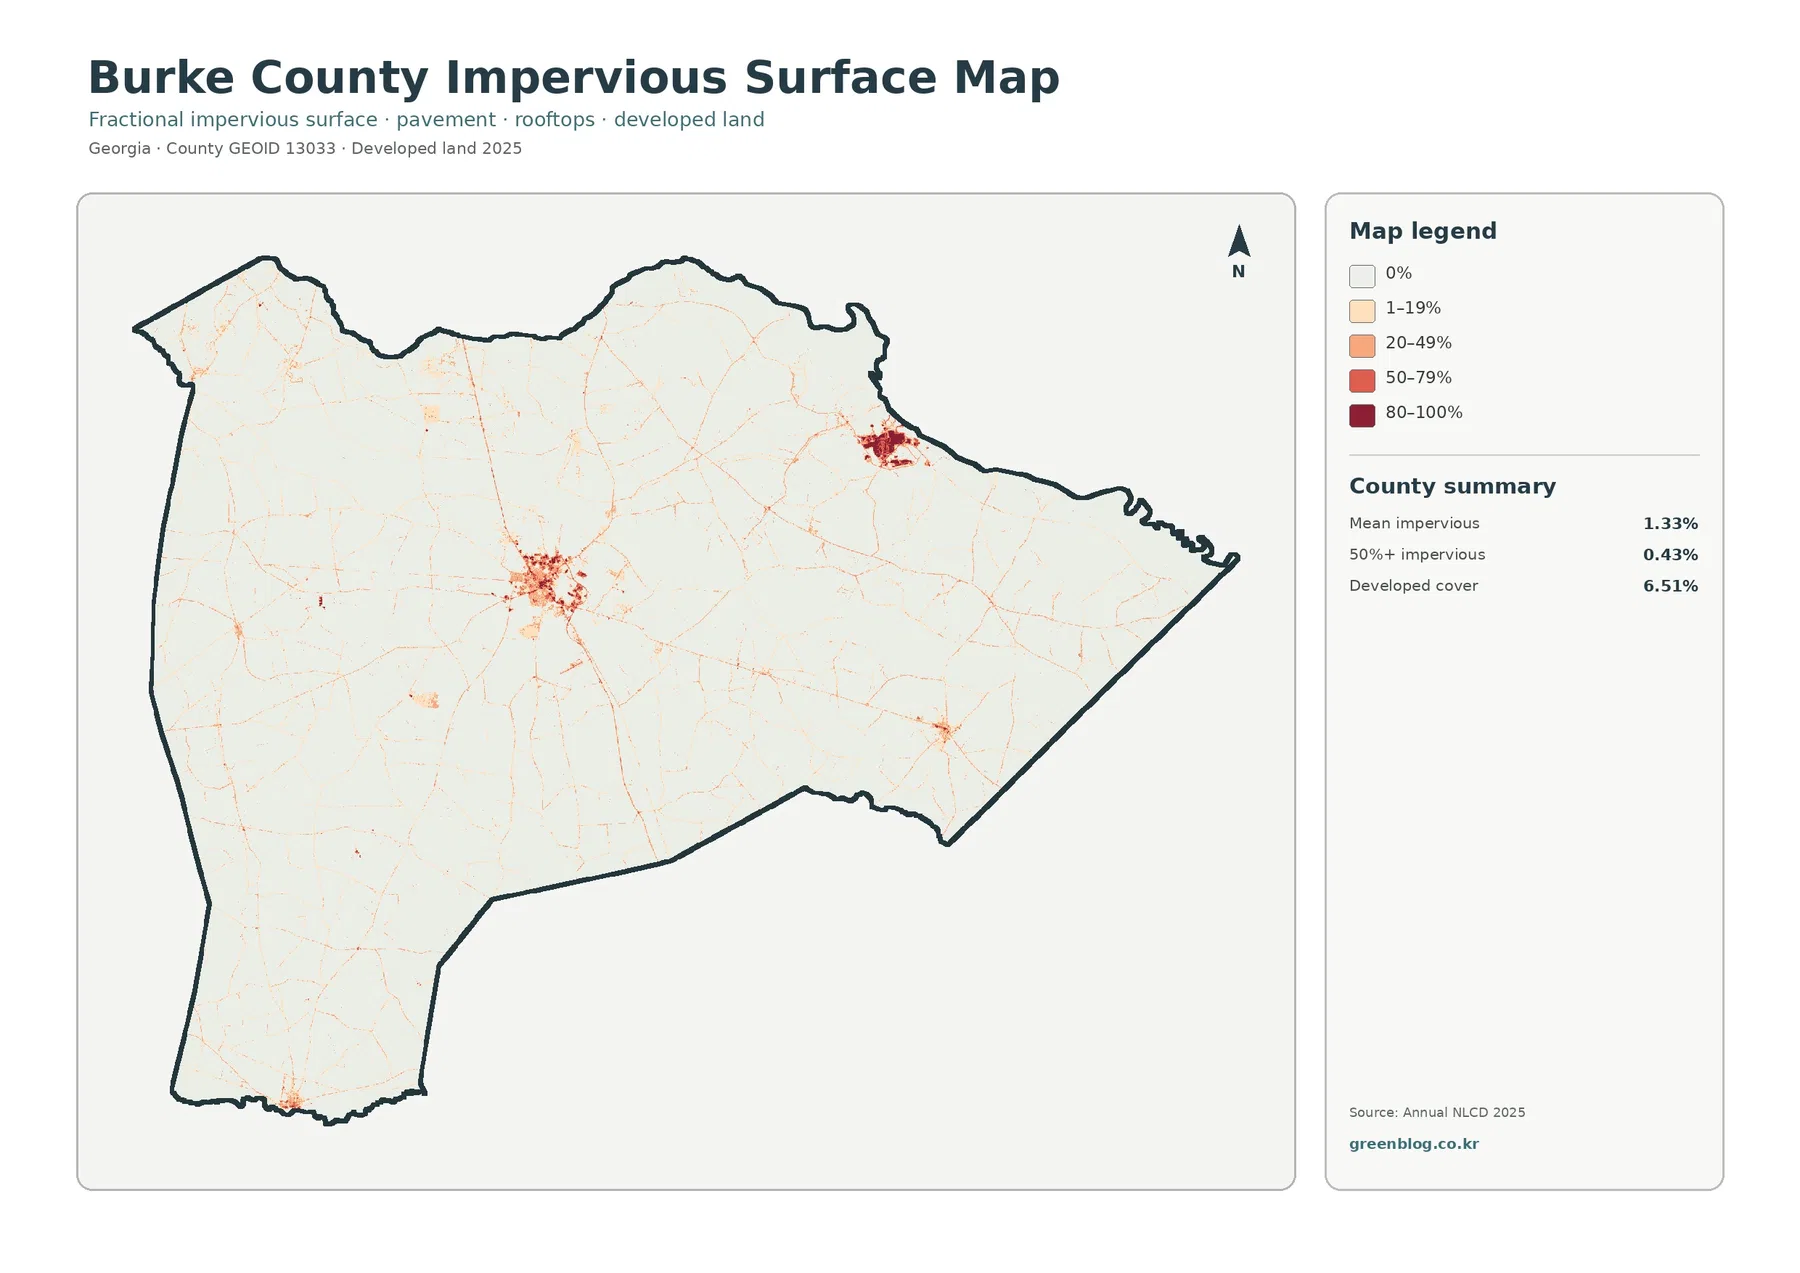
Mean impervious cover is 1.33%, and 0.43% of the county is mapped at 50% impervious or greater. Those values are below the 6.51% developed share because developed classes can include permeable ground around buildings and roads. Waynesboro forms the broadest dark cluster, with fine lines extending toward smaller marks across a mostly pale rural background.
A second dark concentration broadly aligns with Plant Vogtle, which Southern Nuclear places in Burke County near Waynesboro along the Savannah River. The image does not show the facility boundary, security areas, access routes, transmission lines, or emergency-planning zones, and line-like marks have no road names. Impervious cover can guide closer drainage study, but rainfall, soils, elevation, streams, and wetlands are still needed for flood analysis.
Wet corridors divide large farm blocks and wooded margins
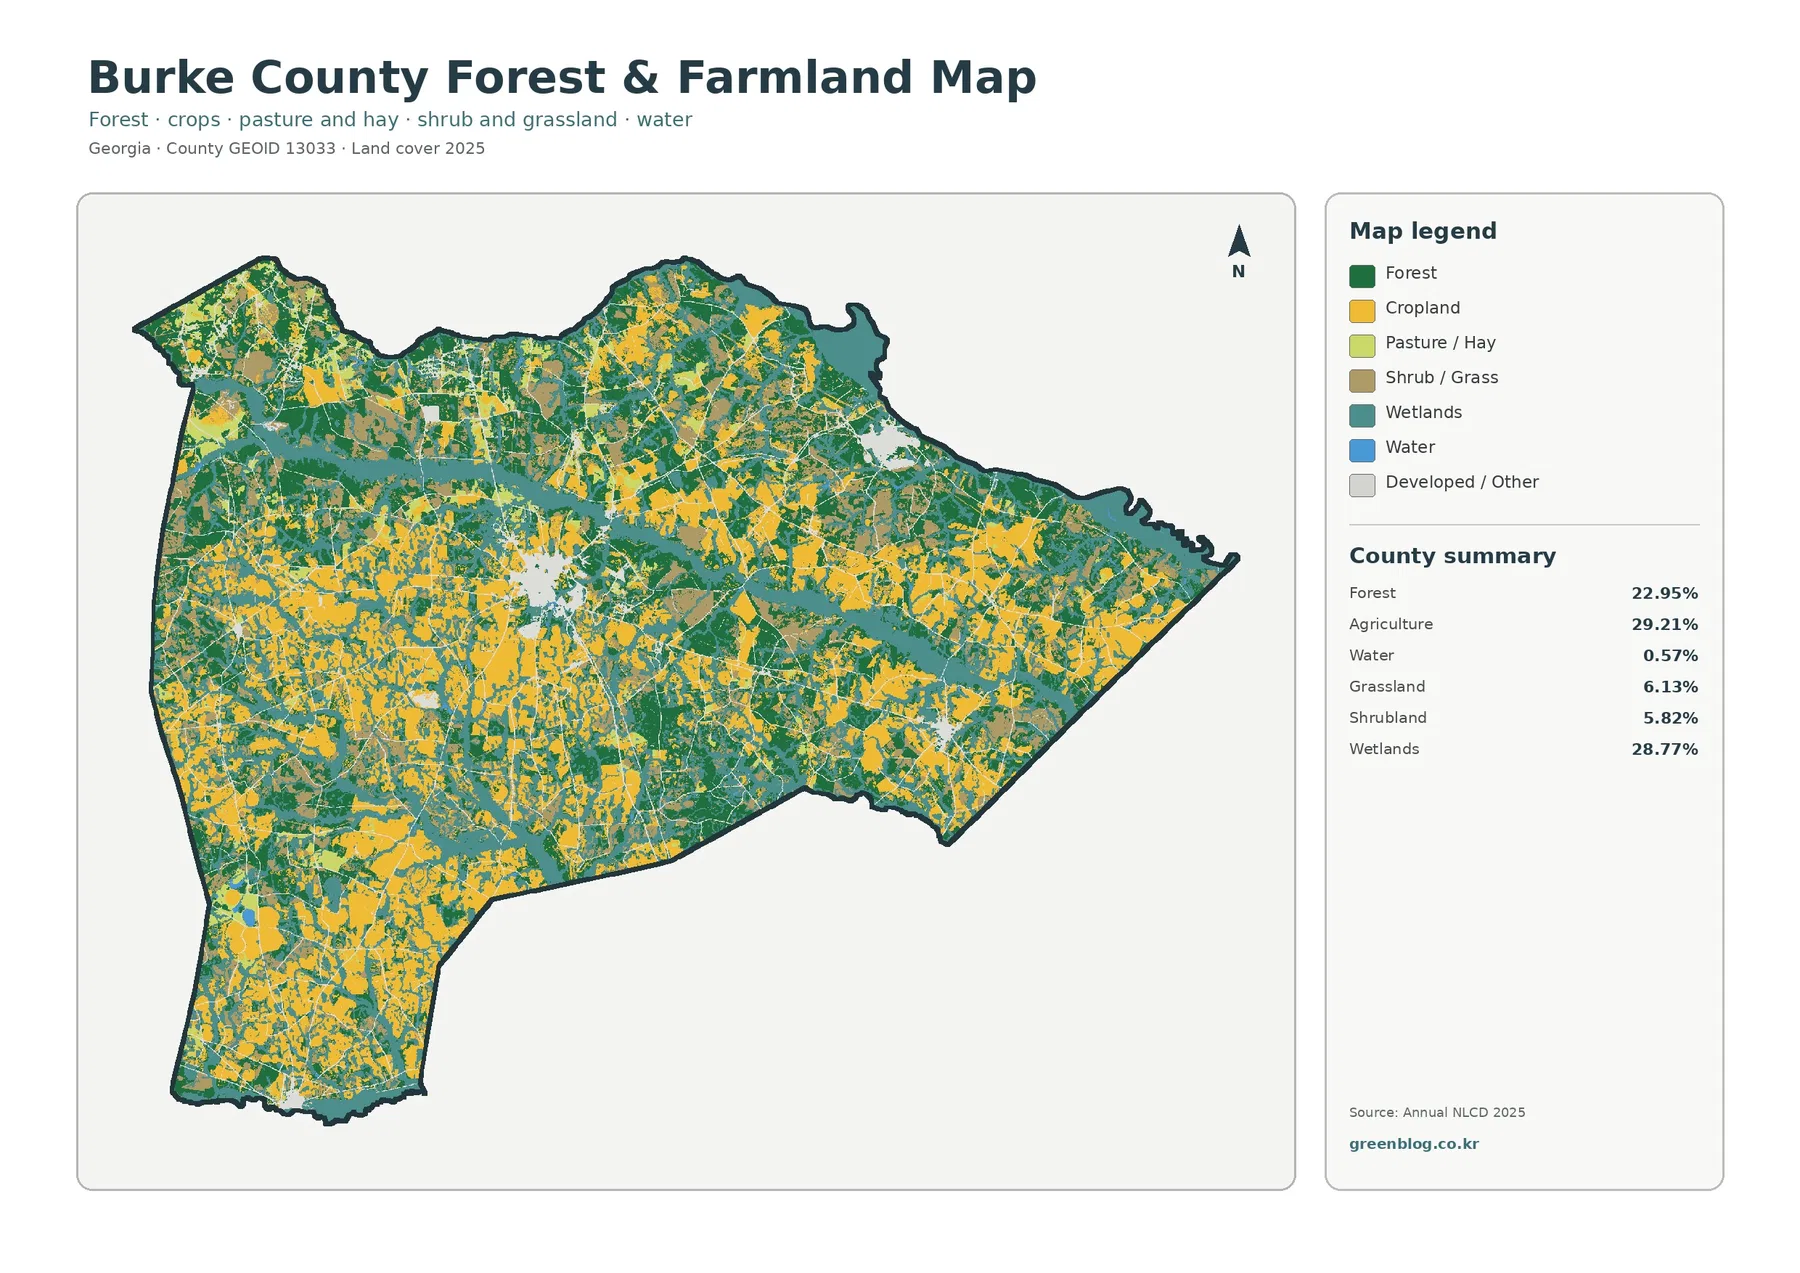
With developed and miscellaneous surfaces faded, broad cropland blocks stand out in the southwest, west, and interior. Wetland bands pass between them and continue toward the east, while forest fills edges and smaller openings. The county is not one uninterrupted farm belt; working land is repeatedly divided by wooded and wet cover, and grass or shrub classes appear as scattered secondary pieces.
USGS monitoring data provides geographic context for Brier Creek near Waynesboro. The large central wetland band broadly overlaps that drainage setting, with more teal along the Savannah River side. The preview contains no stream labels, however, so every branch cannot be named as Brier Creek or assigned to a particular tributary.
Open water accounts for 0.57%, even though wetlands cover 28.77%. Blue generally marks exposed water, whereas teal may include wetland vegetation and seasonally saturated ground. Annual NLCD also reduces the landscape to 30-meter cells, each with one predominant class. Straight edges are not survey lines, and the map cannot identify crops, ownership, regulated wetlands, floodplains, or drainage easements.
The 29.20% endpoint difference is much broader than development
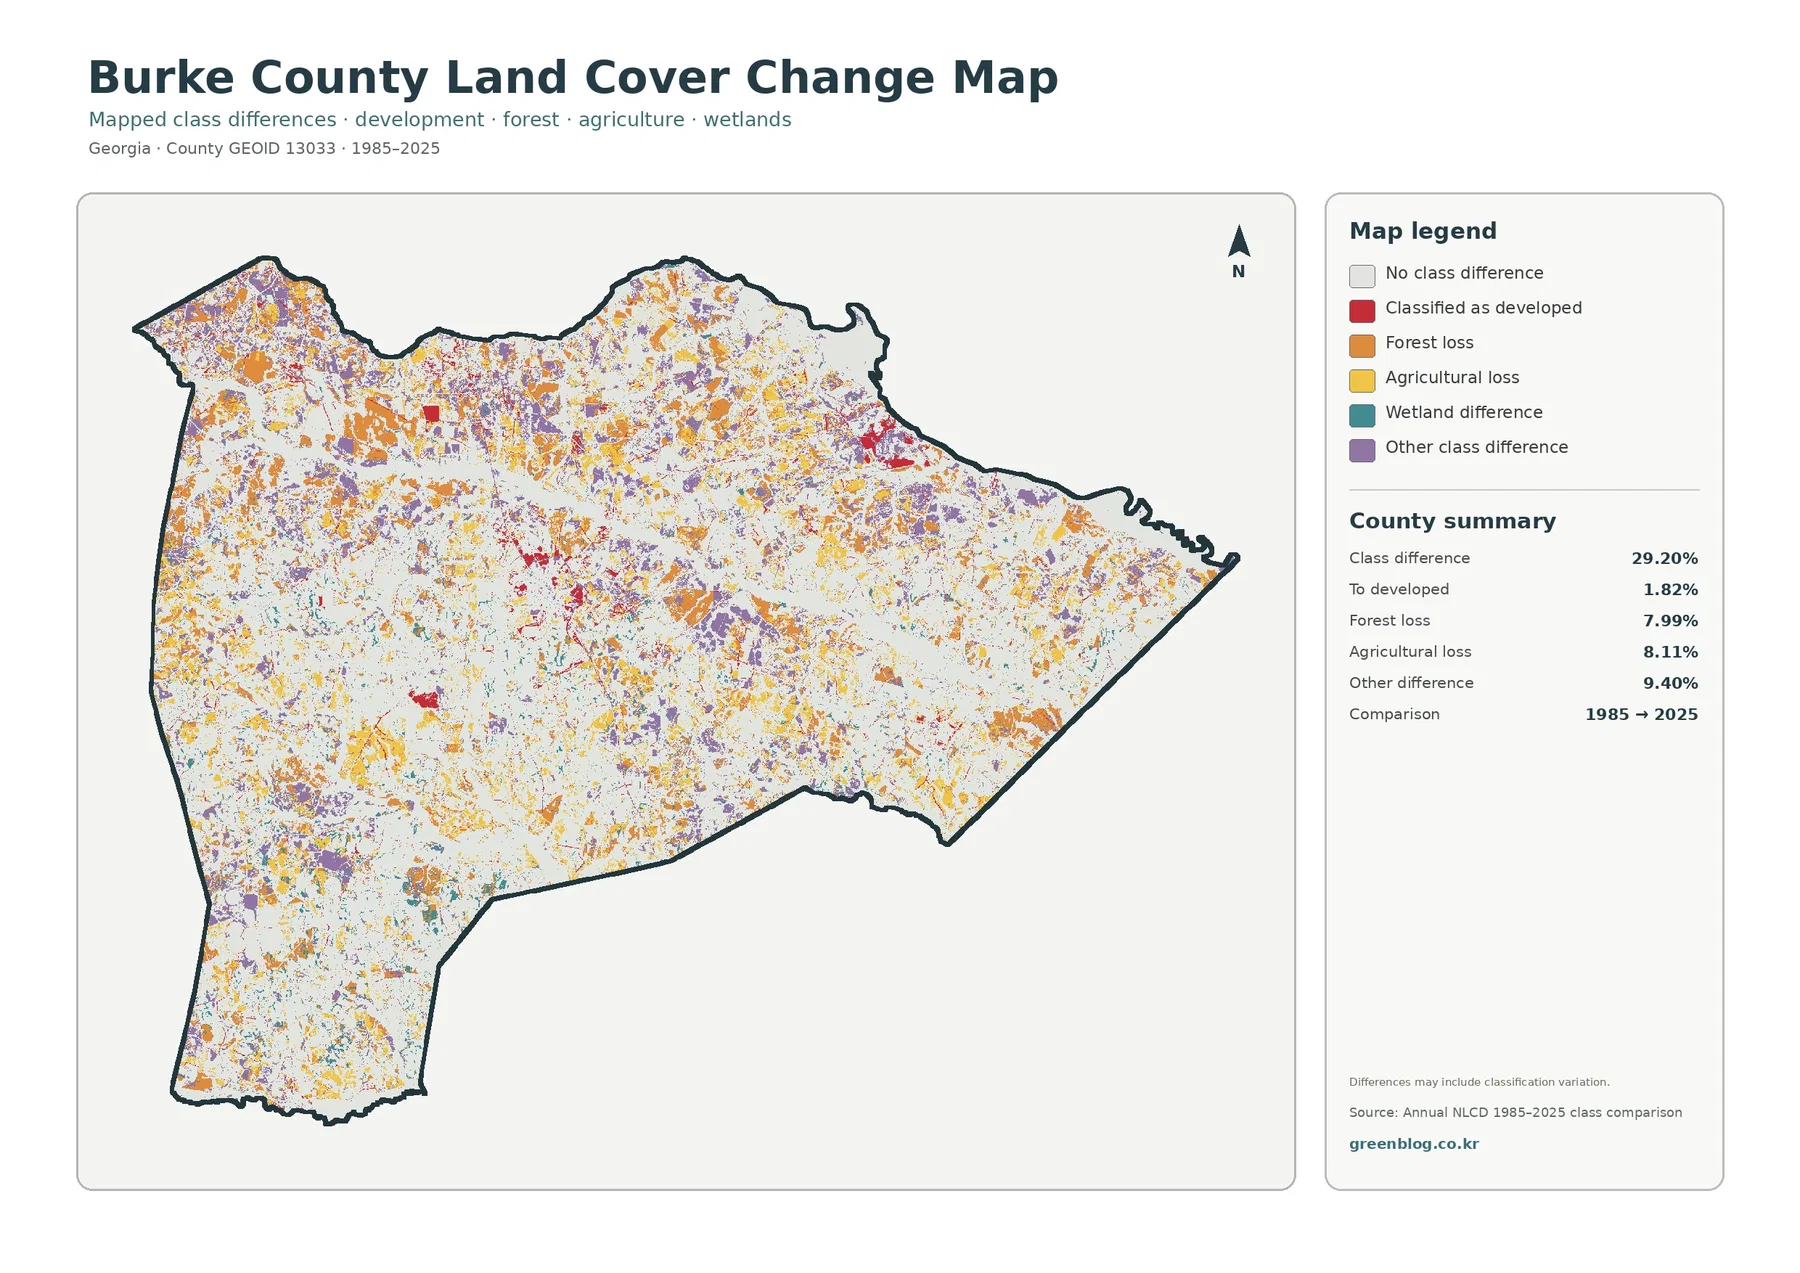
The comparison reports 29.20% total class difference: 1.82% classified as developed, 7.99% forest loss, 8.11% agricultural loss, and 9.40% other difference. Wetland difference appears in the legend without a separate percentage. Developed-conversion cells cluster most visibly around Waynesboro and the northeastern facility area, while forest, agricultural, and other differences are spread widely through rural sections.
“Loss” means that a forest or agricultural cell in 1985 received another class in 2025. It does not establish logging, abandonment, construction, storms, regrowth, or classification variation as the cause. The 1.82% developed component is not a building inventory or timeline. Read the change map after the 2025 view, and use intermediate imagery, permits, and local records to investigate individual locations.
Municipal context helps, but the pixels remain generalized
Georgia’s Department of Community Affairs provides a comprehensive-plan page for Burke County with Girard, Keysville, Midville, Sardis, Vidette, and Waynesboro. Those names help orient separate developed marks, but no municipal outlines appear here. Planning maps address policy and jurisdiction, while Annual NLCD describes observed surface cover. Red is not proof of buildable land, teal is not an automatic regulated wetland, and yellow is not a verified farm parcel.
Choose the map that answers the main question
Begin with the 2025 overview for a county profile. It shows the close agriculture-wetland split, the large forest share, and the separation between Waynesboro and the Savannah-side cluster. Use the vegetation image for field, forest, and wetland contacts; choose the impervious map for hard-surface concentrations. Add the 1985–2025 comparison only after current cover has been established.
The current maps represent the supplied 2025 observation year, so later construction, harvest, timber activity, flooding, or road work may not appear. Each JPG measures 2480 × 1754 pixels and suits web pages, reports, and ordinary presentations, but the package does not claim an A3 high-resolution standard. Parcel, regulatory, engineering, facility-security, and emergency-planning questions require newer imagery and official sources.
Files included in the four-map JPG download
The ZIP contains one JPG for 2025 land cover, forest and farmland, impervious surface and developed land, and 1985–2025 land-cover change. Use the countywide image as the base, then add the file that supports the topic: vegetation contacts, hard-surface concentration, or endpoint class difference. These are reference maps, not parcel, survey, regulatory, engineering, or facility-operation products.
Frequently Asked Questions
Is agriculture or wetland the dominant cover in Burke County?
Agriculture is the largest 2025 class at 29.21%, but wetlands follow at 28.77%, a difference of only 0.44 percentage points. Forest also covers 22.95%. Burke County is better described as a farm-wetland-forest mosaic than as a county dominated by agriculture alone.
Does the northeastern impervious cluster map the exact Plant Vogtle site?
It broadly aligns with Plant Vogtle’s official location along the Savannah River near Waynesboro. The image does not show the facility boundary, security areas, access routes, transmission lines, or emergency-planning zones. Use official plant and emergency-management sources for those details.
Does 29.20% class difference mean that 29.20% of the county was developed?
No. Only 1.82% is listed as classified to developed at the 2025 endpoint. The 29.20% total also includes forest loss, agricultural loss, wetland difference, other class changes, and possible classification variation. Intermediate imagery and records are needed to establish when and why a location changed.
Sources and Reference Data
- MRLC Annual NLCD Data – official access point for annual land-cover and comparison products
- USGS Annual NLCD Land Cover Classification – definitions and guidance for agriculture, wetlands, forest, developed land, and related classes
- Georgia DCA – Burke County Comprehensive Plan – official county and municipal planning resources for Burke County and its cities
- UGA Cooperative Extension – Burke County Agriculture and Natural Resources – local agriculture, natural-resource programs, and county information
- USGS Brier Creek Near Waynesboro – official monitoring-location information for Brier Creek in Burke County
- Southern Nuclear – Plant Vogtle – official location and facility information for Plant Vogtle along the Savannah River near Waynesboro
Map File Information
The ZIP contains four original JPG maps for comparing Burke County's agriculture, wetlands, forest, Waynesboro and Savannah-side hard surfaces, and 1985–2025 class differences.
- Included Files: Use only the versions confirmed in the article and supplied images
- File Type: Use the confirmed download contents
- Intended Use: Printing, education, presentations, and map-based projects
Related Maps
- Appling County Georgia Land Cover Map
- Atkinson County Georgia Land Cover Map
- Bacon County Georgia Land Cover Map
Green Map creates custom-edited map images using open geographic data sources such as geoBoundaries, Natural Earth, OpenStreetMap, and government open data.
These maps are edited visual materials, not raw data files, and are provided for education, documents, presentations, and graphic reference.