Wetlands cover 41.26% of Bryan County in the supplied 2025 summary, and forest adds another 36.42%. Most of the county is therefore wet or wooded, while developed land forms separate concentrations near the northern and southern ends. This Bryan County Georgia Land Cover Map explains that contrast without treating the county as one uniform landscape.
The page includes current land cover, forest and farmland, impervious surface and developed land, and class differences between 1985 and 2025. Their WebP previews can be compared beside the text. The four original 2480 × 1754 JPG maps are also available together in one ZIP for local profiles, lessons, presentations, and visual comparison.
Table of Contents
Two built-up ends stand out inside a mostly wet and wooded county
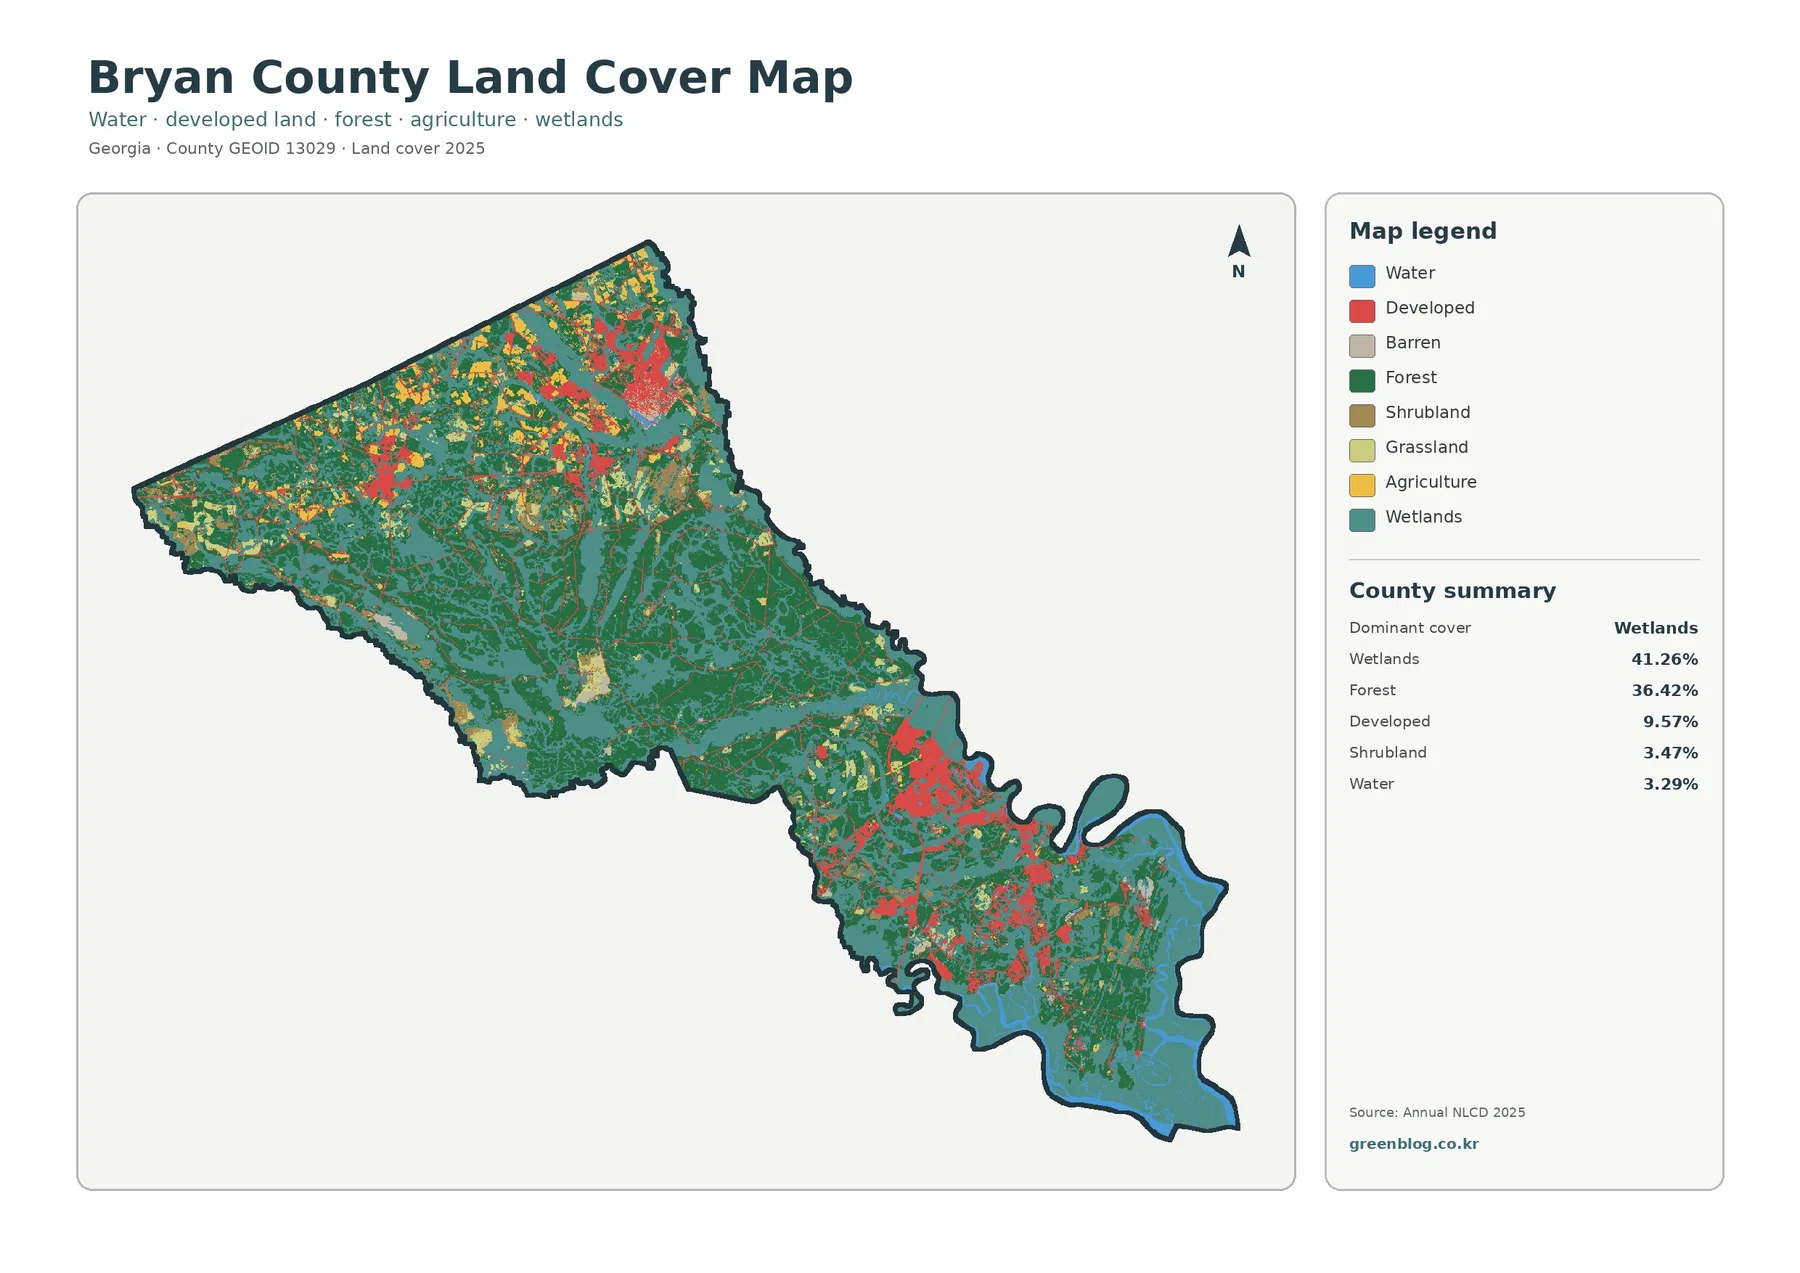
Teal wetland cells and green forest cells dominate the image. Together they account for 77.68% of the supplied summary. Wetlands spread broadly through the middle and south and reappear in branching areas toward the north. Forest fills large blocks between those wet areas, especially through the center and western side, so the two classes repeatedly meet rather than occupying isolated corners.
Developed land represents 9.57%, yet its concentration makes it conspicuous. A large red group sits near the northern end, and another distinct group appears in the south. Smaller marks occur between them, but the center is not covered by a continuous urban strip. The county is better described as two built areas separated by extensive natural cover.
Shrubland contributes 3.47% and open water 3.29%. The focused vegetation map reports 2.90% grassland and 2.39% agriculture. Yellow agricultural cells are most noticeable in the upper part of the county and remain limited farther south. Reading the wetland-forest majority and the two development clusters first makes these smaller classes easier to place.
Land cover describes what the surface appears to be, such as forest, wetland, crops, grass, water, or developed cover. It does not identify zoning, ownership, parcel lines, building rights, or a legal wetland boundary. A developed class may include lawns and trees around buildings, so its color should not be treated as a property-level judgment.
Fort Stewart divides daily geography, but its boundary is not drawn here
Bryan County’s official location page explains that Fort Stewart intersects the county and creates northern and southern ends. That arrangement supplies useful context for the separated development pattern. The northern side includes the Pembroke area, while the southern side includes Richmond Hill, but the supplied images do not label cities or outline municipal limits.
Broad low-development areas between the clusters should not be assigned automatically to the installation. No military boundary, ownership line, access road, or jurisdictional label appears here. Green and teal cells state land-cover classes only. Anyone who needs the exact Fort Stewart boundary must compare these images with an official installation or cadastral map.
The 1985–2025 comparison highlights differences near both developed concentrations
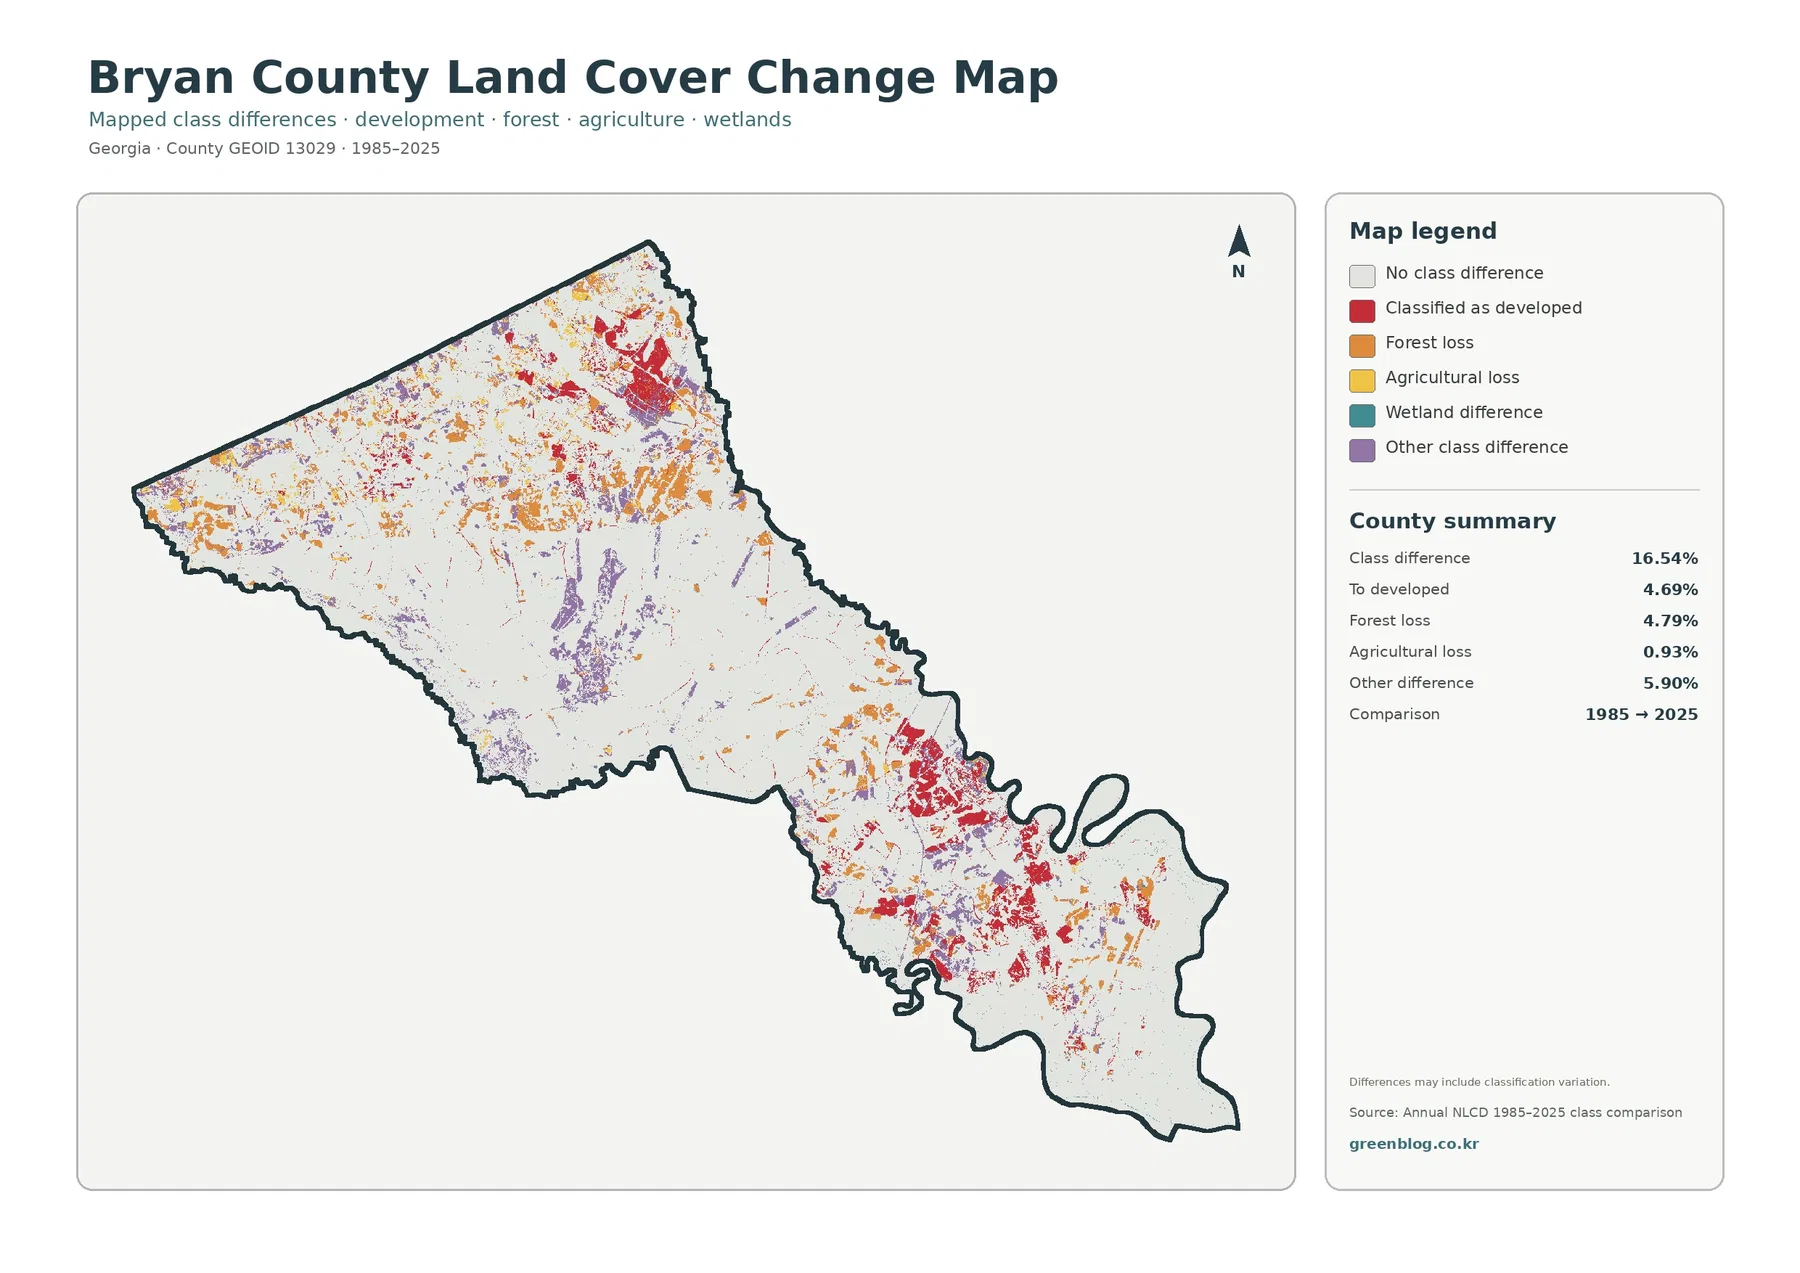
Between 1985 and 2025, the map reports a total class difference of 16.54%. This is the share of cells carrying different endpoint labels, not a measure of damaged land or a continuous forty-year transformation. The map notes that classification variation may be included, which matters when imagery dates, seasonal conditions, and mixed pixels differ.
Its summary lists 4.69% classified as developed, 4.79% forest loss, 0.93% agricultural loss, and 5.90% other difference. Red developed-change cells are easiest to notice around the northern and southern built clusters. Orange and purple marks are scattered more broadly, while the yellow agricultural-loss category occupies a smaller share.
Wetland difference appears in the legend, but no separate percentage is printed. Estimating a rate by eye or presenting a remainder calculation as an official figure would be misleading. The package supports exact values only for the categories named in its summary, although wetland-related endpoint differences can still be located approximately by color.
“Forest loss” means that a cell labeled as forest at the earlier endpoint received another class in 2025. It does not identify harvest, storm damage, construction, restoration, or error as the cause. Compare large change clusters with the current and impervious maps, then use intermediate imagery and local records to establish timing and explanation.
Forest and farmland occupy very different shares of the county
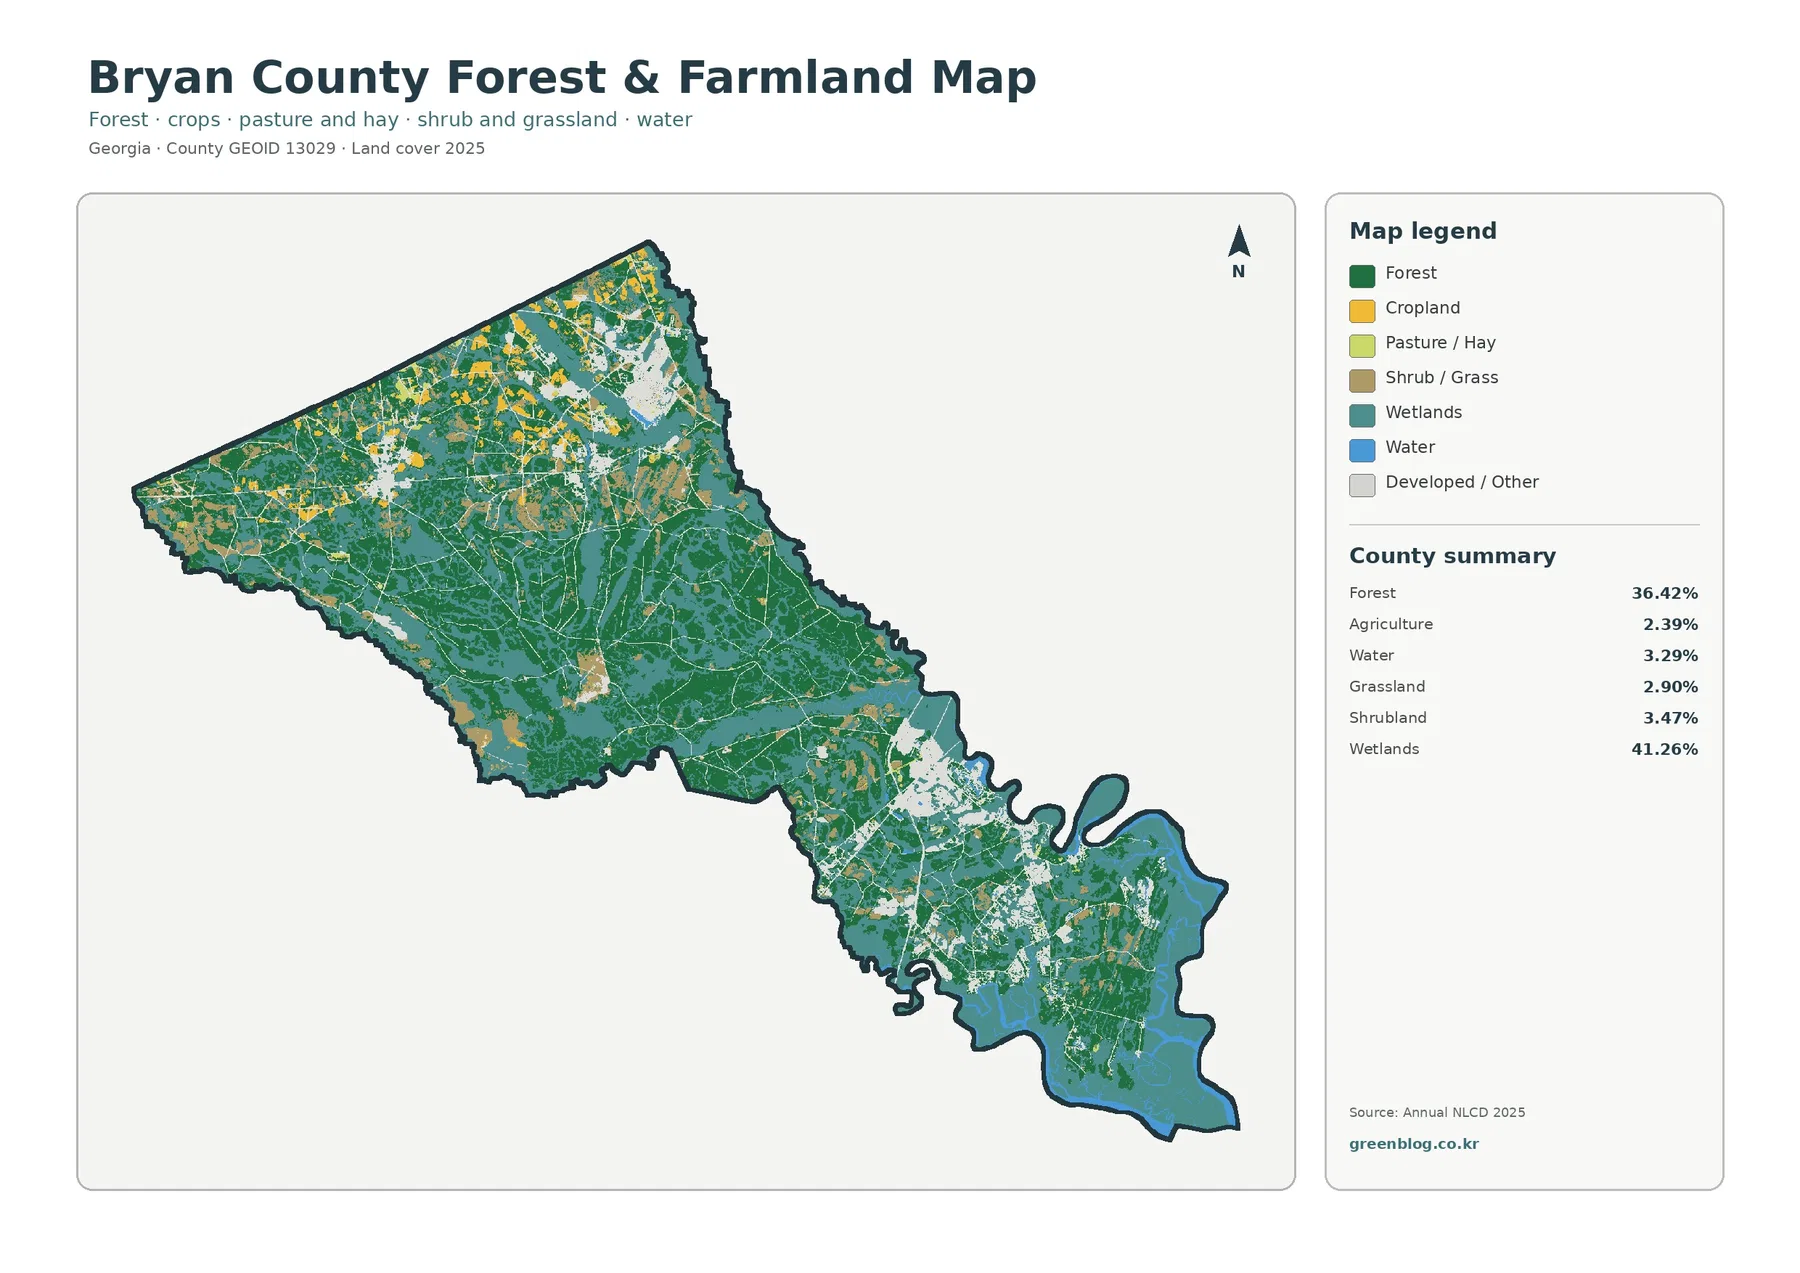
Reducing the visual weight of developed and miscellaneous classes makes the natural pattern easier to follow. Forest covers 36.42%, while agriculture is only 2.39%. Large green areas extend through much of the middle and northwest. Yellow farm blocks are concentrated mainly in the northern portion and remain small beside the countywide forest and wetland cover.
Wetlands remain the largest class at 41.26%. Teal areas form broad fields and branching connections through the center and south, often meeting forest directly. These contacts help explain the arrangement of wet and wooded surfaces, but the colors cannot reveal tree species, wetland jurisdiction, ownership, or vegetation condition on an individual parcel.
Grassland accounts for 2.90% and shrubland for 3.47%. Small patches appear along developed edges and among larger natural areas. Open water covers 3.29%, far less than wetlands because water marks exposed surfaces while wetlands may include vegetation and seasonally saturated ground. A teal area should not be described automatically as a lake or river.
Impervious cover separates paved intensity from developed land
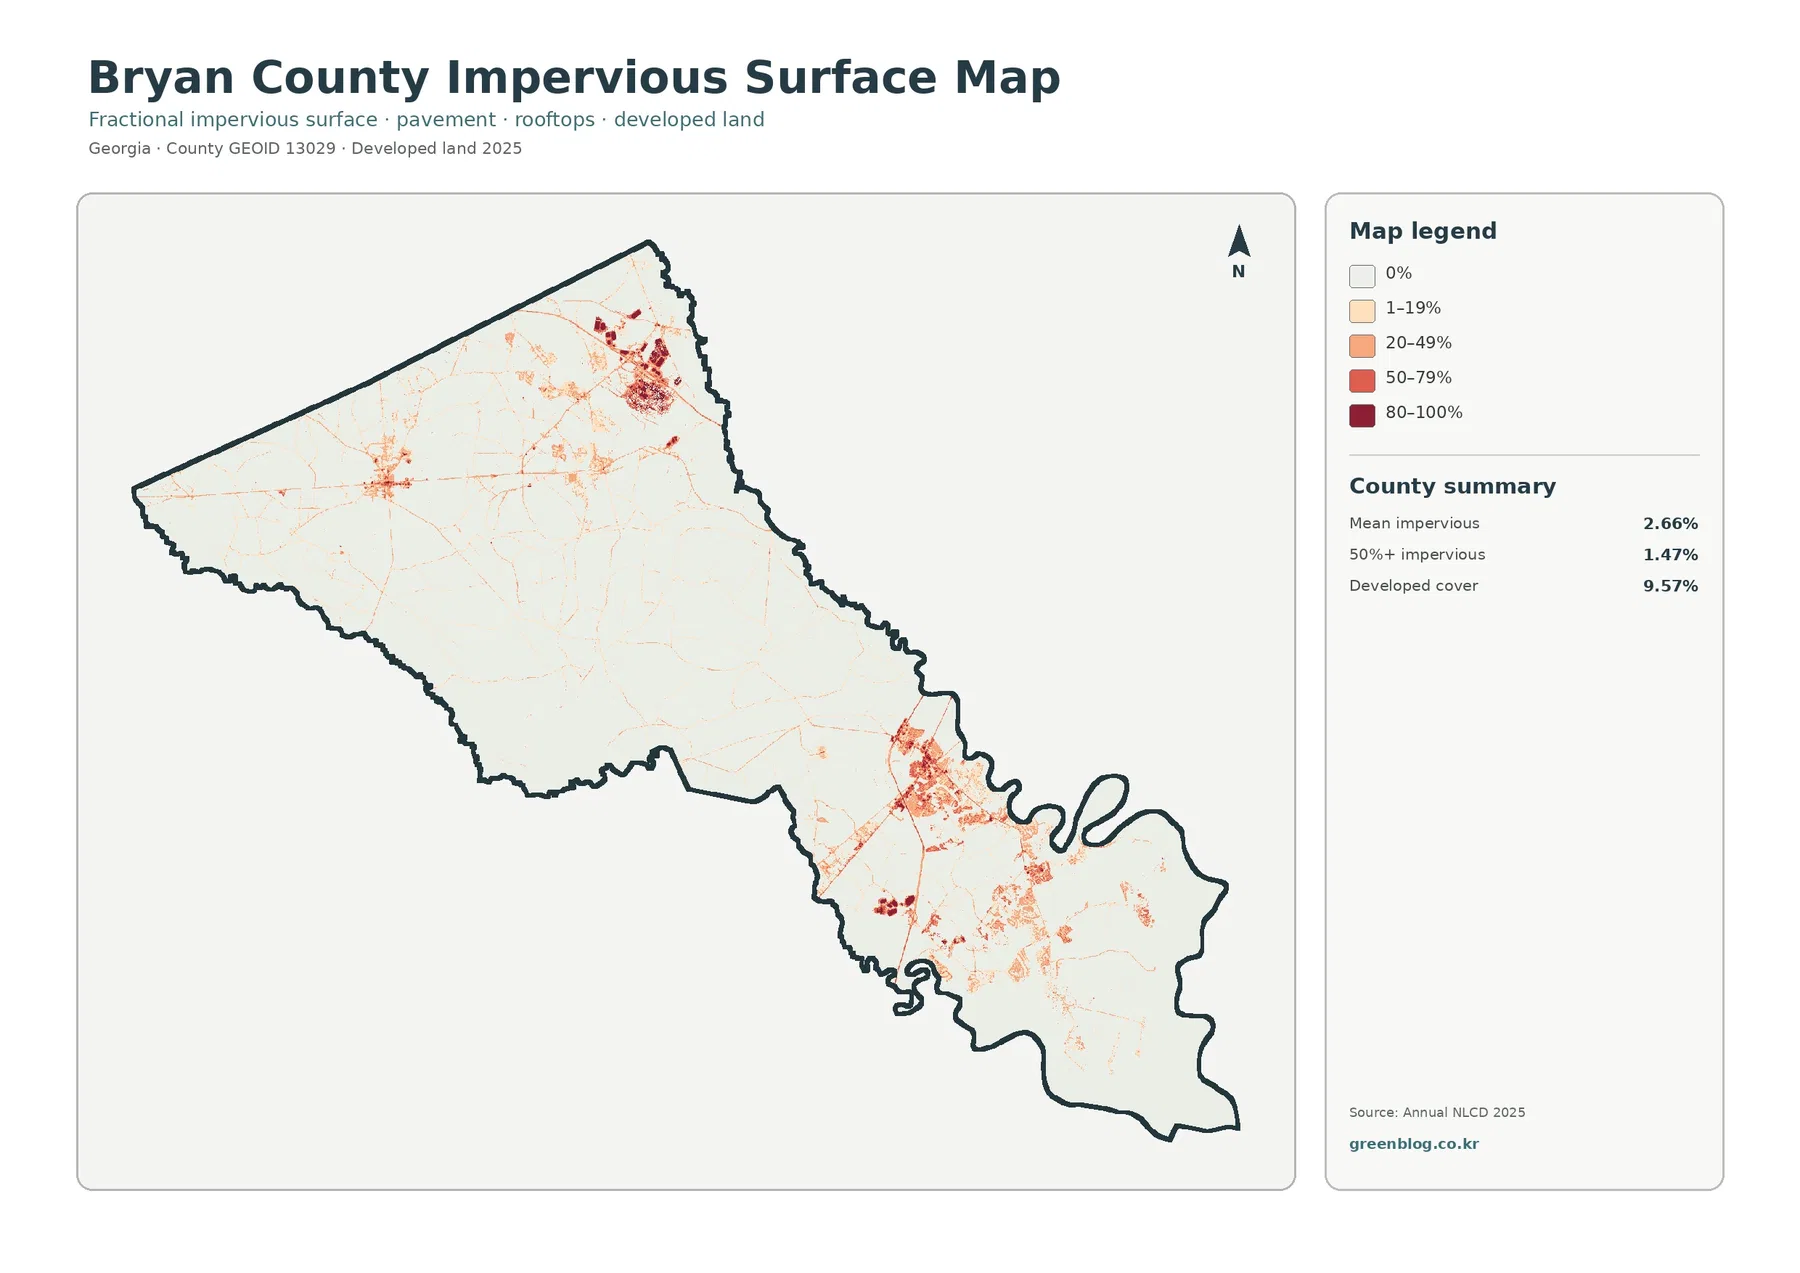
Mean impervious cover is 2.66%, and 1.47% of the county is mapped at 50% or greater impervious surface. Both values are lower than the 9.57% developed share. Developed classes can contain grass, trees, and open soil around roads and buildings, while the impervious layer isolates roofs, pavement, parking areas, and comparable hard materials.
The strongest tones occur inside the northern and southern development concentrations. Thin linear traces and smaller dots surround those areas, but the image provides no road names or traffic information. A line that resembles a highway must be checked against a current transportation map before it is labeled or used to discuss a particular corridor.
A countywide average hides this concentration. Large central areas have little dark shading, while a limited number of places carry much higher values. Impervious cover alone also does not establish flood risk; rainfall, elevation, drainage, soil, streams, and wetlands matter. Use this view to locate hard surfaces, then consult official flood and engineering data for risk decisions.
Choose the map that matches the question and the scale
The 2025 overview works best for introducing Bryan County because it places the wetland-forest majority, limited agriculture, and the two built areas in one frame. Use the vegetation view for forest edges, farm patches, grassland, shrubland, wetlands, and water. Select the impervious map when the question concerns hard-surface intensity rather than all developed acreage.
The 1985–2025 image belongs after the current map in most presentations. Its colors describe endpoint differences, not present-day cover. Showing current conditions first reduces the chance that a viewer will mistake red change cells for all existing developed land or interpret 16.54% as a damage total.
Annual NLCD is a raster product made of 30-meter square cells. Each cell receives one predominant class even when trees, grass, water, pavement, and a building share the space. Narrow roads, small ponds, drainage ditches, and thin forest strips may look wider, narrower, or less continuous than they are on the ground.
The current map represents the supplied 2025 observation year. Later construction, timber activity, vegetation recovery, storm effects, or changes in standing water may not appear. Enlarging the JPG makes symbols easier to see but cannot recover parcel detail absent from the source cells. Current decisions should be checked against newer aerial images and official local data.
Each downloadable JPG measures 2480 × 1754 pixels. The dimensions work for screens and many ordinary print layouts, but the package does not identify them as meeting an A3 high-resolution reference. Test a proof before making a large poster, keep the original proportions, and use authoritative records for surveys, permits, wetland jurisdiction, flood insurance, or military boundaries.
Contents of the four-map JPG package
The ZIP contains one JPG for each view discussed above: 2025 land cover, forest and farmland, impervious surface and developed land, and 1985–2025 land-cover change. Begin with the countywide image, then add the vegetation, hard-surface, or endpoint-difference map that directly supports the point being explained.
Frequently Asked Questions
Why is open water only 3.29% when wetlands cover 41.26%?
Open water represents exposed water surfaces, while wetland classes can include vegetation and seasonally saturated ground. Bryan County therefore has extensive teal wetland areas without an equally large blue-water share. The two classes are related to water conditions but describe different kinds of surface cover.
Can the northern and southern red clusters be assigned directly to Pembroke and Richmond Hill?
They provide broad context for the two ends of the county, but the images do not label cities or draw municipal boundaries. A particular patch should not be assigned to Pembroke, Richmond Hill, or another community without a verified place layer. The same caution applies to the Fort Stewart boundary.
Does the 16.54% class difference mean that much land was damaged?
No. It is the share of cells with different classifications at the 1985 and 2025 endpoints, and the map warns that classification variation may be included. The listed categories are 4.69% classified as developed, 4.79% forest loss, 0.93% agricultural loss, and 5.90% other difference. Timing and cause require intermediate imagery and local evidence.
Sources and Reference Data
- MRLC Annual NLCD Data – official access point for annual land-cover and comparison products
- USGS Annual National Land Cover Database – description of the 30-meter annual land-cover and change product suite
- USGS Annual NLCD Land Cover Classification – class definitions for forest, wetlands, developed land, agriculture, and related surfaces
- U.S. Census Bureau TIGER/Line Shapefiles – official county-boundary reference for Bryan County
- Bryan County Government – Location – county context explaining how Fort Stewart creates northern and southern ends
- UGA Cooperative Extension – Bryan County Agriculture and Natural Resources – local agriculture and natural-resource education and services
Map File Information
The ZIP contains four original JPG maps for comparing Bryan County's wetland and forest cover, separated development clusters, hard surfaces, and 1985–2025 class differences.
- Included Files: Use only the versions confirmed in the article and supplied images
- File Type: Use the confirmed download contents
- Intended Use: Printing, education, presentations, and map-based projects
Related Maps
- Appling County Georgia Land Cover Map
- Atkinson County Georgia Land Cover Map
- Bacon County Georgia Land Cover Map
Green Map creates custom-edited map images using open geographic data sources such as geoBoundaries, Natural Earth, OpenStreetMap, and government open data.
These maps are edited visual materials, not raw data files, and are provided for education, documents, presentations, and graphic reference.