Agriculture is the largest class on the supplied 2025 Brooks County map, but the county does not appear as one uninterrupted field. Yellow farm blocks cover 37.22%, while forest and wetlands form branching green and teal bands between them. A concentrated developed area near Quitman supplies the clearest built landmark. This Brooks County Georgia Land Cover Map explains how those surfaces share the county.
Four views are included: overall 2025 land cover, forest and farmland, impervious surface and developed land, and a 1985–2025 class-difference map. The WebP images can be checked beside the explanation, and the four original JPG maps are available together in one ZIP for county profiles, lessons, presentations, and comparisons with other Georgia counties.
Table of Contents
Agriculture leads, but natural cover supplies the countywide framework
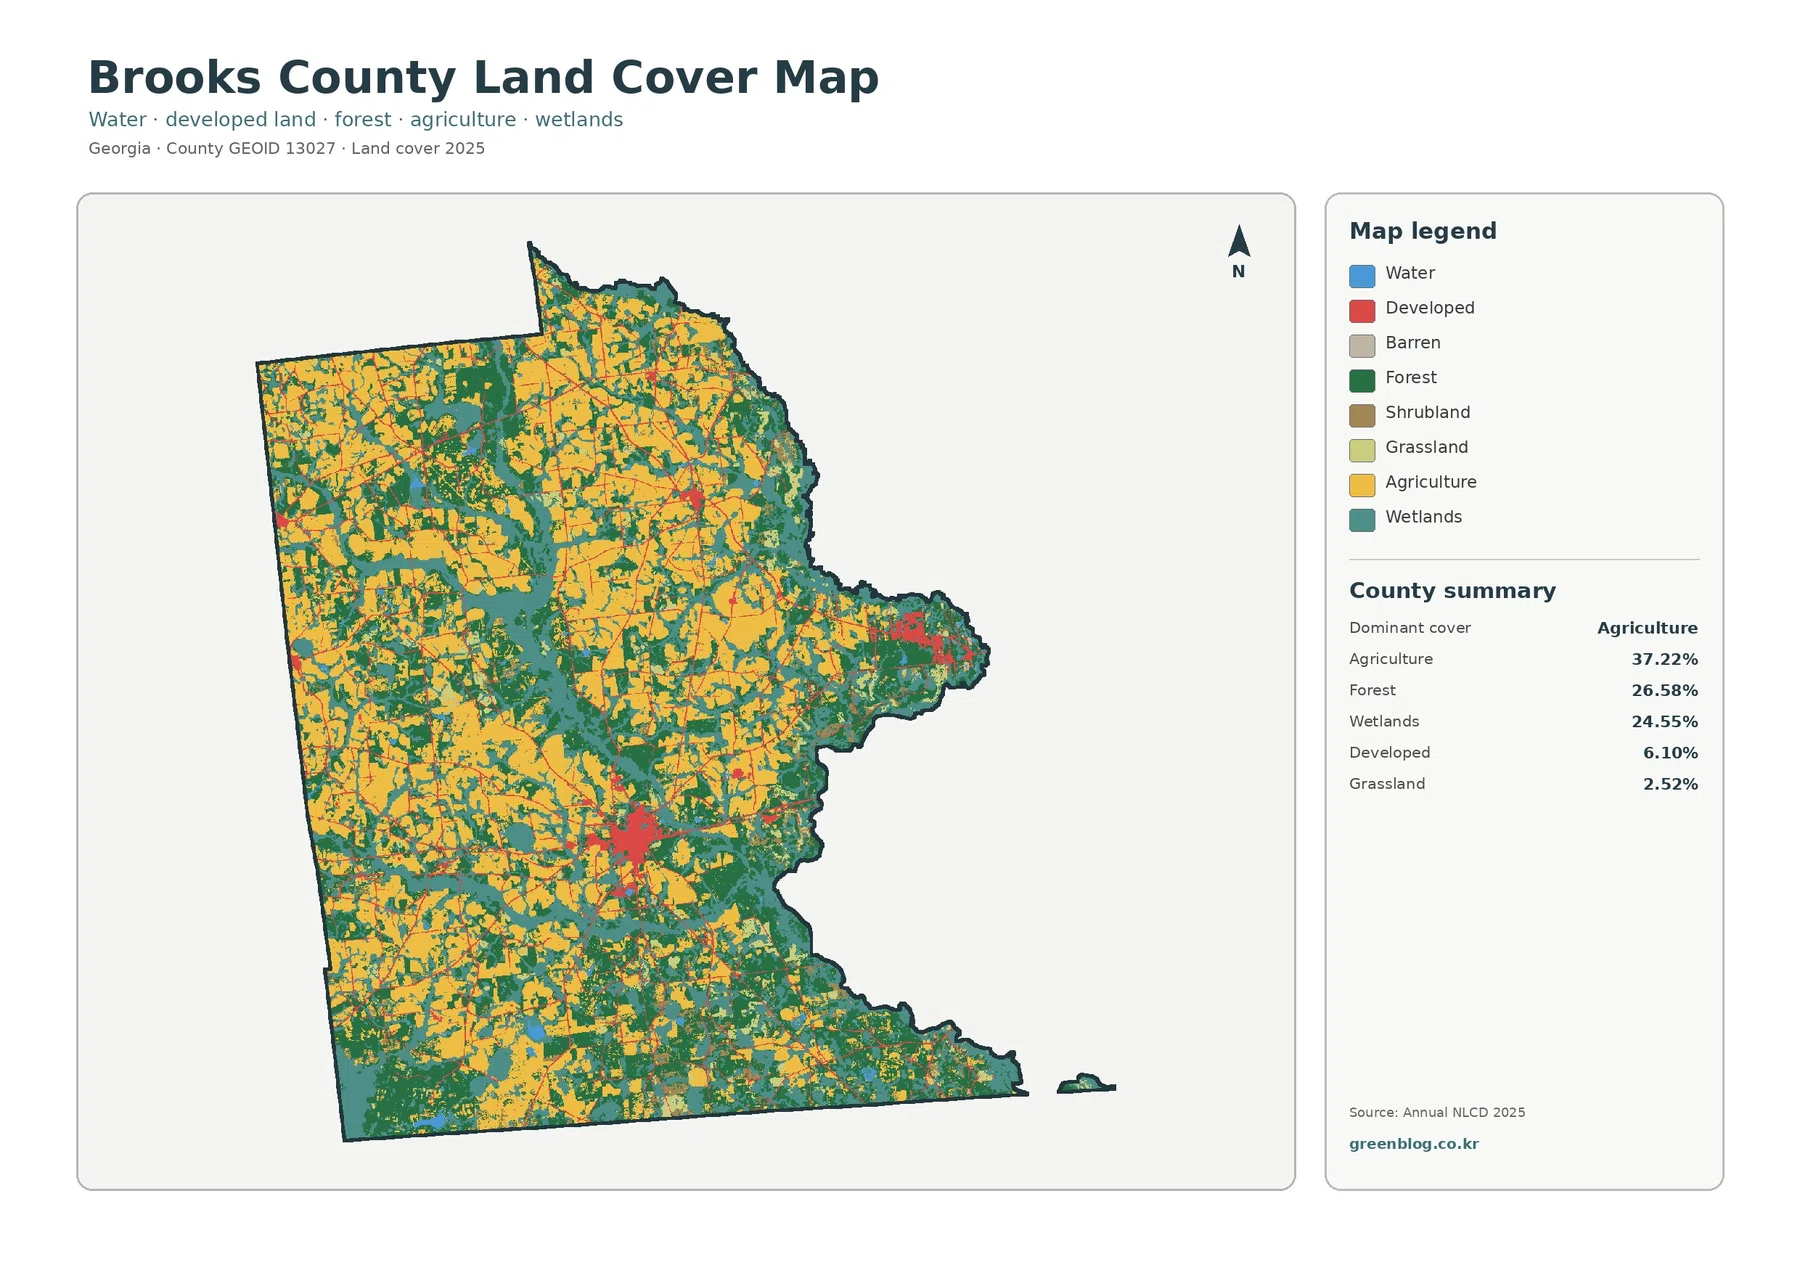
Agriculture accounts for 37.22% and appears in broad blocks across the west, north, and much of the interior. Smaller yellow pieces continue toward the eastern extension and southern edge. Farming is widespread, yet dark natural cover repeatedly interrupts the fields rather than leaving one countywide agricultural sheet.
Forest is 26.58% and wetlands are 24.55%. Together they exceed half of the supplied summary. Dark green blocks and teal bands pass between farmed areas, with clear branching patterns through the center and south and substantial natural cover along the east. Agriculture ranks first individually, but forest and wetlands create much of the map’s structure.
Developed land is 6.10%, although a strong red cluster near the middle aligns with Quitman. Another noticeable concentration occurs in the east, with smaller marks elsewhere. Grassland at 2.52%, shrubland at 2.32%, and open water at 0.66% occupy much smaller shares inside the larger farm, forest, and wetland pattern.
The vegetation view shows where fields meet wet or wooded cover
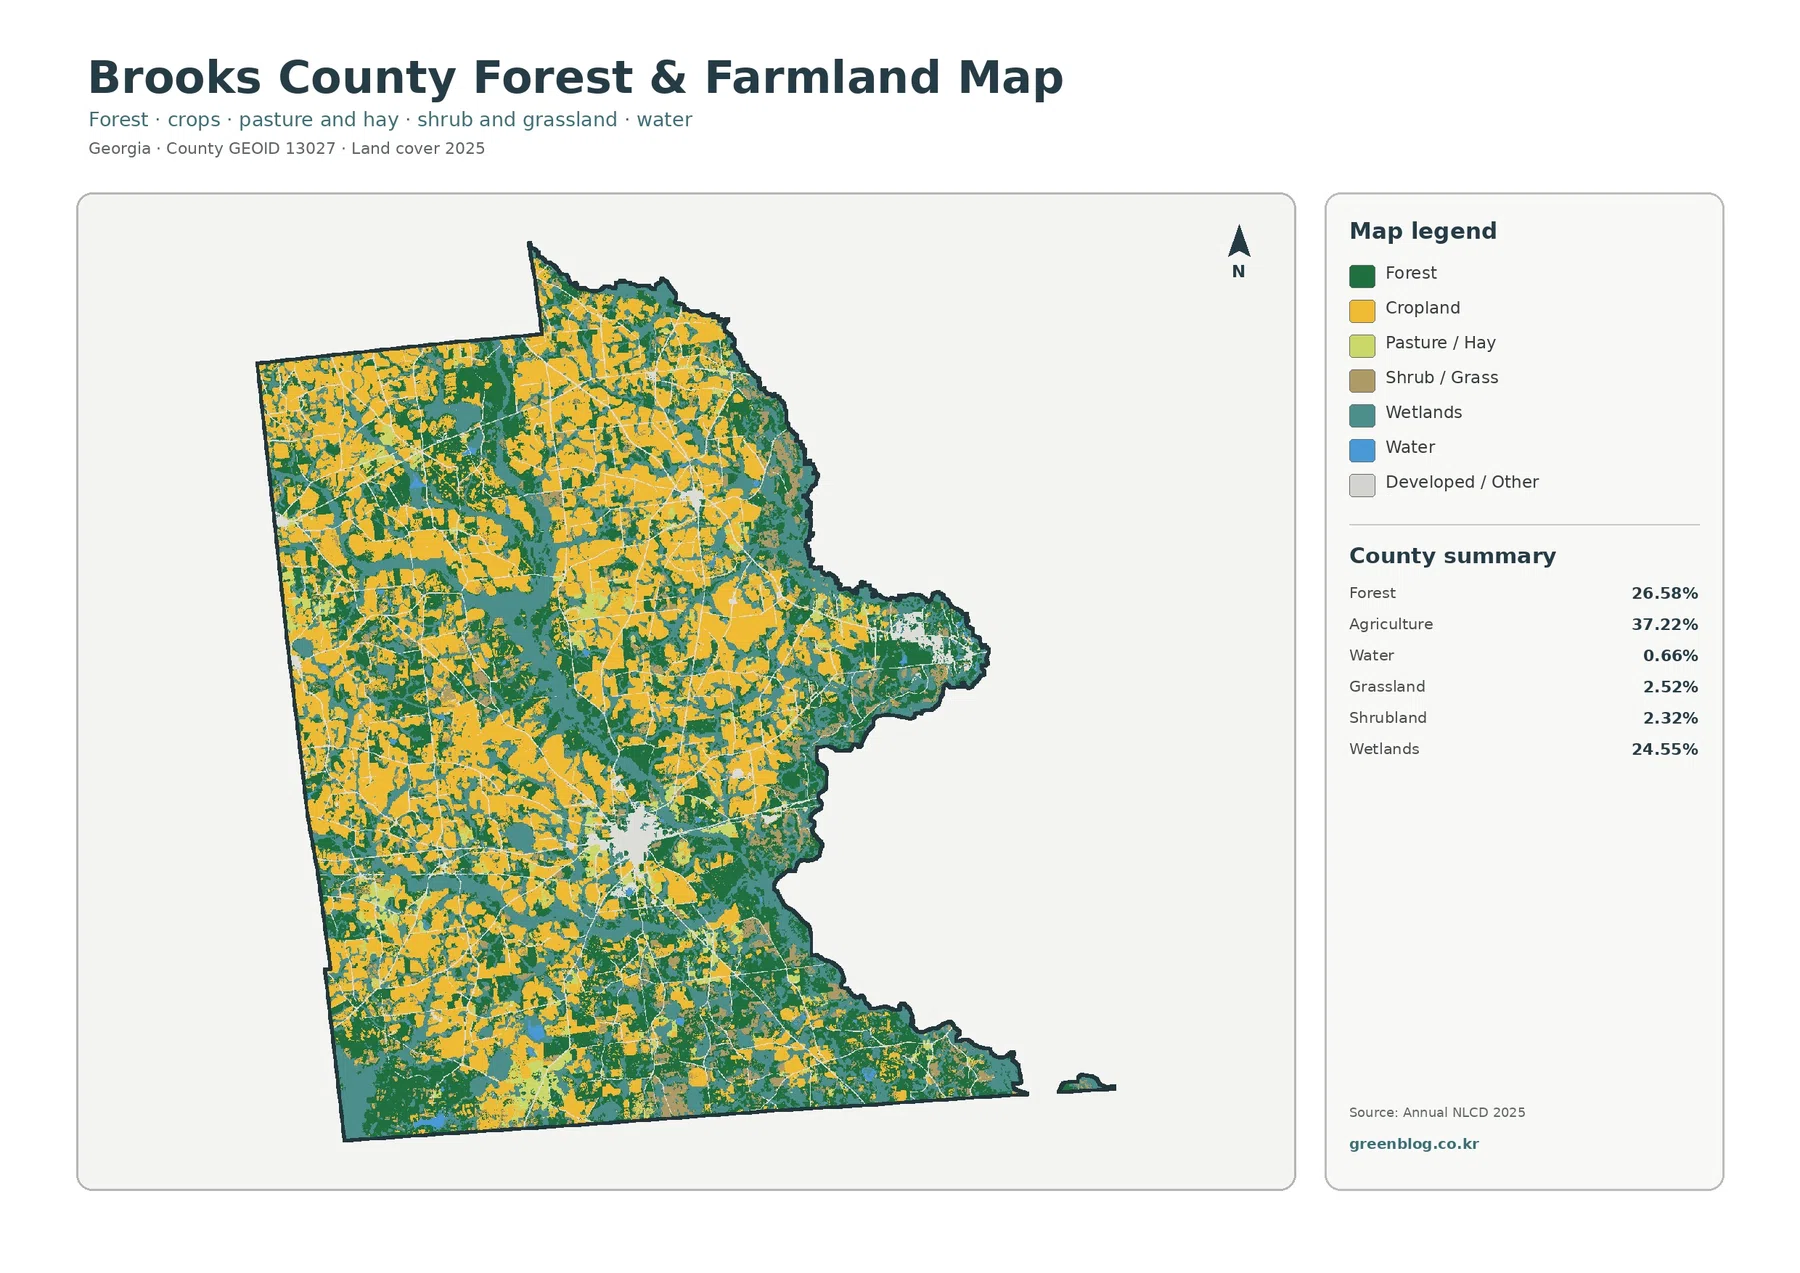
The forest-and-farmland view reduces the visual weight of developed and miscellaneous surfaces. Yellow cropland and light-green pasture or hay are easier to separate from dark forest and teal wetlands. Large farm blocks dominate many western and northern areas, but wooded and wet strips repeatedly pass between them, making this map useful for examining boundaries rather than only totals.
Straight agricultural edges can resemble surveyed fields, yet the colors come from 30-meter raster cells. A tree row, ditch, farm road, idle strip, or wet depression may be absorbed into the dominant class. A 2020 UGA report described commercial vegetable production on sandy and sandy-loam soils in Brooks County, but that crop-specific context cannot replace the broader 2025 agriculture statistic.
Open water is 0.66%, while wetlands cover 24.55%. Water identifies exposed water surfaces; wetlands can include vegetation and seasonally saturated ground. Blue cells are therefore sparse even though teal bands are widespread. The map can compare wetland locations with fields and forest, but it does not show named channels, parcel limits, or regulatory wetland boundaries.
Hard surfaces make Quitman stand out without making the county urban
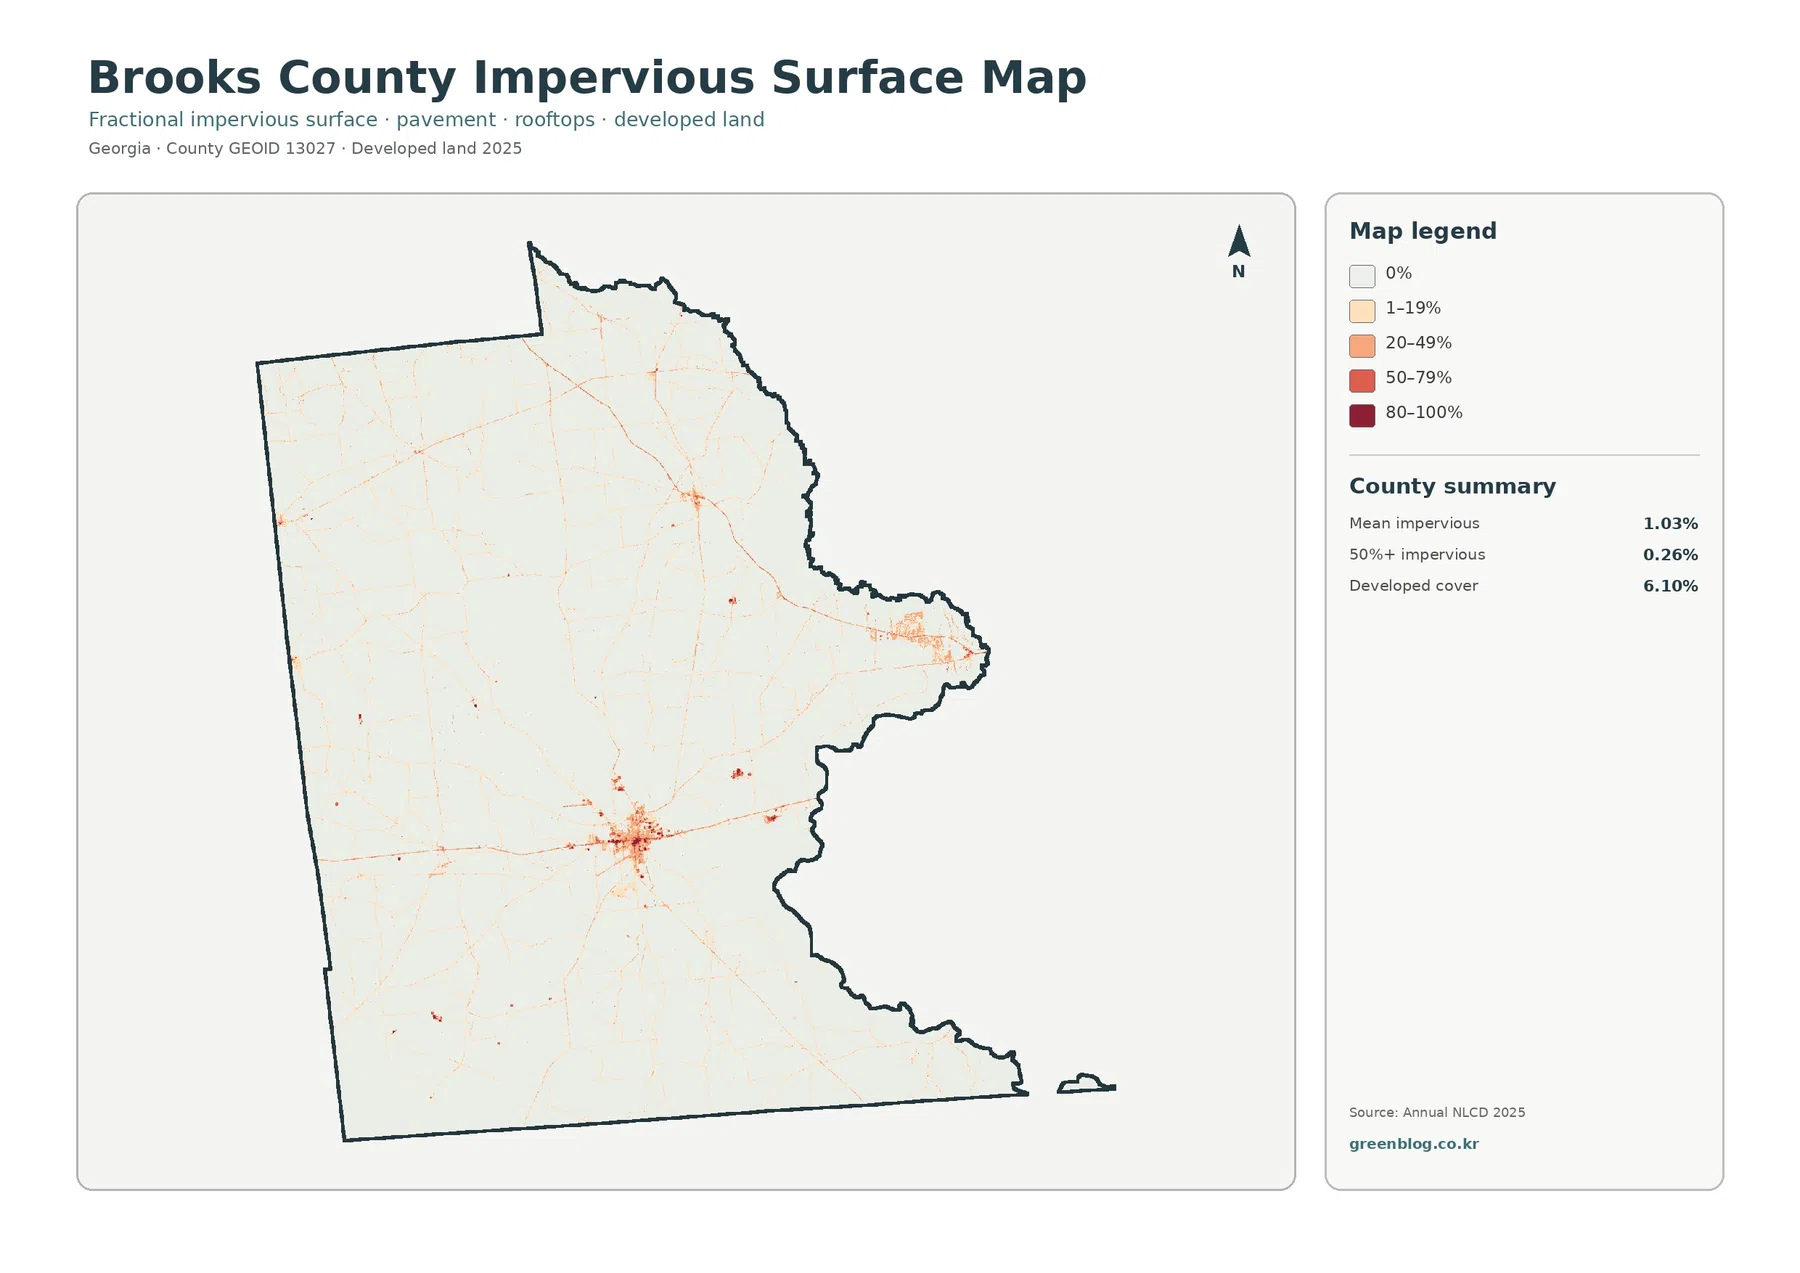
Mean impervious cover is 1.03%, and only 0.26% of the county is mapped at 50% or greater impervious surface. Both figures are far below the 6.10% developed share because developed classes can include lawns, trees, and open soil around buildings and roads. The map separates those permeable surfaces from roofs, pavement, and parking areas.
Quitman forms the densest central cluster, while lighter traces extend outward and smaller concentrations appear elsewhere. Georgia DCA planning materials group Brooks County with Barwick, Morven, Pavo, and Quitman. Because the image has no place labels, small patches should not be assigned to individual towns without an official municipal or transportation map.
The 1985–2025 map marks endpoint differences, not a forty-year movie
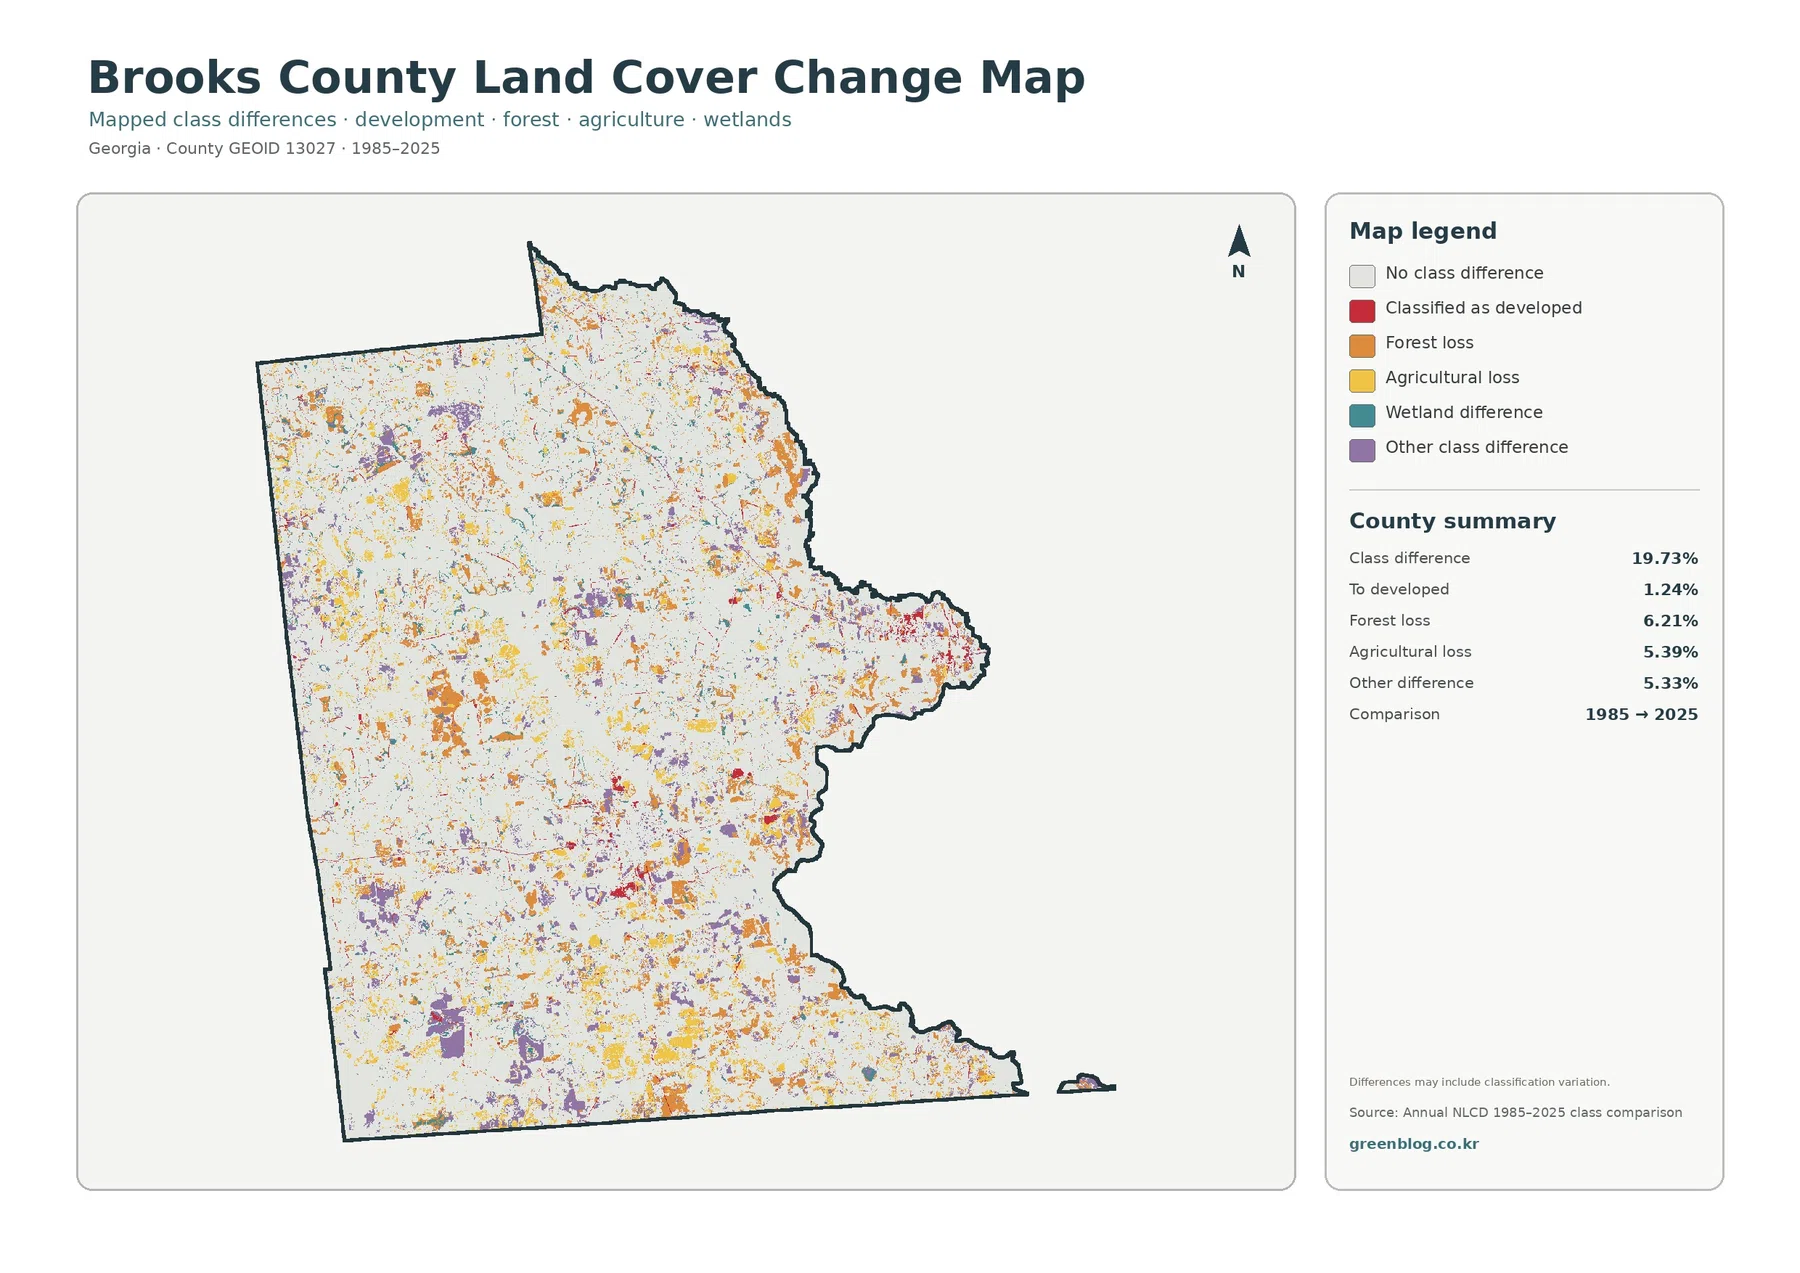
The change map reports 19.73% total class difference between 1985 and 2025. It should not be described as 19.73% of Brooks County being damaged or physically transformed. The map warns that classification variation may be included, since imagery date, seasonal conditions, mixed pixels, and classification decisions can affect an endpoint label.
Forest loss is 6.21%, agricultural loss 5.39%, developed conversion 1.24%, and other difference 5.33%. Orange and yellow marks are scattered across the county, while red is easiest to notice near Quitman and some connecting traces. The legend also includes wetland difference, but the summary gives no separate percentage, so an exact rate cannot be estimated by eye.
“Loss” means that an earlier forest or agricultural cell received a different class at the later endpoint. It does not establish harvesting, abandonment, development, or another cause. A place may also change more than once between 1985 and 2025 and finish near its starting class, which a two-date comparison may not reveal.
Use this layer for screening: compare larger orange, yellow, purple, or red clusters with the 2025 map, then check intermediate Annual NLCD years, aerial photographs, forestry records, agricultural records, or local planning material. The map identifies places for closer study rather than assigning ownership, intent, or responsibility.
Pride Branch adds local context for only part of Brooks County
Georgia’s Pride Branch watershed plan places the watershed in Brooks County, within the Suwannee River Basin and the Coastal Plain. It describes Pride Branch as extending toward Piscola Creek south of Quitman and notes that local streams generally flow southward. Those facts help explain why drainage and wetland cover matter in the central and southern county.
Pride Branch is one sub-watershed, not the whole county, so its local statistics cannot replace the countywide 37.22% agriculture value. The unlabeled teal bands also cannot be assigned to named streams without hydrography data.
Choose one map for the question and a second for contrast
Use the general map for a county profile, the forest-and-farmland map for field edges and natural-cover connections, and the impervious map for the Quitman-centered hard-surface pattern. Explain the 2025 condition before showing the class-difference layer so viewers do not mistake an endpoint-change color for a current land-cover class.
Thirty-meter cells and observation dates limit what the image can prove
Annual NLCD assigns one predominant class to each 30-meter raster cell even when crops, trees, a ditch, grass, pavement, and a building share the same area. Brooks County’s many farm-forest-wetland edges make this important when viewers zoom into small patches or treat a straight color boundary as a survey line.
The 2025 map represents the supplied observation year, so later construction, harvest conditions, vegetation recovery, timber activity, or flooding may not appear. Enlarging the original JPG improves readability but cannot recover detail absent from the source cells. Ownership, zoning, wetland jurisdiction, flood zones, building permission, and road status require separate current data.
What is included in the four-map JPG download
The ZIP contains the four original JPG maps used here. Choose the general, vegetation, impervious, or change view according to the main question, and add a second image only for a direct comparison.
Frequently Asked Questions
Is Brooks County simply an agricultural landscape?
Agriculture is the largest individual class at 37.22%, but forest is 26.58% and wetlands are 24.55%. Forest and wetlands together exceed half of the supplied summary and form branching bands between the farm blocks. Agriculture leads, but the county is not one continuous field.
Why is developed cover 6.10% while mean impervious cover is only 1.03%?
Developed land can include lawns, trees, open soil, and other permeable surfaces around buildings and roads. Impervious cover isolates rooftops, pavement, parking areas, and similar hard materials. The Quitman area can therefore be the strongest built cluster while the countywide impervious average remains low.
Does the 19.73% class difference equal physical land loss?
No. It is the share of cells classified differently in 1985 and 2025, and classification variation may be included. Forest loss at 6.21%, agricultural loss at 5.39%, developed conversion at 1.24%, and other difference at 5.33% are screening indicators. Timing and cause require intermediate imagery and local evidence.
Sources and Reference Data
- MRLC Annual NLCD Data – official access point for annual land-cover and comparison products
- USGS Annual NLCD Land Cover Classification – definitions and guidance for agriculture, forest, wetlands, developed land, and related classes
- U.S. Census Bureau TIGER/Line Shapefiles – official county-boundary reference for Brooks County
- Georgia DCA – Brooks County and Cities Comprehensive Plan – planning materials for Brooks County, Barwick, Morven, Pavo, and Quitman
- Georgia EPD – Pride Branch Watershed Management Plan – local context for Pride Branch, Piscola Creek, Quitman, and the Suwannee River Basin
- UGA Cooperative Extension – 2020 Vegetable Extension and Research Report – county-specific context for commercial vegetable production and sandy soils
Map File Information
The ZIP contains the four original JPG maps used to compare land cover, working lands, hard surfaces, and two-date class differences in Brooks County.
- Included Files: Use only the versions confirmed in the article and supplied images
- File Type: Use the confirmed download contents
- Intended Use: Printing, education, presentations, and map-based projects
Related Maps
- Appling County Georgia Land Cover Map
- Atkinson County Georgia Land Cover Map
- Bacon County Georgia Land Cover Map
Green Map creates custom-edited map images using open geographic data sources such as geoBoundaries, Natural Earth, OpenStreetMap, and government open data.
These maps are edited visual materials, not raw data files, and are provided for education, documents, presentations, and graphic reference.