The Bacon County Georgia Land Cover Map is unusual for how closely its two leading classes match. Agriculture accounts for 29.92% of the 2025 summary and wetlands for 29.19%, followed by forest at 20.72%. Developed land covers 8.13%, grassland 6.07%, shrubland 5.27%, and open water 0.53%. Instead of one dominant surface, the county is a close mix of working land, wet ground, and wooded areas surrounding a compact built concentration.
This article includes four views of the same county: current land cover, forest and farmland, impervious surface, and the 1985–2025 class comparison. The WebP images are intended for easy on-page comparison, while the four original JPG maps can be downloaded together in one ZIP below. They are useful for agriculture and forestry discussions, classroom work, county profiles, and comparisons with nearby Georgia counties.
Table of Contents
The farmland map makes Bacon County’s agricultural character easier to see
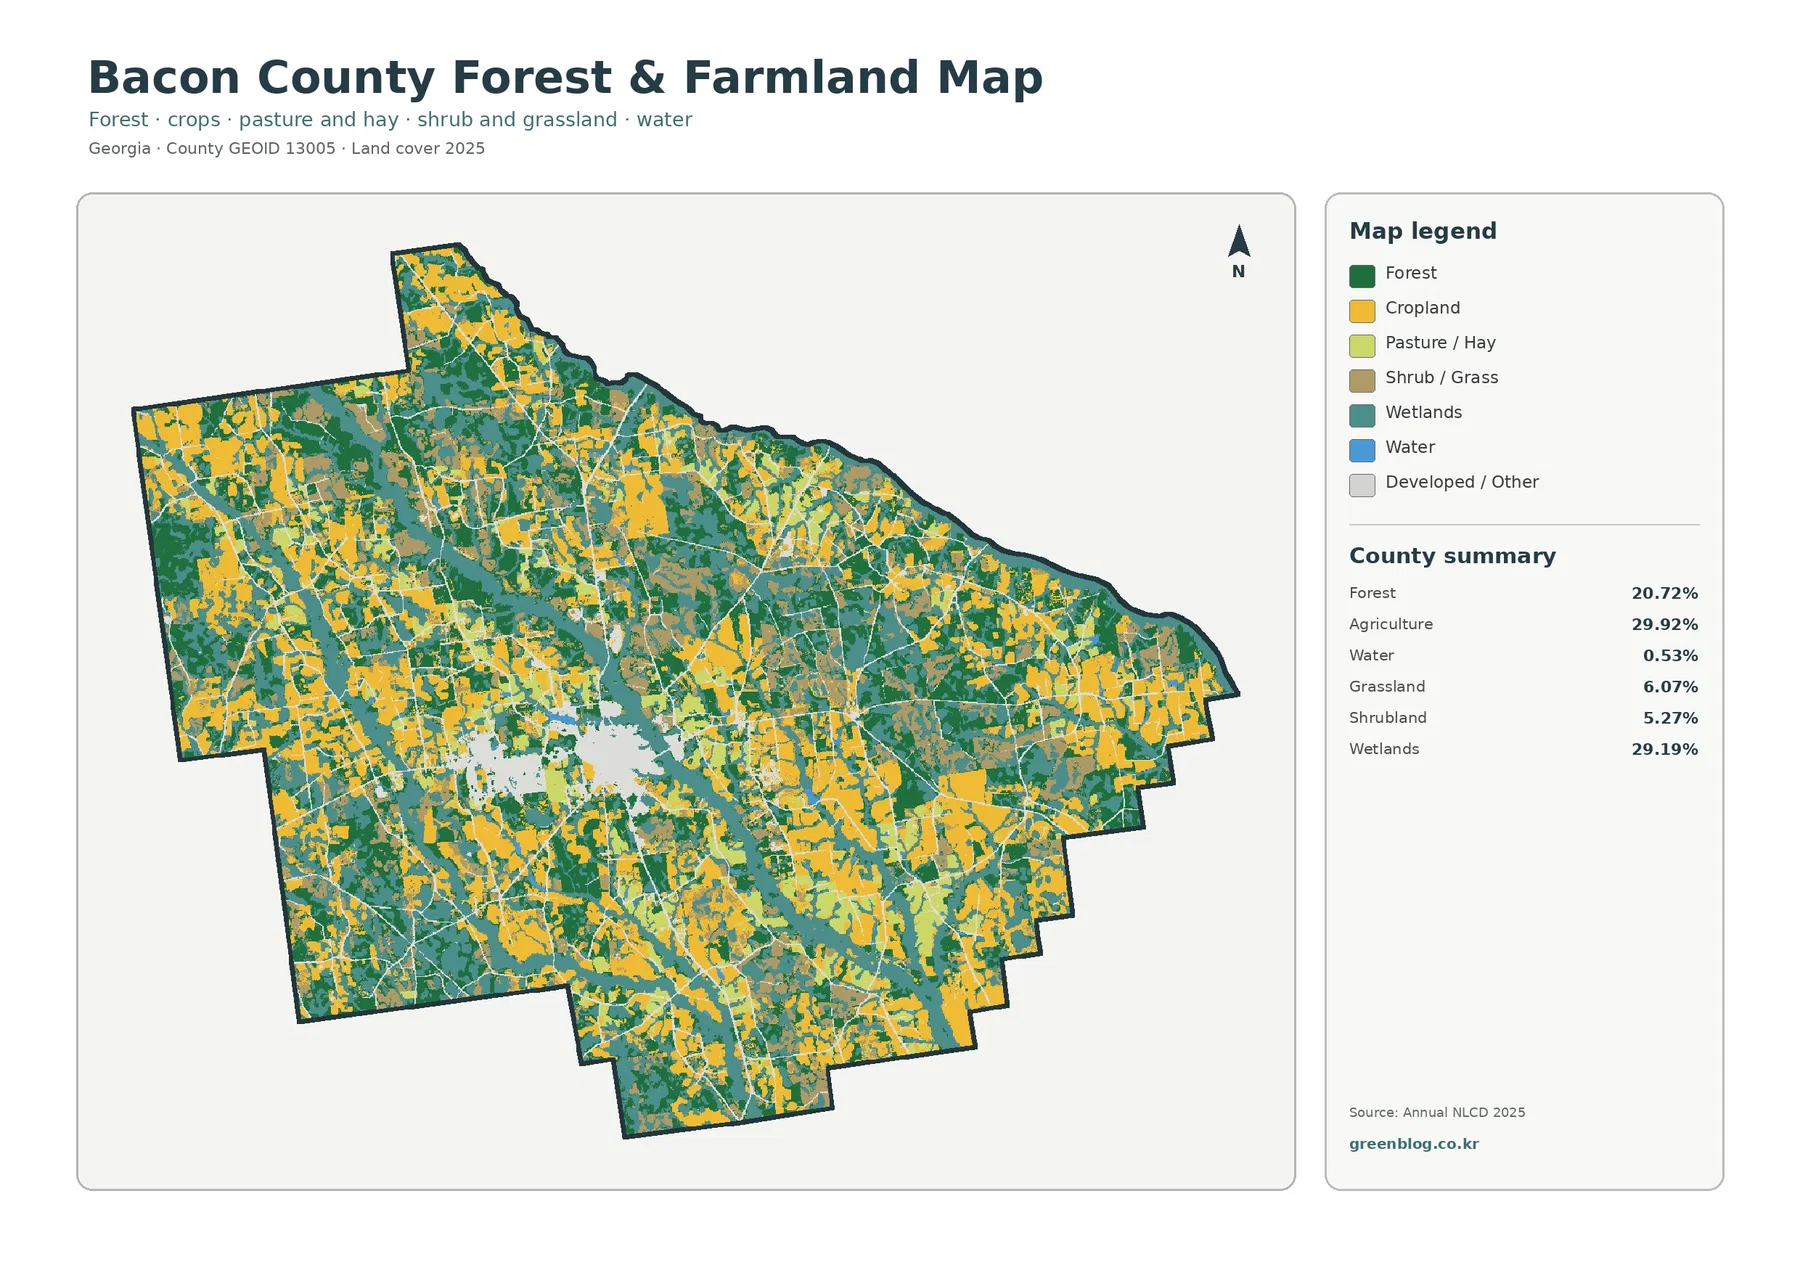
Cropland is widespread rather than confined to one corner of Bacon County. Large yellow areas appear in the west and south, and substantial agricultural blocks continue through the north and east. Pasture or hay is shown separately in a lighter green. Forest and wetlands divide many of these working-land areas, so the map reads as a mosaic of farms and natural cover rather than a continuous field district.
The verified county agriculture total is 29.92%. Although the legend separates cropland from pasture or hay, the package does not provide exact percentages for those subtypes. Their locations can be compared visually, but creating new shares by counting map pixels would go beyond the supplied evidence.
UGA Extension Bacon County gives the agricultural pattern useful local context. Its Agriculture and Natural Resources page identifies blueberries as the county’s major agricultural product and also lists cotton, peanuts, hay, corn, and soybeans among local production. That supports agriculture’s importance without allowing a specific yellow cell to be labeled as a blueberry field or any other crop.
Grassland at 6.07% and shrubland at 5.27% are also visible around farms, wetlands, and forest. Those classes matter because not every open-looking surface is agricultural. Mixed vegetation, idle ground, and transitional areas can receive a grass or shrub class even when they sit next to cropland. At county scale, their small boundaries should be treated as generalized rather than parcel-accurate.
Wetlands nearly match agriculture and occur throughout the county
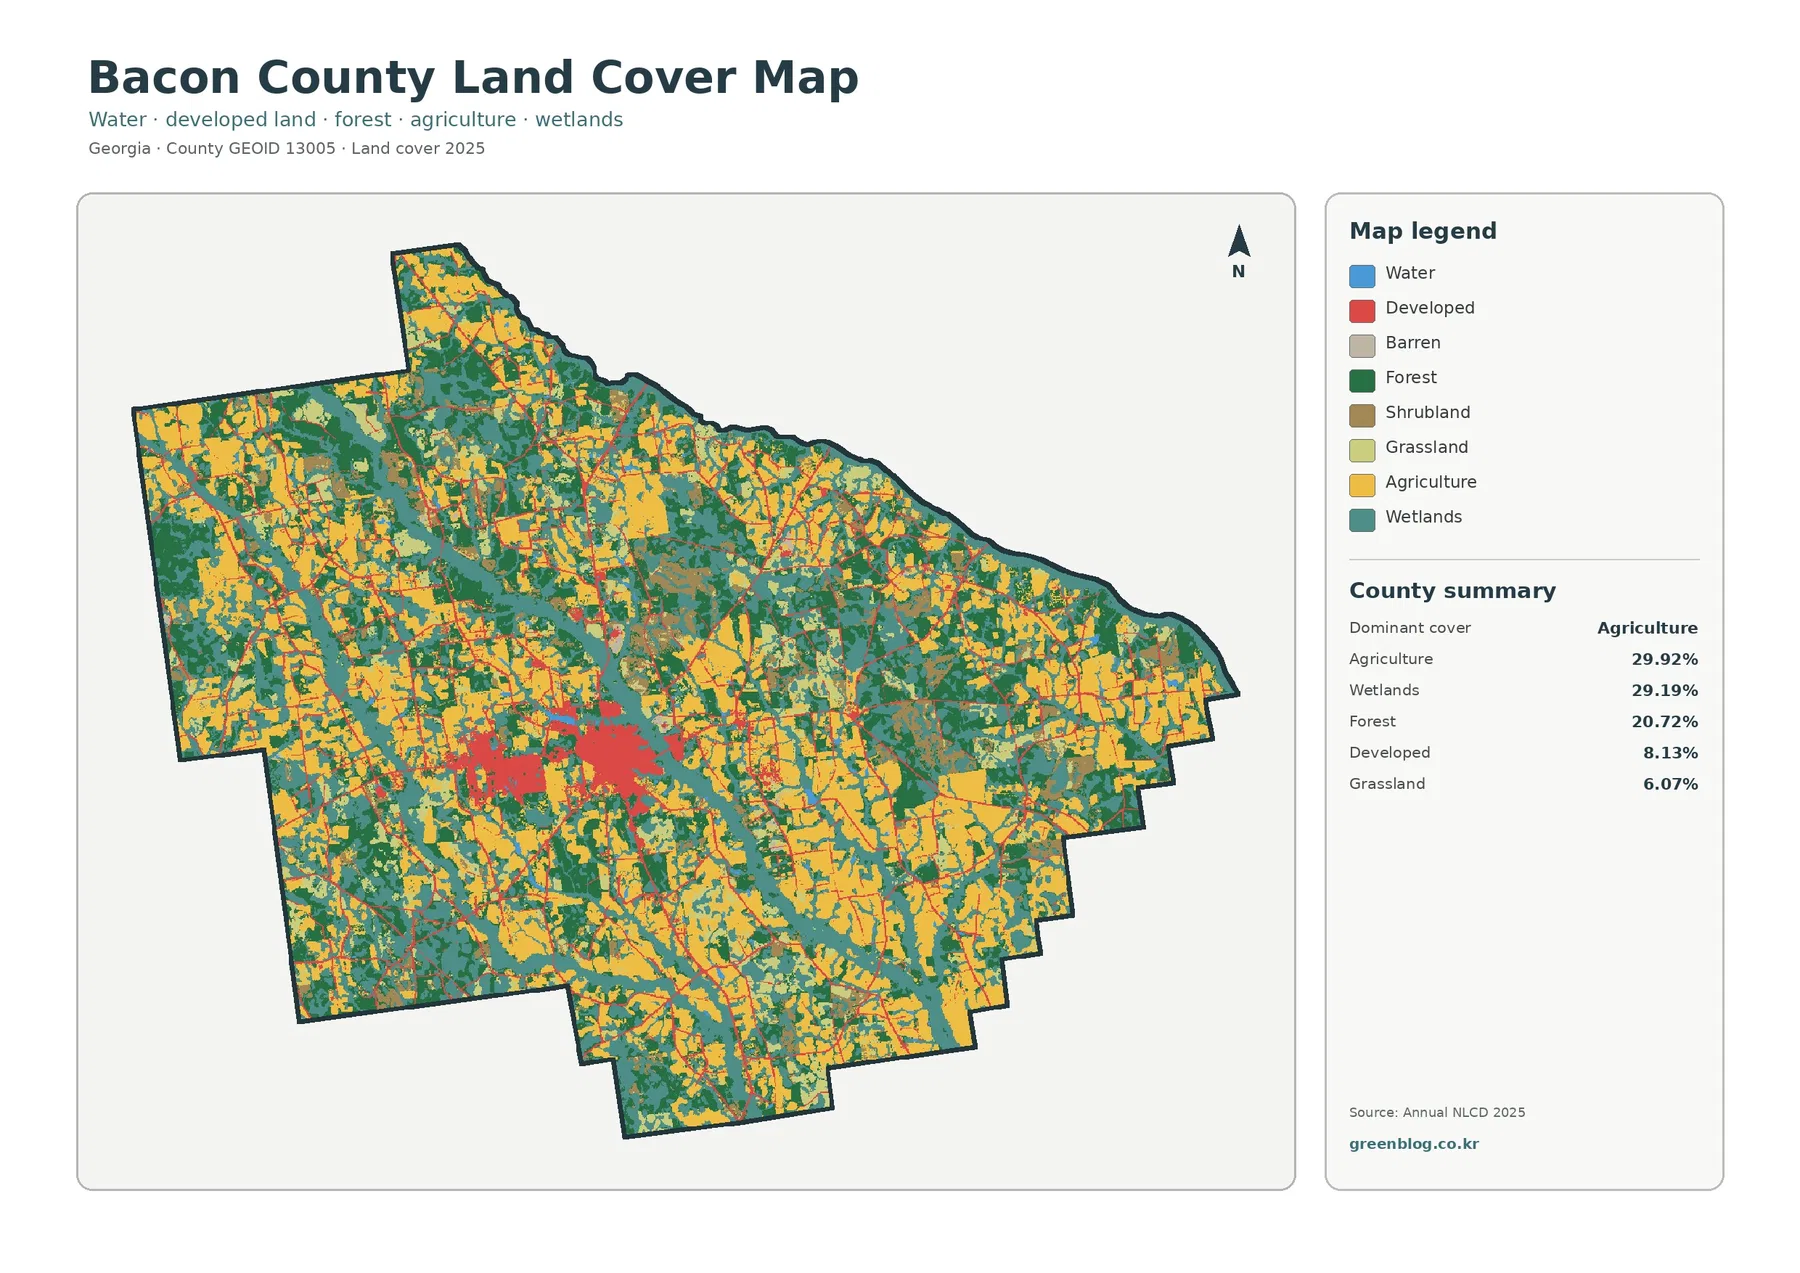
Wetlands cover 29.19%, only 0.73 percentage points less than agriculture. Teal cells are broad through central, northern, eastern, and southern parts of the county and repeatedly separate field and forest areas. This wide distribution is more important than treating wetlands as a single isolated zone. They are woven through much of the rural landscape.
Open water is only 0.53%, which creates a strong contrast with the wetland share. A wetland cell can represent saturated soil, wetland vegetation, or forested wet ground without appearing as an open blue water body. Bacon County is therefore a useful example of why a wet landscape can have very little mapped open water.
Forest accounts for 20.72%. Dark green is common in the northwest and north and continues through central, eastern, and southern portions in smaller blocks. Forest repeatedly borders both agriculture and wetlands. That arrangement makes the county more complex than a simple farm-versus-forest split.
The developed class occupies 8.13%. Its largest red concentration lies slightly west of the map center, with thinner developed traces radiating outward and smaller clusters elsewhere. Bacon County and the City of Alma maintain a joint comprehensive plan, which is the appropriate source for local planning and municipal context. The raster map itself should not be used to define Alma’s legal boundary or a parcel’s development status.
Hard surfaces occupy a much smaller share than the developed class
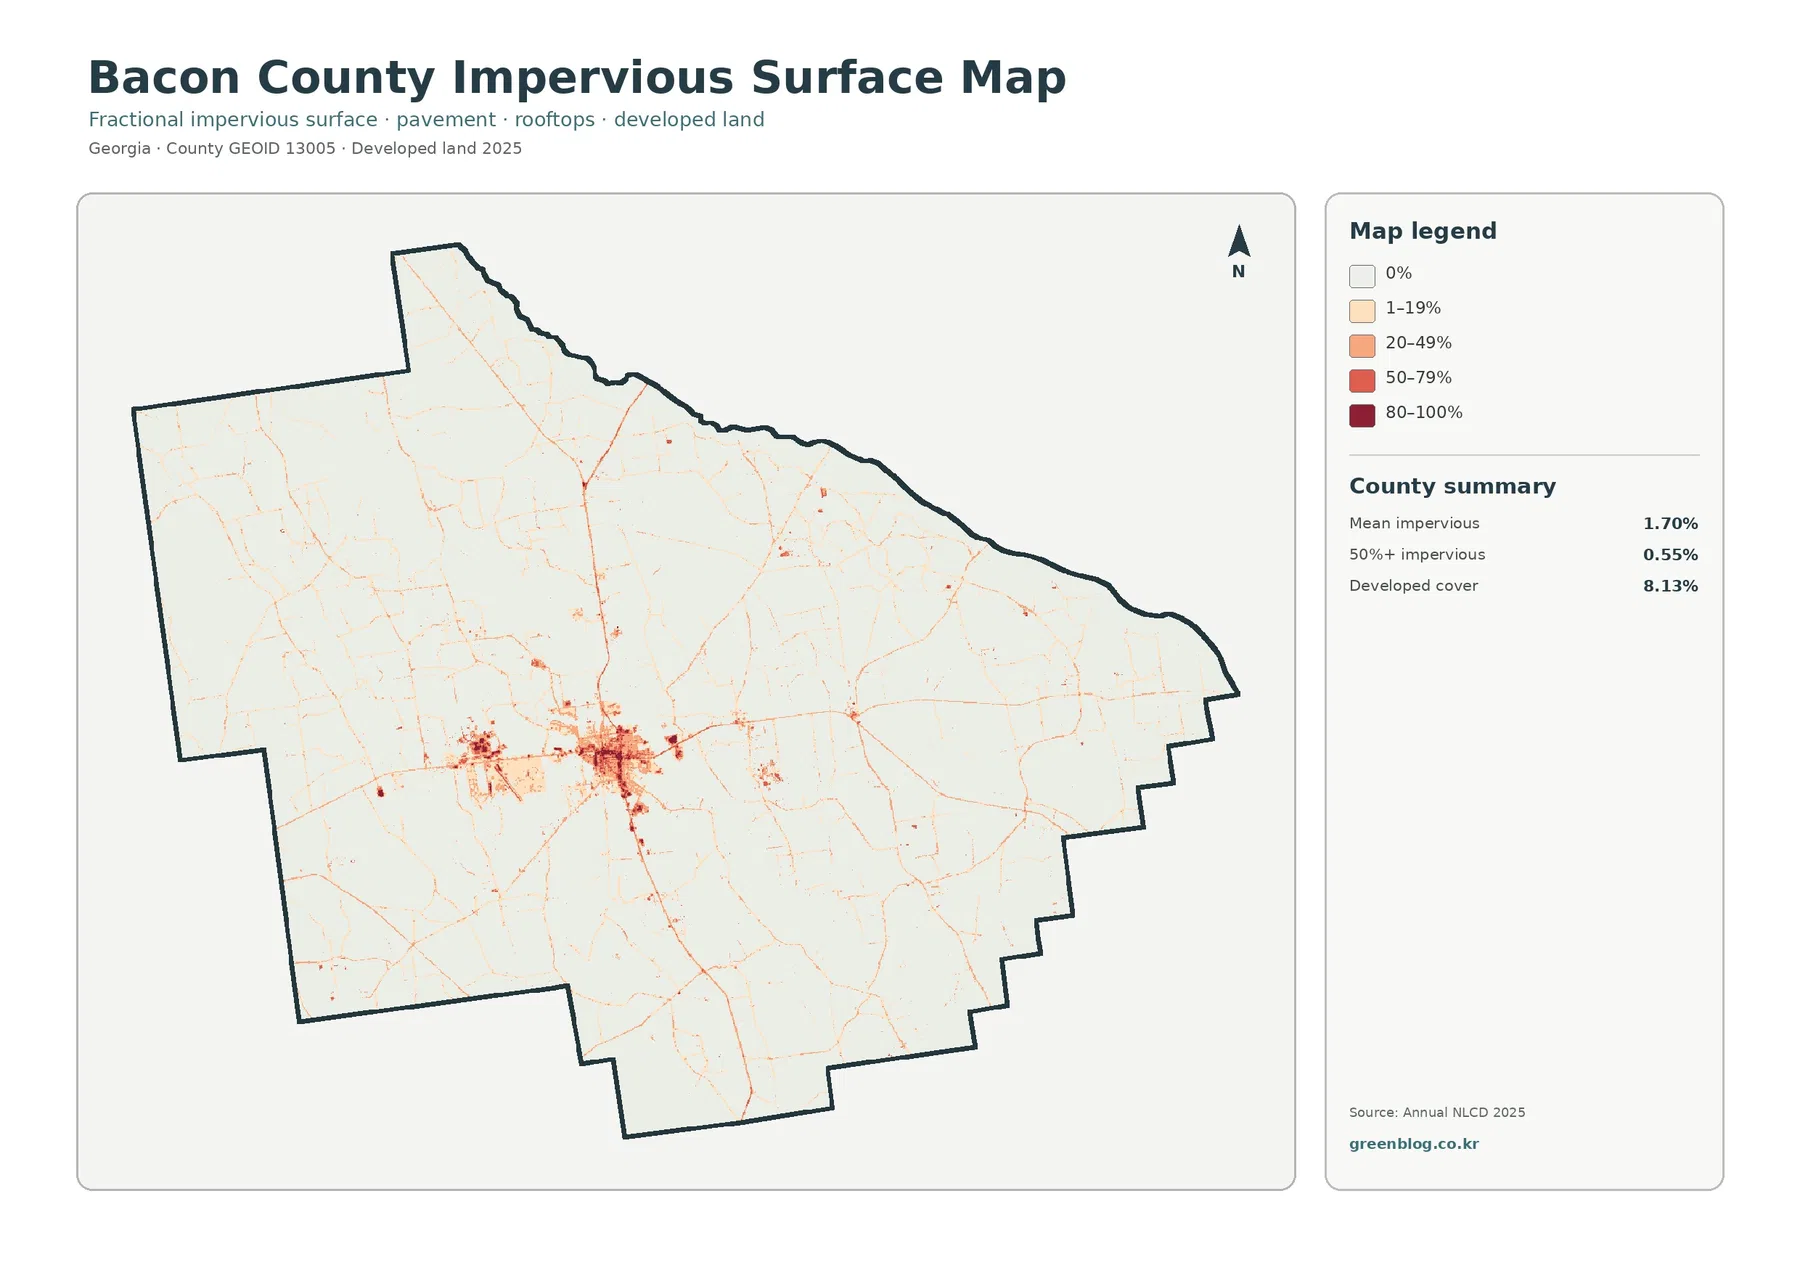
Mean impervious cover is 1.70%, and 0.55% of the county is mapped at 50% or greater impervious surface. These numbers are far lower than the 8.13% developed-land share. Developed land is a broader class that can include lawns, trees, bare ground, and other permeable surfaces together with buildings and pavement. Impervious cover isolates hard surfaces such as rooftops, roads, and parking areas.
The darkest reds are limited to the main developed concentration, while narrow orange and red lines extend through several directions. Most agricultural, wetland, and forest areas remain nearly white. That contrast shows why a visible town or road corridor can stand out on a map even when the countywide share of hard surface is very low.
Those thin red lines should not be interpreted as a road map. Route names, traffic volume, lane counts, and pavement condition are not part of the impervious layer. A low impervious value also does not establish low flood risk. Rainfall, drainage, soils, terrain, streams, and wetlands all affect how water moves through the landscape.
The 1985–2025 comparison has a large 35.51% class difference
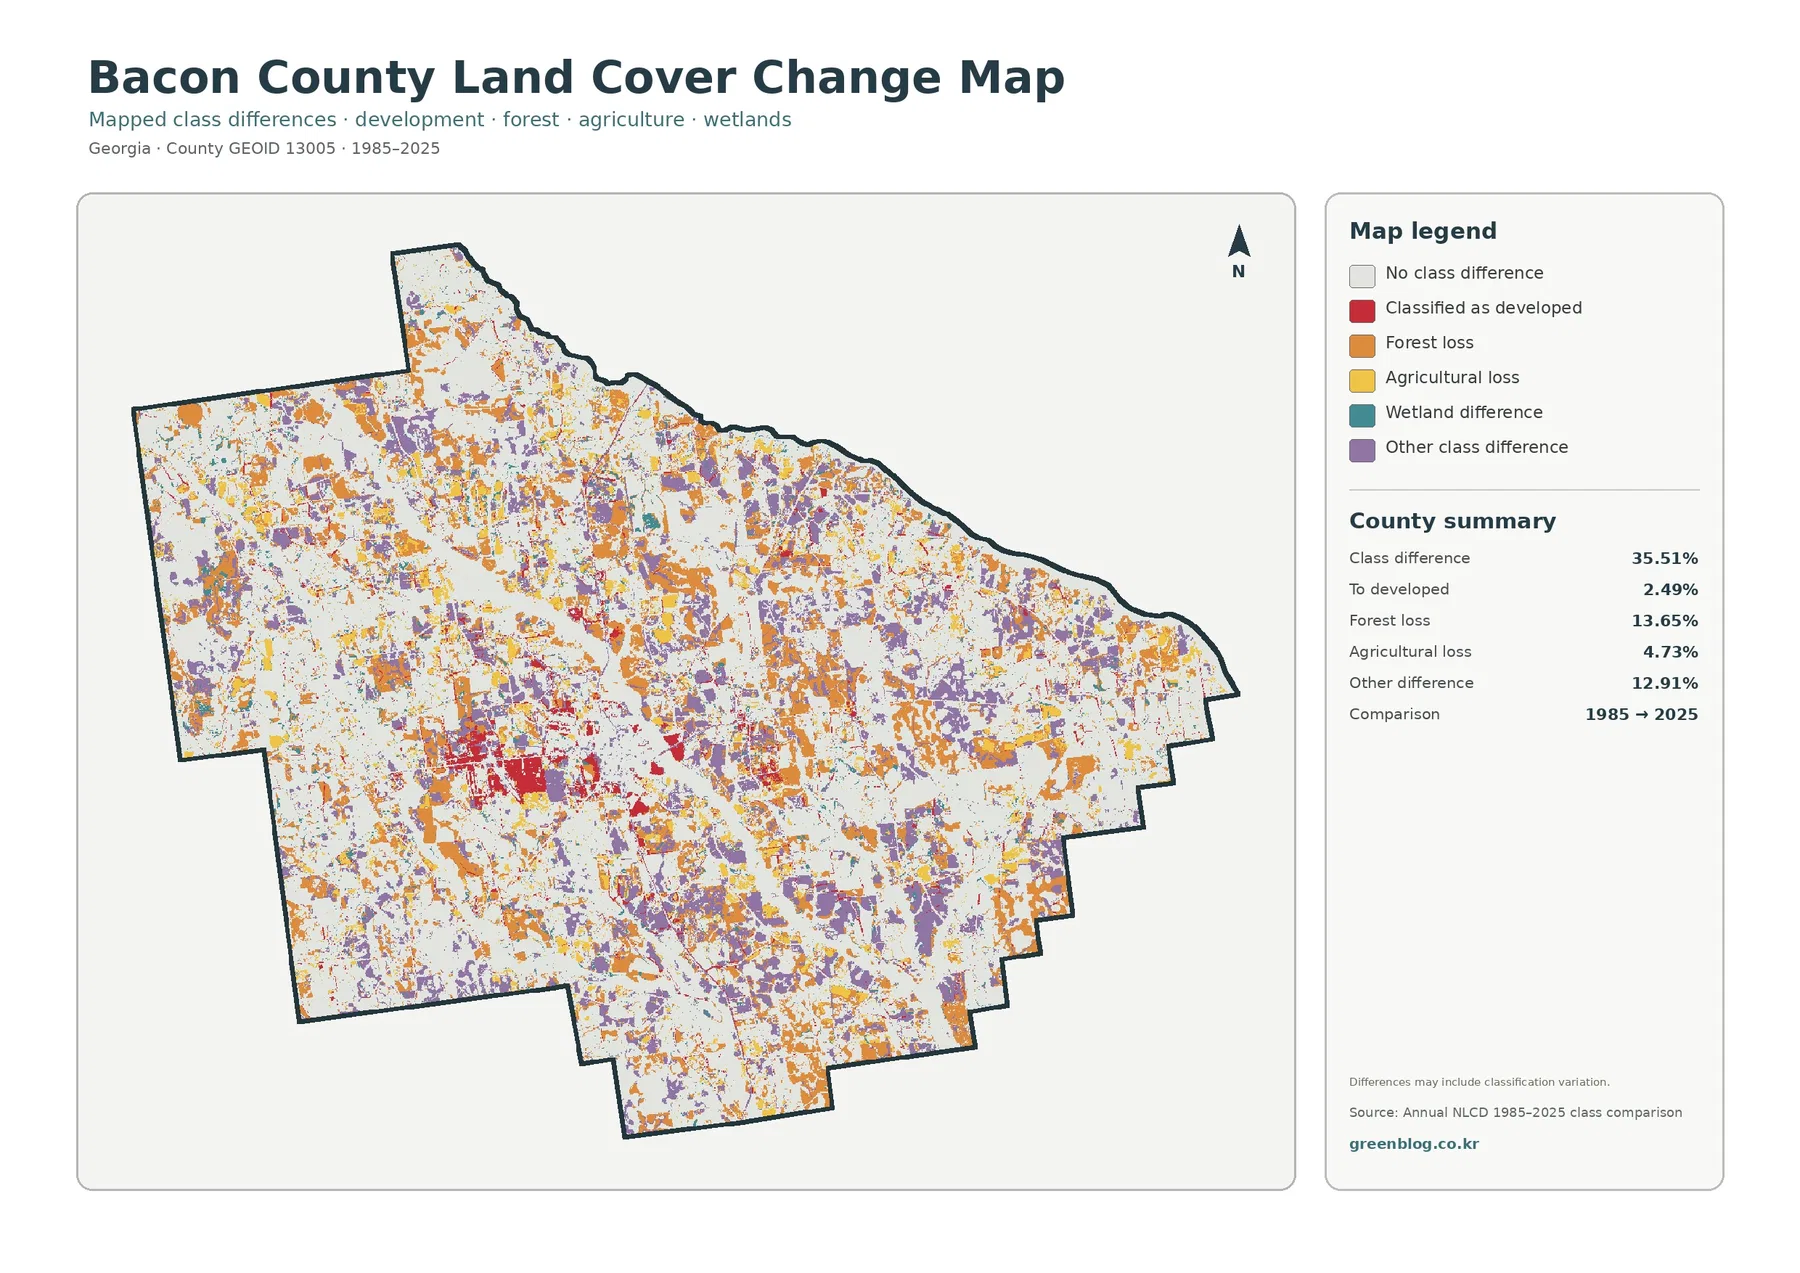
The total class difference between 1985 and 2025 is 35.51%. That figure should not be rewritten as if 35.51% of Bacon County was physically transformed. The map identifies raster cells that received different land-cover classes at the two endpoints. Real land change can be included, but imagery conditions, season, classification methods, and mixed cells may also affect the result.
Forest loss is the largest named difference category at 13.65%. Orange cells are widespread across the north, center, east, and south. The current forest share of 20.72% and the forest-loss value answer different questions: one describes the 2025 endpoint and the other marks a two-date difference category.
Agricultural loss is 4.73%, cells classified as developed account for 2.49%, and other class difference is 12.91%. Purple other-difference areas are common across much of the county, while red developed differences are more concentrated around the existing built area. Wetland difference appears in the legend, but no separate verified county percentage is supplied for it.
Nearby change colors do not prove cause. A forest-loss cell beside a developed-difference cell does not by itself show that development caused the forest change. Forestry activity, agricultural conversion, vegetation recovery, hydrologic conditions, storm effects, or classification variation could all contribute. A site-specific explanation needs intermediate imagery or local land-use records.
Three comparisons help prevent common mistakes when reading the maps
First, agriculture at 29.92% is not the same as agricultural loss at 4.73%. The first number describes the 2025 surface, while the second belongs to a comparison between 1985 and 2025. The change value cannot simply be added to the current share to reconstruct an earlier agriculture percentage.
Second, developed land at 8.13% is not the same as mean impervious cover at 1.70%. A developed cell can still contain substantial grass, tree cover, and soil. The 0.55% area at 50% or greater impervious cover shows how concentrated the hardest surfaces actually are.
Third, wetlands at 29.19% are not equivalent to open water at 0.53%. Blue water bodies occupy very little of the county, while wet soils and wetland vegetation are widespread. Keeping these categories separate makes the county’s water-related landscape much easier to explain.
County planning, agriculture, and forestry sources add context without replacing the maps
The Georgia Department of Community Affairs maintains the joint comprehensive plan for Bacon County and the City of Alma. That resource is appropriate when a question involves planning, land use, community needs, or municipal context. It should not be substituted for the land-cover map when the goal is to describe what physically covers the ground in 2025.
UGA Extension provides the strongest county-specific agricultural background, while the Georgia Forestry Commission provides county-level forestry services and contacts. These sources show that agriculture and forest management are active local concerns, which is consistent with the map’s large agriculture and forest shares. They still do not convert raster colors into ownership, zoning, crop species, or management boundaries.
Use the four maps in a sequence that matches the question
For a general profile, start with the 2025 overview because it places agriculture, wetlands, forest, development, grassland, shrubland, and water in one frame. If the topic is farming or wooded land, move to the forest-and-farmland view. For development intensity, use the impervious map rather than the broader developed class alone.
The two-date comparison works best after the current landscape is understood. Its colors mean that the 1985 and 2025 classifications differ, not that the color represents the current surface. Comparisons with another Georgia county should also use the same observation year and classification system whenever possible.
Raster classification is useful at county scale but not as a parcel survey
Annual NLCD is raster data, so the land is divided into grid cells and each cell receives a representative class. A real cell can contain crops, trees, grass, pavement, buildings, water, and bare soil at the same time. The map simplifies that mixture so countywide patterns are easier to compare. Field edges, wetland boundaries, narrow roads, and small forest openings should therefore be treated as generalized.
Land cover is also different from legal land use. An agricultural cell is not a zoning designation, a forest cell does not establish public ownership, and a developed cell does not prove that a parcel can be built on. Property, planning, and regulatory questions require current official records.
The original JPG files in this package are 2480×1754 pixels each. Enlarging them can make small colored areas easier to see, but it cannot create new source detail. The asset manifest does not mark the files as meeting the package’s A3 high-resolution reference. They remain useful for screen viewing, presentations, ordinary handouts, and county-scale comparison, while very large printing should be checked at the intended output size.
Frequently Asked Questions
Which 2025 land-cover class is largest in Bacon County?
Agriculture is the largest at 29.92%, but wetlands are very close at 29.19%. Forest is third at 20.72%. Because the two leading classes differ by less than one percentage point, Bacon County is better described as a mixed agricultural and wet landscape than as a county dominated by only one class.
Why is developed land 8.13% while mean impervious cover is only 1.70%?
Developed land can include lawns, trees, soil, and other permeable surfaces together with roads and buildings. Impervious cover isolates hard surfaces such as rooftops and pavement. Only 0.55% of the county is mapped at 50% or greater impervious surface, so the hardest surfaces are concentrated in a small area.
Does the 35.51% class difference mean more than one third of the county physically changed?
No. It is the share of cells classified differently in the 1985 and 2025 comparison. Supplied components include 2.49% to developed, 13.65% forest loss, 4.73% agricultural loss, and 12.91% other difference. Classification variation may be included, so specific causes require additional evidence.
Sources and Reference Data
- MRLC Annual NLCD Data – annual land-cover data used for the 2025 and two-date comparison views.
- USGS Annual NLCD Land Cover Classification – definitions for agricultural, wetland, forest, developed, and other mapped classes.
- U.S. Census Bureau TIGER/Line Shapefiles – official county-boundary reference for Bacon County.
- UGA Extension Bacon County – Agriculture & Natural Resources – official local information on blueberries and other agricultural production.
- Georgia DCA – Bacon County & Alma Comprehensive Plan – official planning resources for Bacon County and the City of Alma.
- Georgia Forestry Commission County Contacts – county-level forestry contacts and service information.
Map File Information
This ZIP contains the four original JPG maps used to compare 2025 land cover and related themes across Bacon County.
- Included Files: Use only the versions confirmed in the article and supplied images
- File Type: Use the confirmed download contents
- Intended Use: Printing, education, presentations, and map-based projects
Related Maps
Green Map creates custom-edited map images using open geographic data sources such as geoBoundaries, Natural Earth, OpenStreetMap, and government open data.
These maps are edited visual materials, not raw data files, and are provided for education, documents, presentations, and graphic reference.