Washington County sits on Colorado’s eastern plains, and its 2025 land-cover pattern is defined less by one dominant class than by an unusually close balance between agriculture and grassland. Agriculture accounts for 49.01% of the county and grassland for 47.77%, leaving only a small share for developed land, wetlands, water, shrubland, and other mapped classes. The four maps on this page separate those patterns into current land cover, forest and farmland, impervious surface, and 1985–2025 change. The original JPG versions of all four maps are also available together in one ZIP download.
At county scale, the map looks like a broad patchwork of rectangular farm fields embedded in open grassland. Developed areas are tiny by comparison and appear as compact spots rather than a continuous urban belt. Water is scarce, although a larger blue feature near the northwest edge provides a useful landmark. Reading the four views together makes it easier to see why a county that is almost entirely agricultural and grass-covered can still contain very different local patterns.
Table of Contents
A landscape divided almost evenly between farming and grassland
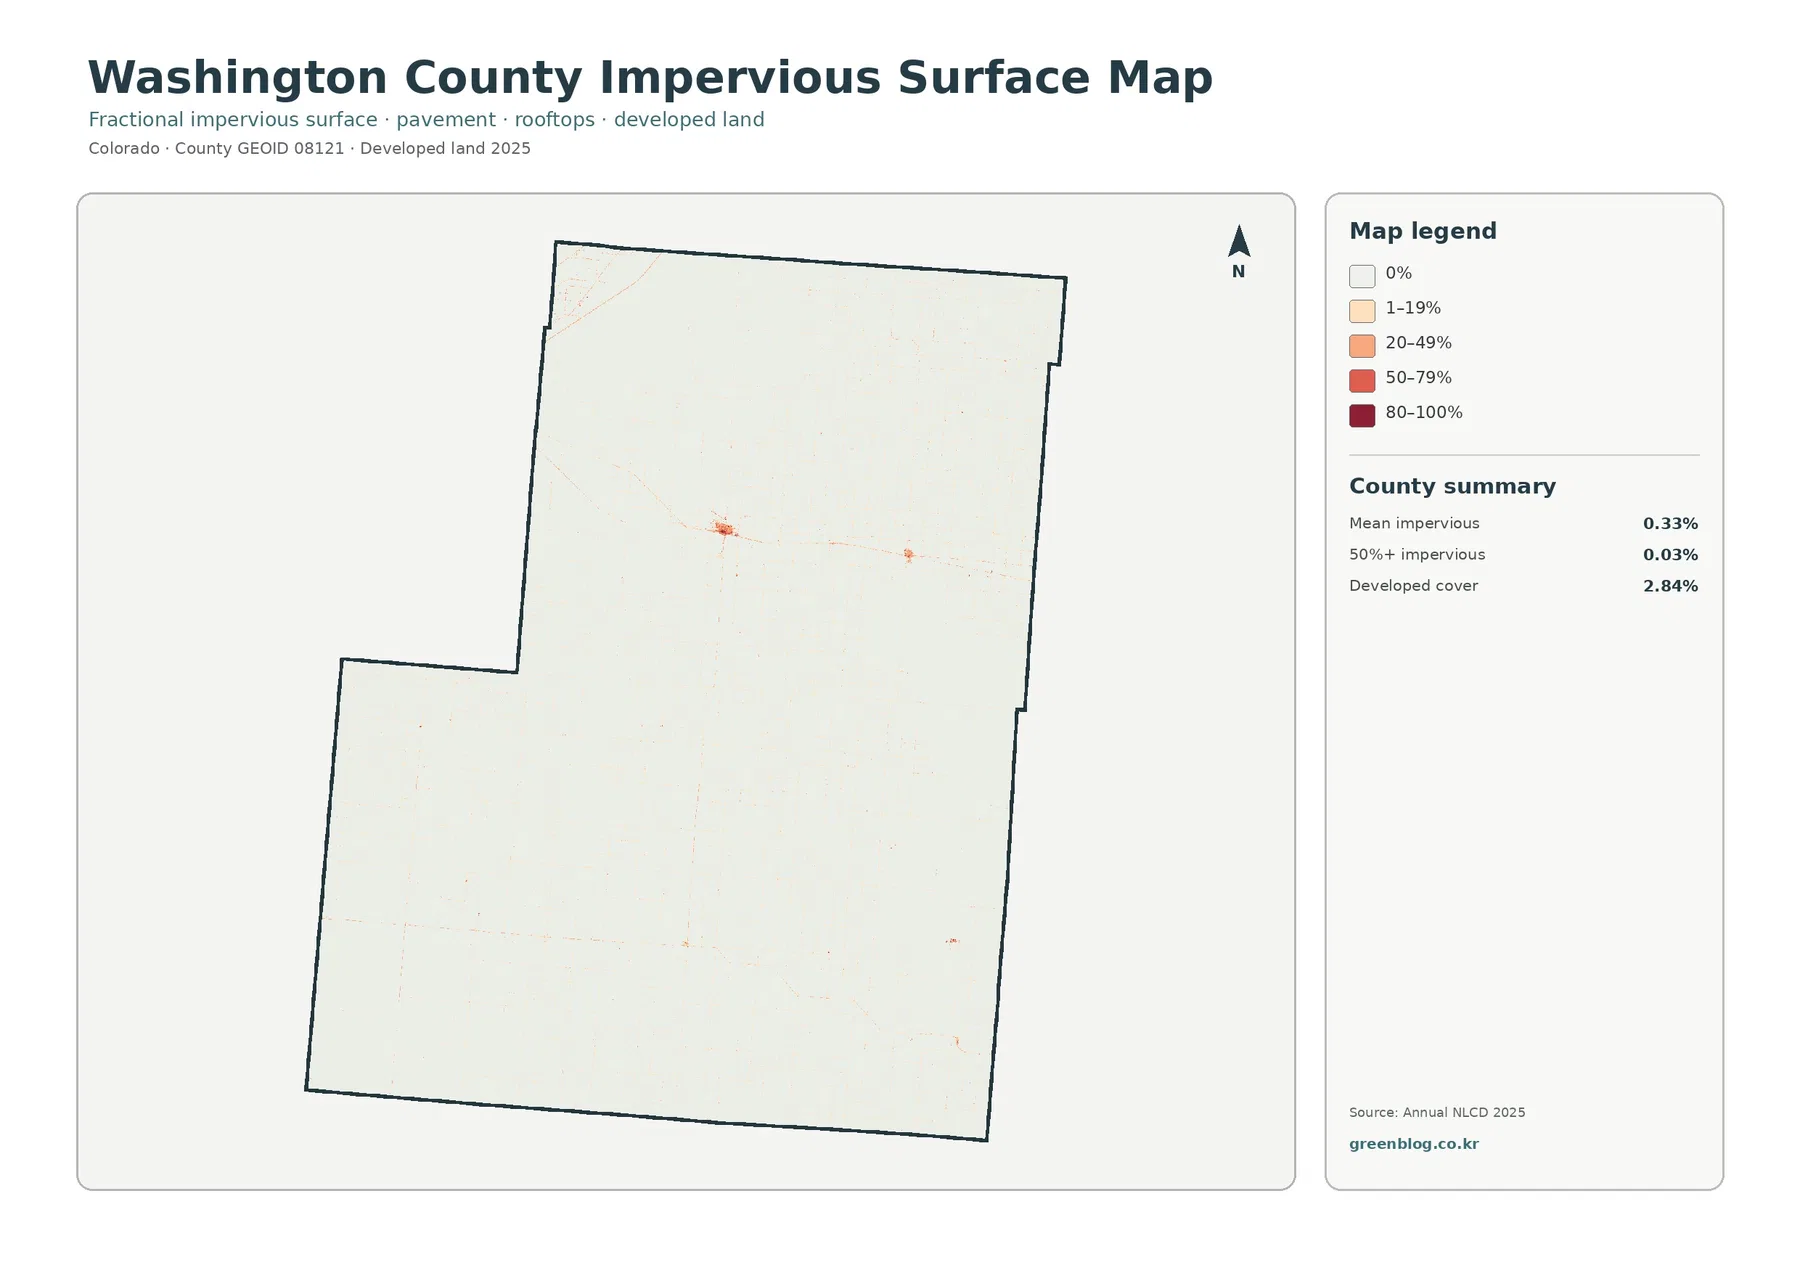
The 2025 summary puts agriculture first at 49.01%, but grassland follows at 47.77%. The difference is only 1.24 percentage points. That matters because a single statewide label such as “eastern plains” can hide how strongly these two covers alternate within the county. Yellow agricultural cells form blocks of many sizes, while the grassland class fills broad spaces between them. Neither class forms one uninterrupted mass from border to border.
The southern half contains many large farm blocks, yet sizable grassland areas remain among them. Farther north, the pattern becomes more finely mixed in several places, with cultivated rectangles breaking up wider grass-covered tracts. The northeast also contains extensive agriculture without losing the surrounding open-land character. This is a useful example of why percentages and maps should be read together: two counties could have the same 49% agricultural share and still arrange that land very differently.
Developed cover is 2.84%, and the map shows why that number remains small. Rather than spreading across the county, developed pixels cluster around a handful of settlements and along narrow linear features. Census reference mapping identifies Akron, Otis, Woodlin, and Cope within Washington County. Those place locations give useful context for the small developed concentrations visible against the much larger agricultural and grassland background.
Land cover should not be confused with zoning, parcel ownership, or legal land use. Annual NLCD classifies the surface in raster cells, meaning a grid of small areas that are assigned a representative cover class. A cell can contain more than one real-world surface. For example, a field edge may also include a road, trees, or a building. The county map is therefore best for broad comparisons and location patterns, not for deciding the status of an individual property.
A very small impervious footprint around widely spaced settlements
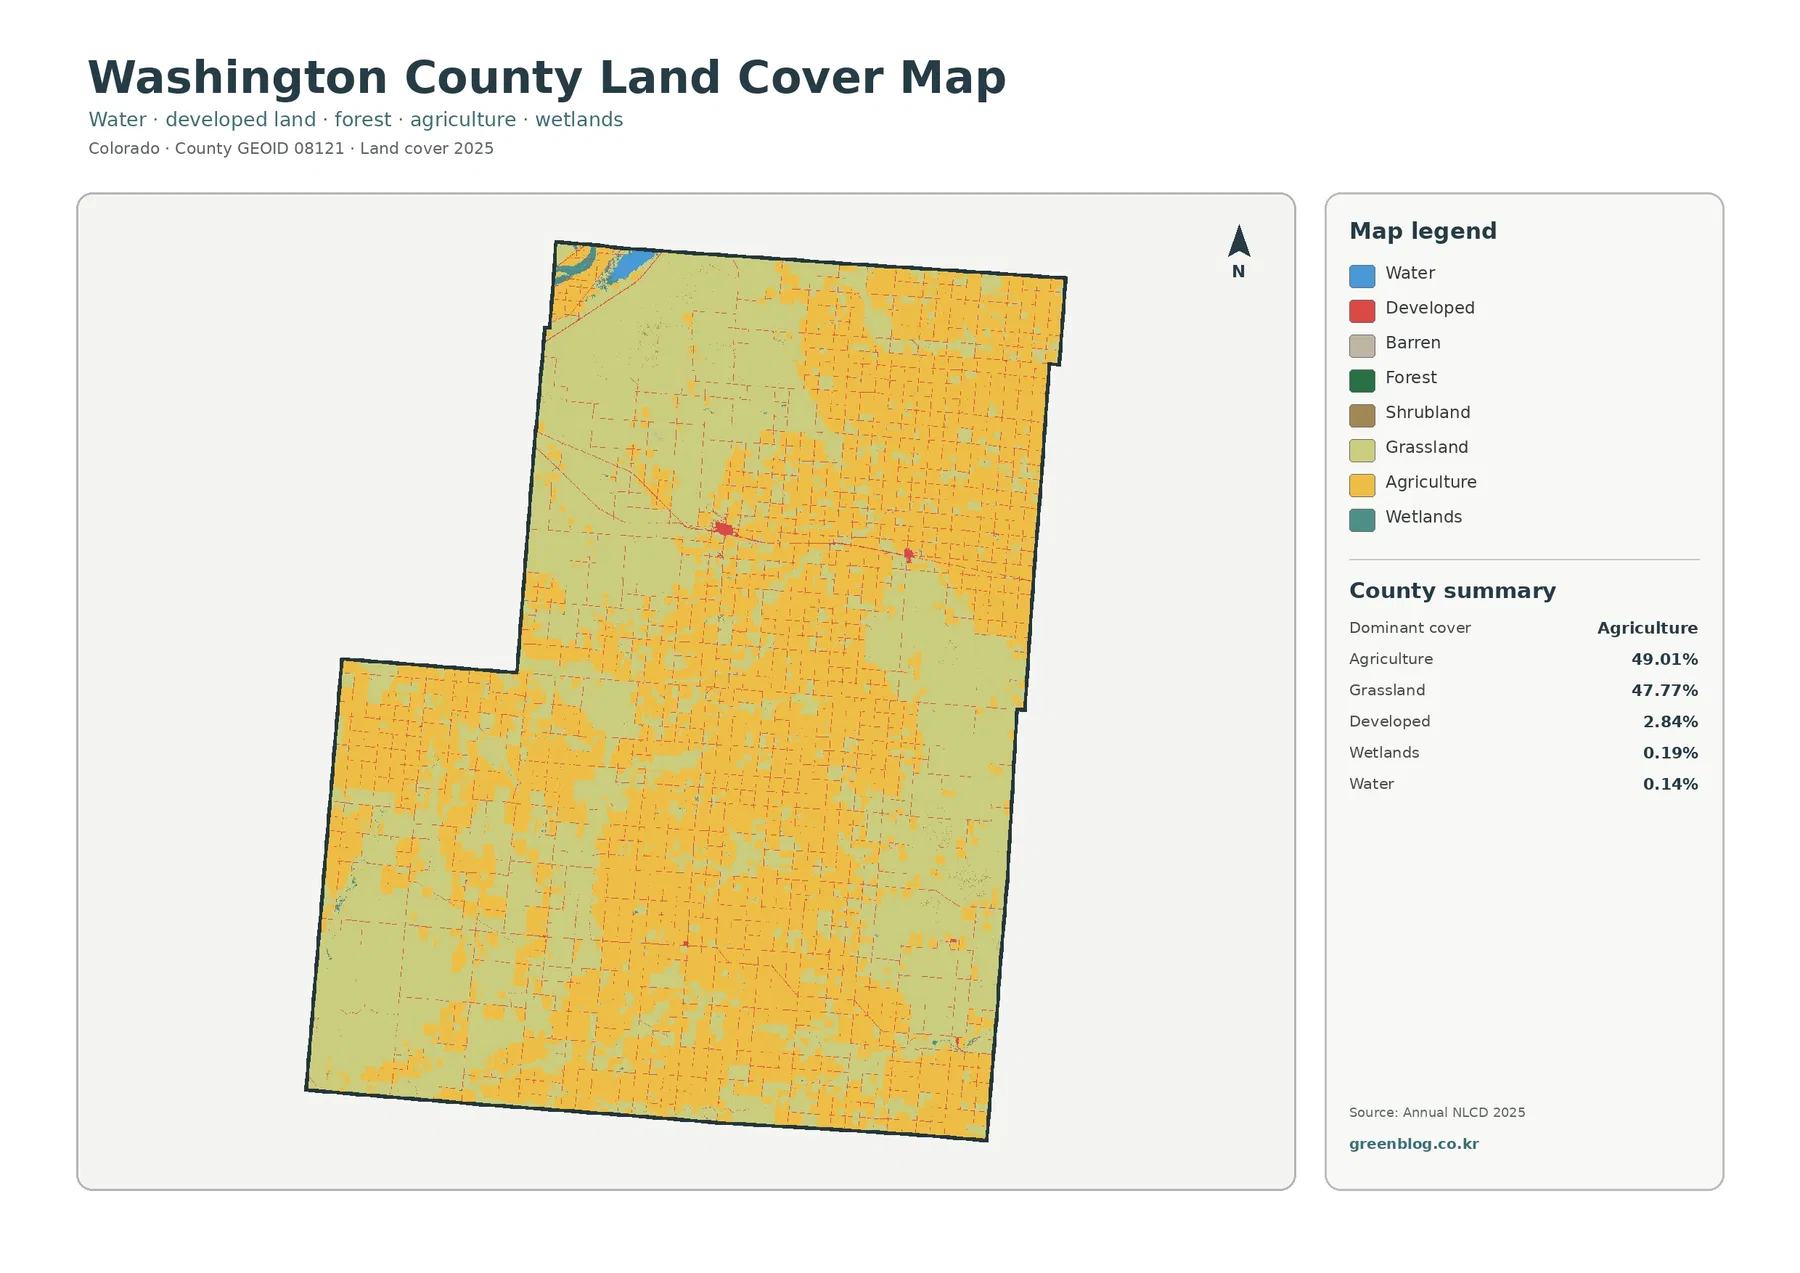
The impervious-surface map removes much of the color found in the general land-cover view and focuses on surfaces such as rooftops, pavement, and parking areas where water does not readily soak into the ground. Washington County has a mean impervious value of just 0.33%. Areas with at least 50% impervious surface account for only 0.03% of the county. Most of the map is therefore near zero, which fits the broad agricultural and grassland setting seen in the other views.
The clearest concentration appears around Akron in the northern part of the county. A smaller cluster lies to the east around Otis, and additional tiny concentrations appear farther south near the locations represented by Woodlin and Cope on Census reference mapping. These places are visually small when set against the county boundary, but they stand out strongly on the impervious map because the surrounding countryside contains so little pavement or rooftop cover.
Developed land at 2.84% and mean impervious surface at 0.33% are not competing estimates of the same thing. A developed land-cover class can include lawns, scattered vegetation, low-density residential space, or other surfaces that still absorb water. Impervious percentage measures the hard-surface fraction within a cell more directly. A settlement can therefore occupy a wider developed area while only a smaller part of that area reaches the higher impervious categories.
Some faint linear traces resemble roads, but the map should not be used to identify every road by name. The Town of Akron notes that the community is located at the intersection of State Highways 34 and 63, which provides a verified transportation reference for the main northern settlement. For route planning or detailed road analysis, however, a dedicated transportation map is more appropriate than an impervious-surface raster.
Why the forest and farmland view is especially revealing here
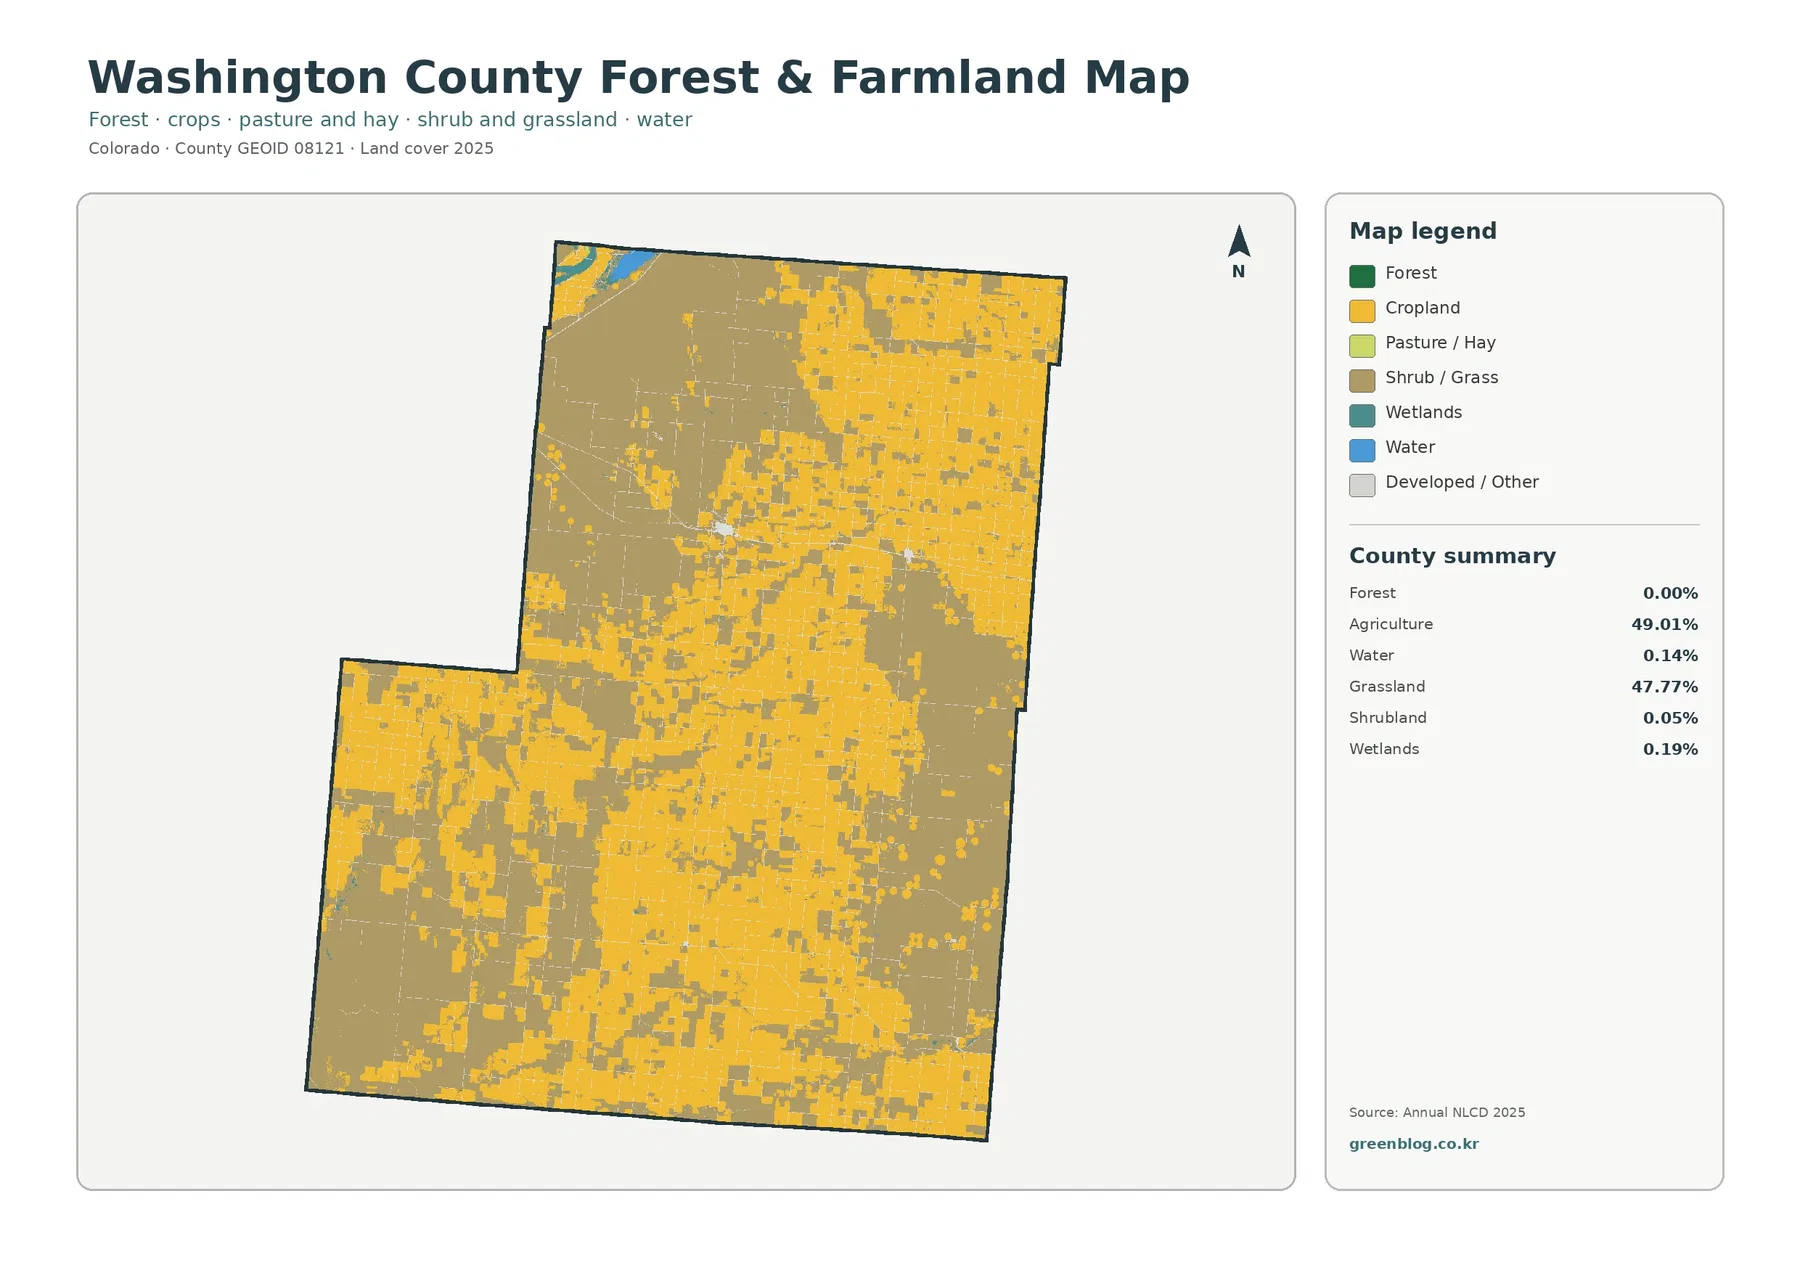
In a mountain county, a forest-and-farmland map may be useful for separating wooded slopes from valleys and cultivated ground. Washington County tells a different story. The forest summary is 0.00%, while agriculture and grassland together account for 96.78% of the county. As a result, this simplified map becomes a strong comparison between cultivated fields and open grass-covered land rather than a study of forest edges.
A 0.00% forest value does not mean that no trees exist anywhere in Washington County. It means the mapped forest class rounds to 0.00% in the supplied county summary. Small groves, windbreaks, trees around homes, or narrow woody strips can fall below the scale of a 30-meter classification or become mixed with neighboring cover within the same raster cell. The value should therefore be read as a county-scale land-cover statistic, not as a literal tree inventory.
The agricultural blocks often have straight edges that reflect the field pattern visible in the map, while grassland forms broader and less regular areas around them. In the southwest and south-central portions, clusters of cultivated blocks are especially easy to distinguish. Other parts of the county show more intermixing, where smaller fields sit within wider grassland. This makes the map useful for classroom demonstrations of how agriculture can be extensive without occupying every open acre.
Shrubland is only 0.05%, wetlands 0.19%, and water 0.14%. Those classes are numerically minor, but the larger blue water body near the northwest edge stands out because so little of the county is mapped as water. The Census Bureau’s county reference map labels Prewitt Reservoir in that general northwest area. Smaller wet or open-water cells elsewhere are much harder to see and may be generalized by the raster resolution.
Small water and wetland classes still provide useful landmarks
Water and wetlands together occupy less than one-half of one percent of Washington County in the supplied 2025 summary. Water is 0.14% and wetlands are 0.19%. Their low percentages are easy to overlook when reading a table, yet the northwest water feature is visually distinct on both the general and forest/farmland maps. The Census reference map places Prewitt Reservoir in that same general portion of the county, making it a useful orientation feature.
Elsewhere, wetland and water pixels are small and discontinuous. Narrow channels, ponds, or wet ground can be difficult to represent cleanly in a 30-meter grid, especially when a single cell contains both water-related cover and surrounding grass or agriculture. The mapped shapes should therefore be treated as generalized land-cover indicators rather than surveyed shorelines or regulatory wetland boundaries.
For environmental education, these minor classes can still be valuable. A reader can compare where water occurs relative to large agricultural blocks or use the wetland color as a prompt for a more detailed watershed investigation. The map does not provide water quality, flow, irrigation rights, or legal wetland status, so those questions require separate hydrologic or agency data.
What the 1985–2025 change map says—and what it does not say
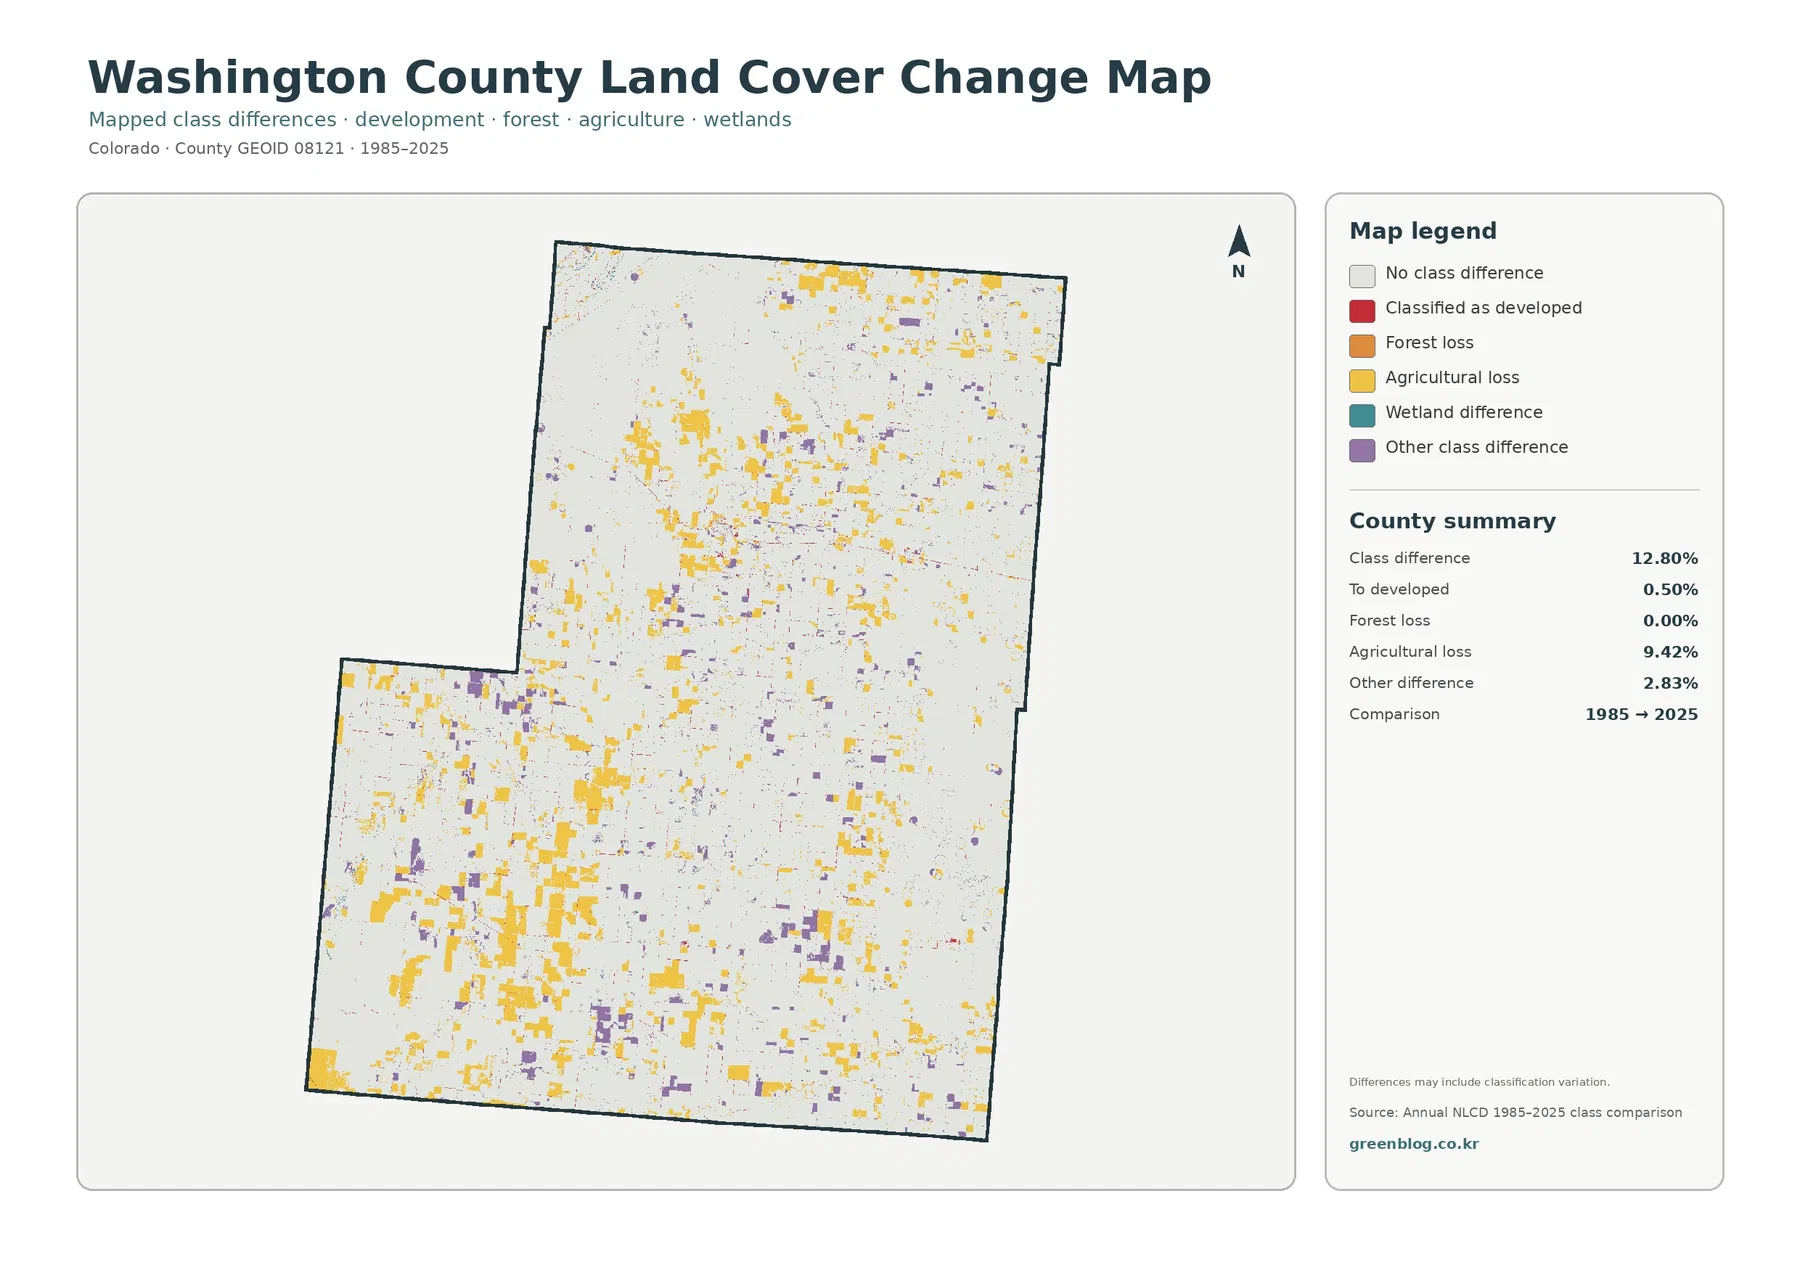
The supplied comparison marks 12.80% of Washington County as a different land-cover class in 2025 than in 1985. Agricultural loss is the largest labeled change category at 9.42%. Other class differences account for 2.83%, while cells classified as changing to developed cover make up 0.50%. Forest loss is 0.00%, which is consistent with the very small forest presence in the current county summary.
Agricultural-loss colors are scattered across the county rather than confined to one corner. Several larger patches occur in the southern half, but smaller areas also appear in the north and center. The pattern is important because it shows that the mapped differences are distributed through the same farm-and-grassland mosaic visible in the current map. Developed-change pixels are much less extensive and remain closely associated with the small settlement areas.
The 9.42% figure should not be treated as a direct measure of permanent farmland abandonment. This map compares classified cover in two years. It does not record the cause of each change. Cropland and grassland can look different among observation years, and classification methods, mixed pixels, vegetation conditions, or other factors can contribute to a changed class. The map itself warns that mapped differences may include classification variation.
For that reason, the strongest use of the change map is to identify areas worth checking with additional evidence. A large agricultural-loss patch can be compared with intermediate Annual NLCD years or historical aerial imagery. A developed-change spot can be checked against the current impervious map. That workflow keeps a useful distinction between a mapped difference and an explanation for why the difference occurred.
Choosing the right map for a project
Start with the general 2025 land-cover map when the goal is a quick county overview. It places agriculture, grassland, developed cover, water, and wetlands in a single frame and makes the near-even agriculture/grassland balance easy to explain. It also works well for comparing Washington County with forested or mountainous parts of Colorado because the contrast is immediately visible.
The forest-and-farmland view is better when the main question concerns fields versus open grassland. Its simplified legend removes much of the visual competition from minor classes. The impervious map answers a different question by highlighting the tiny developed footprint around settlements. It is particularly useful for explaining why 2.84% developed cover can coexist with a countywide mean impervious value of only 0.33%.
Use the change map only after establishing the current pattern. It is a two-date comparison, not a second version of the current land-cover map. In a presentation, a clear sequence is current cover first, farm/grass detail second, impervious surface third, and 1985–2025 change last. That order keeps current conditions, settlement intensity, and historical classification differences from being blended into one conclusion.
Scale, mixed pixels, and other limitations
Annual NLCD is designed for consistent regional comparison, not parcel-level surveying. A 30-meter raster cell can include several surface types at once, and one class has to represent that cell in the land-cover product. Small farm lanes, shelterbelts, isolated buildings, ponds, or narrow wet areas may therefore be exaggerated, reduced, or absorbed into a neighboring class. This is especially important in Washington County because many features outside the main farm and grassland classes are very small.
The date also matters. The current maps summarize 2025 classification, so later construction, crop rotation, vegetation shifts, or other changes are not represented. The 1985–2025 map skips over the sequence between those endpoints. Someone investigating a specific period should examine intermediate years rather than assuming the change happened once or remained in place throughout the entire 40-year interval.
These maps are appropriate for county comparison, environmental education, agricultural landscape context, presentations, and preliminary research. They are not substitutes for parcel boundaries, zoning maps, ownership records, permit information, or regulatory wetland determinations. Washington County and the relevant state or federal agency should be consulted when a question depends on current legal or property information.
Map file information and key figures
The most useful numbers to keep together are agriculture 49.01%, grassland 47.77%, developed cover 2.84%, wetlands 0.19%, water 0.14%, shrubland 0.05%, and forest 0.00%. Mean impervious surface is 0.33%, with 0.03% of the county at 50% or greater imperviousness. In the 1985–2025 comparison, total class difference is 12.80%, agricultural loss is 9.42%, other difference is 2.83%, and change to developed cover is 0.50%. Current-cover percentages and change percentages describe different measurements and should not be combined into one total.
Each original JPG in the supplied asset manifest is 2480 × 1754 pixels. The package does not certify those files as meeting an A3 high-resolution reference, so check labels, legend text, and fine class boundaries at the intended print size before making a large-format print. For normal documents and screen use, the JPG originals provide a convenient offline version of the same four mapped views.
Frequently Asked Questions
What is the dominant land cover in Washington County?
Agriculture is the largest 2025 class at 49.01%, but grassland is very close at 47.77%. Together they account for 96.78% of the county, so the most accurate short description is a mixed agricultural and grassland plains landscape rather than a county dominated by only one of those covers.
Does 0.00% forest mean there are no trees in the county?
No. The value means that the forest class rounds to 0.00% in the supplied 2025 county summary. Small tree groups, shelterbelts, and trees around buildings can be too small or too mixed with neighboring surfaces to appear as a county-scale forest class in a 30-meter raster product.
Is the 9.42% agricultural-loss value a measure of permanently lost farmland?
Not by itself. It is the share labeled as agricultural loss in the 1985–2025 class comparison. The map does not identify the cause or confirm that every changed cell represents permanent conversion. Intermediate land-cover years, aerial imagery, and agricultural records are needed for a more specific conclusion.
Map File Information
Use the ZIP below to keep the four original Washington County JPG maps together for offline reference.
- Included Files: Use only the versions confirmed in the article and supplied images
- File Type: Use the confirmed download contents
- Intended Use: Printing, education, presentations, and map-based projects
Related Maps
- Adams County Colorado Land Cover Map
- Alamosa County Colorado Land Cover Map
- Arapahoe County Colorado Land Cover Map
Sources and References
- MRLC Annual NLCD Data – source access for land-cover and impervious-surface products
- USGS Annual NLCD Land Cover Classification – classification definitions and interpretation
- U.S. Census Bureau TIGER/Line Shapefiles – county boundary and geographic reference data
- Washington County Maps – official county map resources and local place references
- Town of Akron – official local context for Akron and its highway location
Green Map creates custom-edited map images using open geographic data sources such as geoBoundaries, Natural Earth, OpenStreetMap, and government open data.
These maps are edited visual materials, not raw data files, and are provided for education, documents, presentations, and graphic reference.