Montezuma County in southwestern Colorado contains a strong transition from dry shrub country to forested uplands. The 2025 summary is led by shrubland at 50.25% and forest at 38.21%, followed by agriculture at 7.33%, developed cover at 2.49%, and wetlands at 0.73%. On the map, the southwest is broadly shrub-covered, while larger forest blocks occupy the northeast and other higher terrain. Farmed land and developed cover are much more concentrated around the central and northwestern parts of the county.
Four views are provided here: current land cover, forest and farmland, impervious surface and developed land, and mapped class differences from 1985 to 2025. The original four JPG maps are available together in one download below. Because every map uses the same county boundary, a reader can compare forests, farms, water, built surfaces, and long-term classification differences without changing geographic extent.
Table of Contents
A southwest-to-northeast vegetation shift explains much of the map
The broadest county pattern is not simply a contrast between “green” and “brown.” Montezuma County’s official Community Wildfire Protection Plan describes a pronounced elevation and moisture gradient. Lower areas in the southwest are dry and support desert shrubs and grasses. Middle elevations include sagebrush, pinyon pine, and Utah juniper, while higher northeastern areas contain Gambel oak, ponderosa pine, aspen, spruce, and fir. That local description gives useful context for the 2025 land-cover map, where shrubland dominates the southwest and forest becomes more extensive toward the higher northeast.
The countywide totals reinforce that contrast. Shrubland accounts for 50.25% of the mapped area and forest for 38.21%, so those two classes together cover most of Montezuma County. Agriculture is far smaller at 7.33%, but it forms conspicuous patches in the northwest and near the county’s central settled area. Developed land is only 2.49% countywide, yet its red map color makes the Cortez area stand out against the surrounding farms and natural cover.
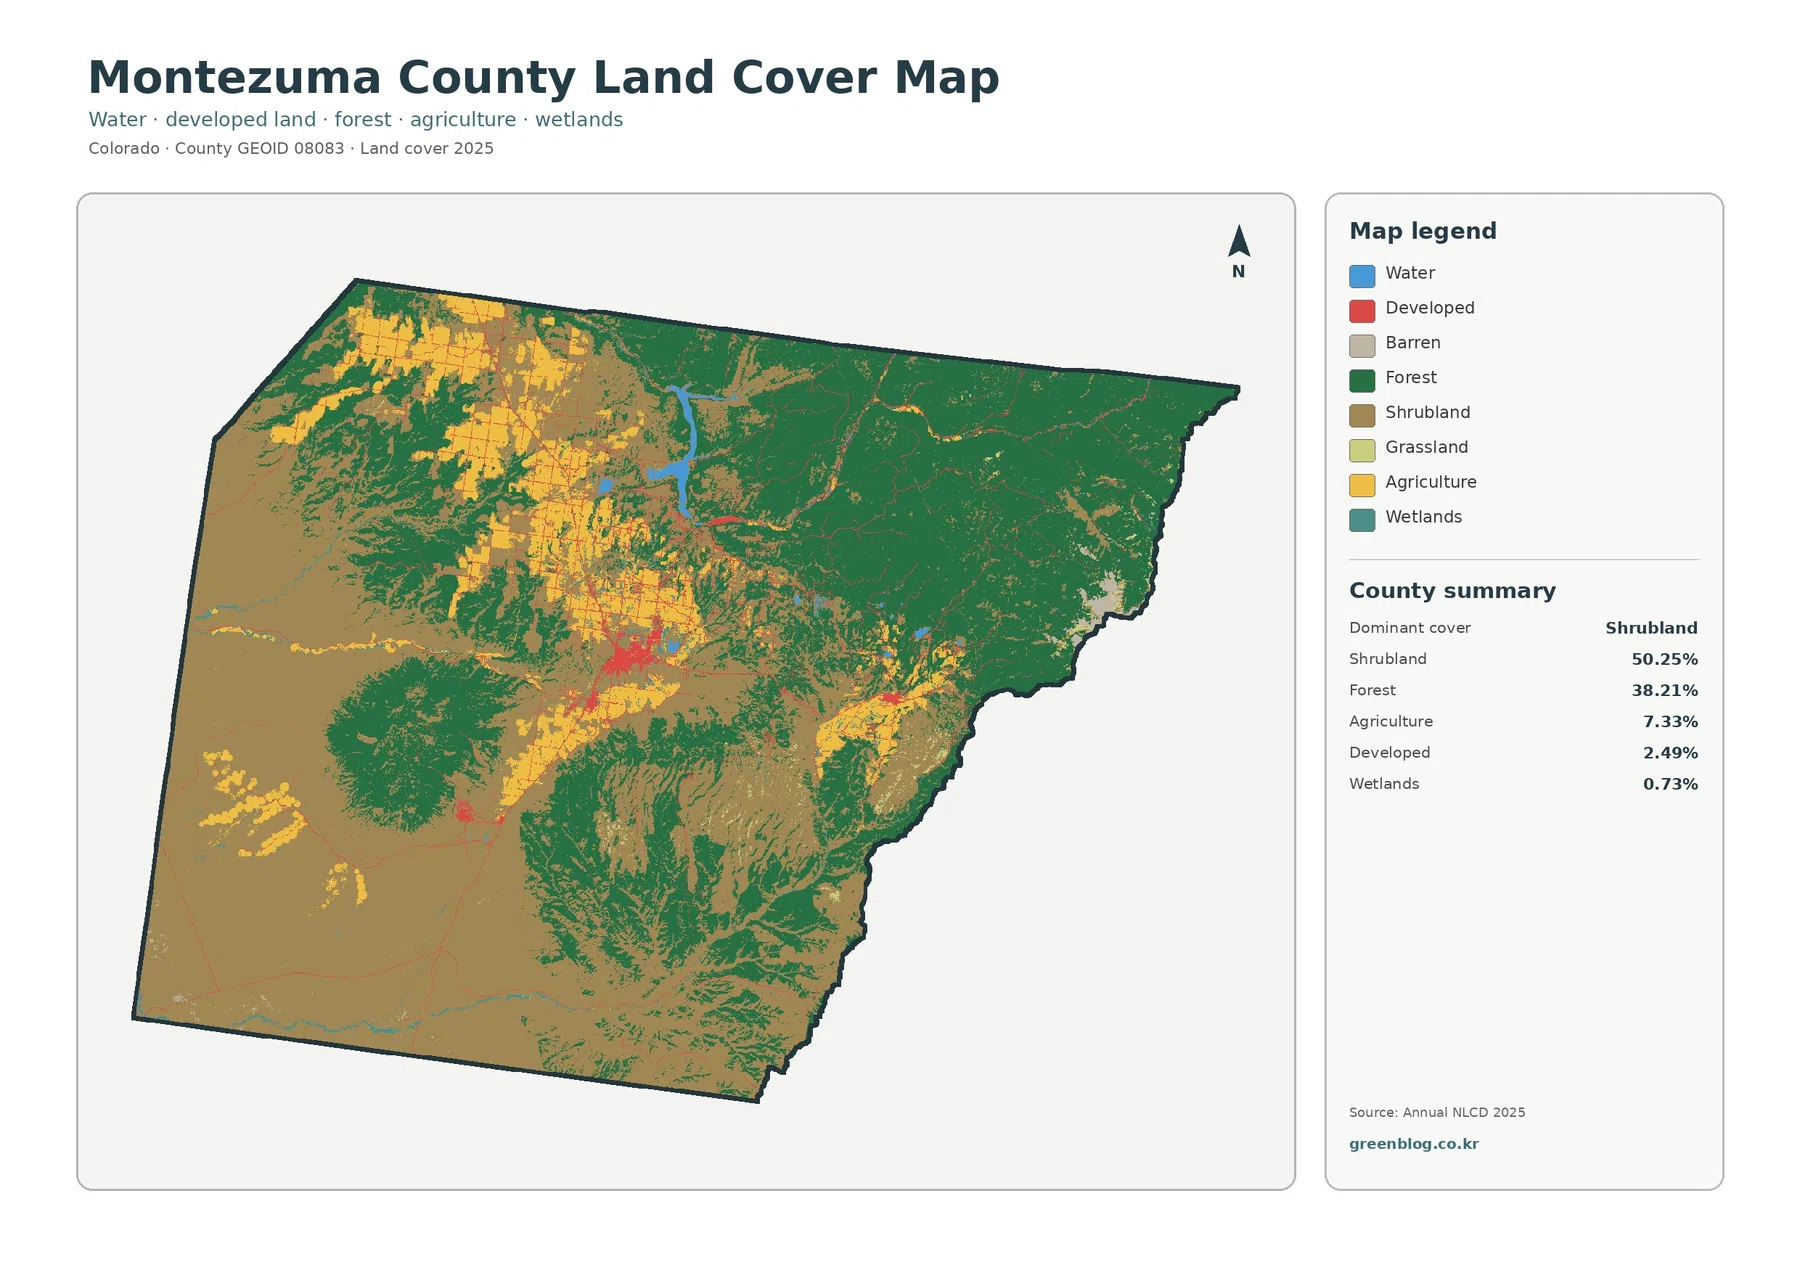
This map should be read as surface cover, not as zoning or ownership. A shrubland cell describes what covers the ground; it does not say whether the parcel is federal, tribal, state, or private. Likewise, an agricultural class is not a farm boundary, and a developed class does not grant or imply development rights. Montezuma County contains several forms of land ownership and management, but those legal and administrative boundaries are outside the purpose of this land-cover layer.
Cortez is easy to find when hard surfaces are isolated
The impervious-surface view removes much of the visual complexity of the general map. Impervious surface means pavement, rooftops, parking areas, and similar surfaces that do not readily absorb water. The countywide mean is just 0.48%, and only 0.11% of the county is mapped at 50% impervious or higher. Those low averages are consistent with a county where natural cover still occupies most of the landscape.
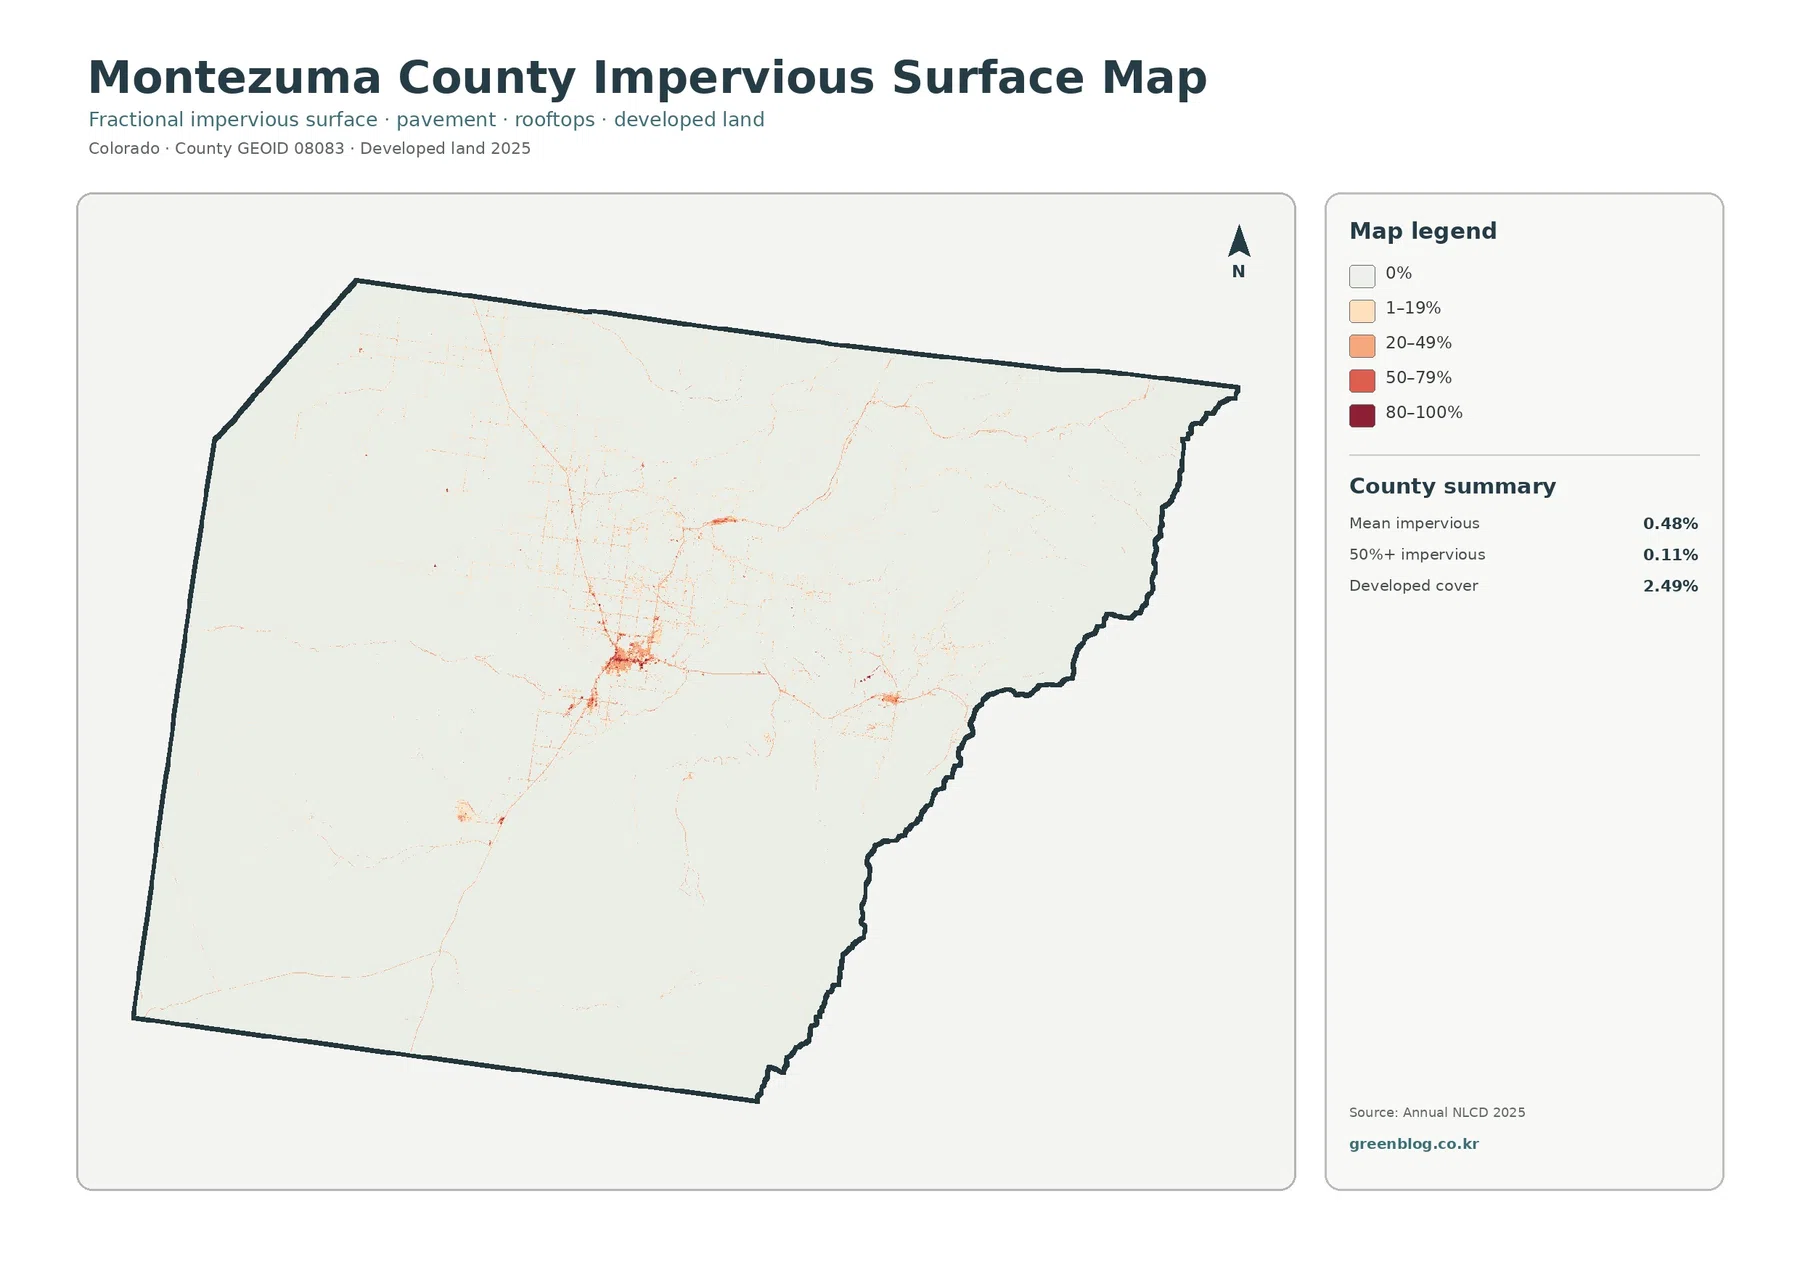
Cortez forms the clearest concentration of orange and red values. Smaller developed patches and road-like lines extend outward, but much of the county remains pale because hard surfaces occupy only a small share of each raster cell. The official county emergency plan identifies Cortez as the county seat and largest incorporated community, with Dolores to the north and Mancos to the east. The impervious map does not label those places, so it is best used to compare the intensity and extent of built surface rather than to identify individual streets or buildings.
Developed cover and impervious cover are related but they are not the same statistic. Developed land is 2.49%, much higher than the 0.48% mean impervious value. A low-density developed cell can contain lawns, trees, bare ground, and other vegetation along with buildings and pavement. That is why developed classification can occupy a larger area than the hard surface itself. The map is useful for county-scale comparison, but it is not a substitute for a planning map, parcel map, or engineering survey.
Farmland is concentrated between much larger shrub and forest areas
The forest-and-farmland map simplifies the county into categories that are easier to compare side by side. Forest remains prominent across the northeast and other uplands, while shrub and grass cover dominates much of the southwest. Agriculture, at 7.33%, appears in a more compact set of areas, especially in the northwest and around the middle of the county. The pattern is visually important because the farmed blocks interrupt otherwise broad expanses of shrubland and forest.
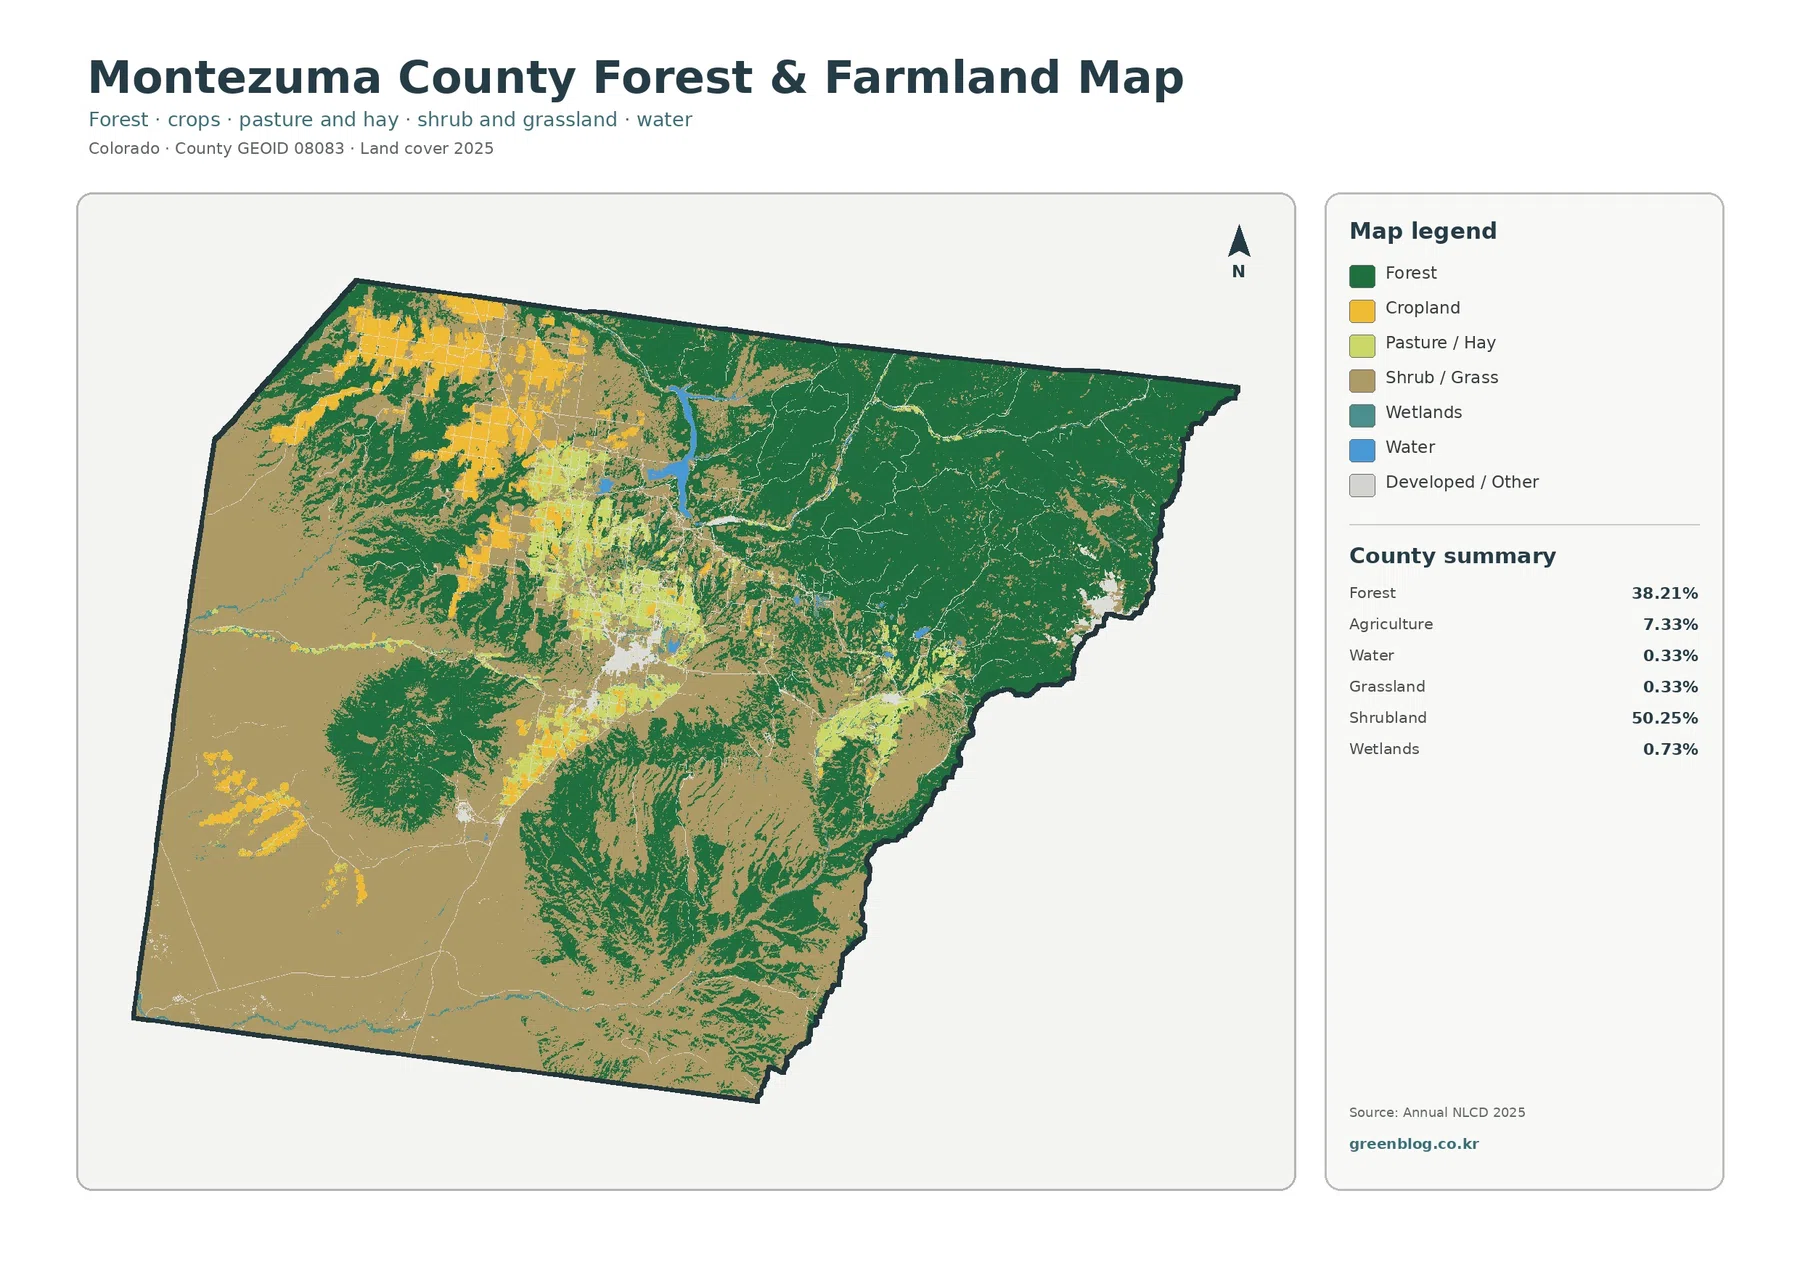
The county wildfire plan notes that middle-elevation terrain is the part of Montezuma County most suited to agricultural production and also contains much of the residential development. That source-backed local context helps explain why farms and settled surfaces are more concentrated in the middle part of the county instead of being distributed evenly from one border to another. It does not mean elevation alone caused a specific farm or neighborhood; the map shows an association, while land-use history, irrigation, soils, and ownership require separate evidence.
Agriculture on this map is a land-cover class, not a measurement of the county’s agricultural economy. Grazed shrubland or grassland may still be classified as natural shrub or grass cover rather than agriculture. Similarly, the forest class says nothing about tree species, timber value, stand health, or recent fire effects. A 30-meter cell is assigned a generalized category, so narrow roads, field margins, small ponds, and mixed vegetation can be absorbed into the dominant class.
McPhee Reservoir and wet areas provide small but important landmarks
Water occupies a small percentage of the county, but it is visually easy to locate. A prominent blue reservoir in the northern part of the map corresponds to the McPhee Reservoir area, which the county’s official emergency planning material identifies as a major reservoir. The water body sits beside forest and agricultural cover, giving readers a strong reference point for comparing nearby classes. Smaller streams and ponds are much less obvious because their width may be below the map’s 30-meter cell size.
Wetlands account for 0.73% of the 2025 summary. That is a small countywide share, yet wetlands can matter greatly along reservoirs, streams, and low-lying ground. Their mapped location is more informative than the total percentage when studying watershed context or habitat patterns. The layer should not be used to establish a legal wetland boundary; regulatory determinations require more detailed data and, in many cases, field review.
The general map and the forest-and-farmland map work especially well as a pair here. The first preserves more land-cover classes, while the second makes the relationship among forest, agriculture, shrub/grass, water, and wetlands easier to see. Comparing both views helps avoid an overly simple interpretation of Montezuma County as only forest or only dry shrub country.
The 1985–2025 layer maps classification differences, not a damage total
The change map compares the class assigned to each cell in 1985 with the class assigned in 2025. Montezuma County has a 12.93% overall class-difference value. The summary highlights 0.77% classified as a transition to developed land, 4.49% in a forest-loss category, 2.60% in an agricultural-loss category, and 5.00% as other class difference. Most of the county remains in the no-difference background, but colored patches are widespread enough to show that the long-term comparison is not confined to one small area.
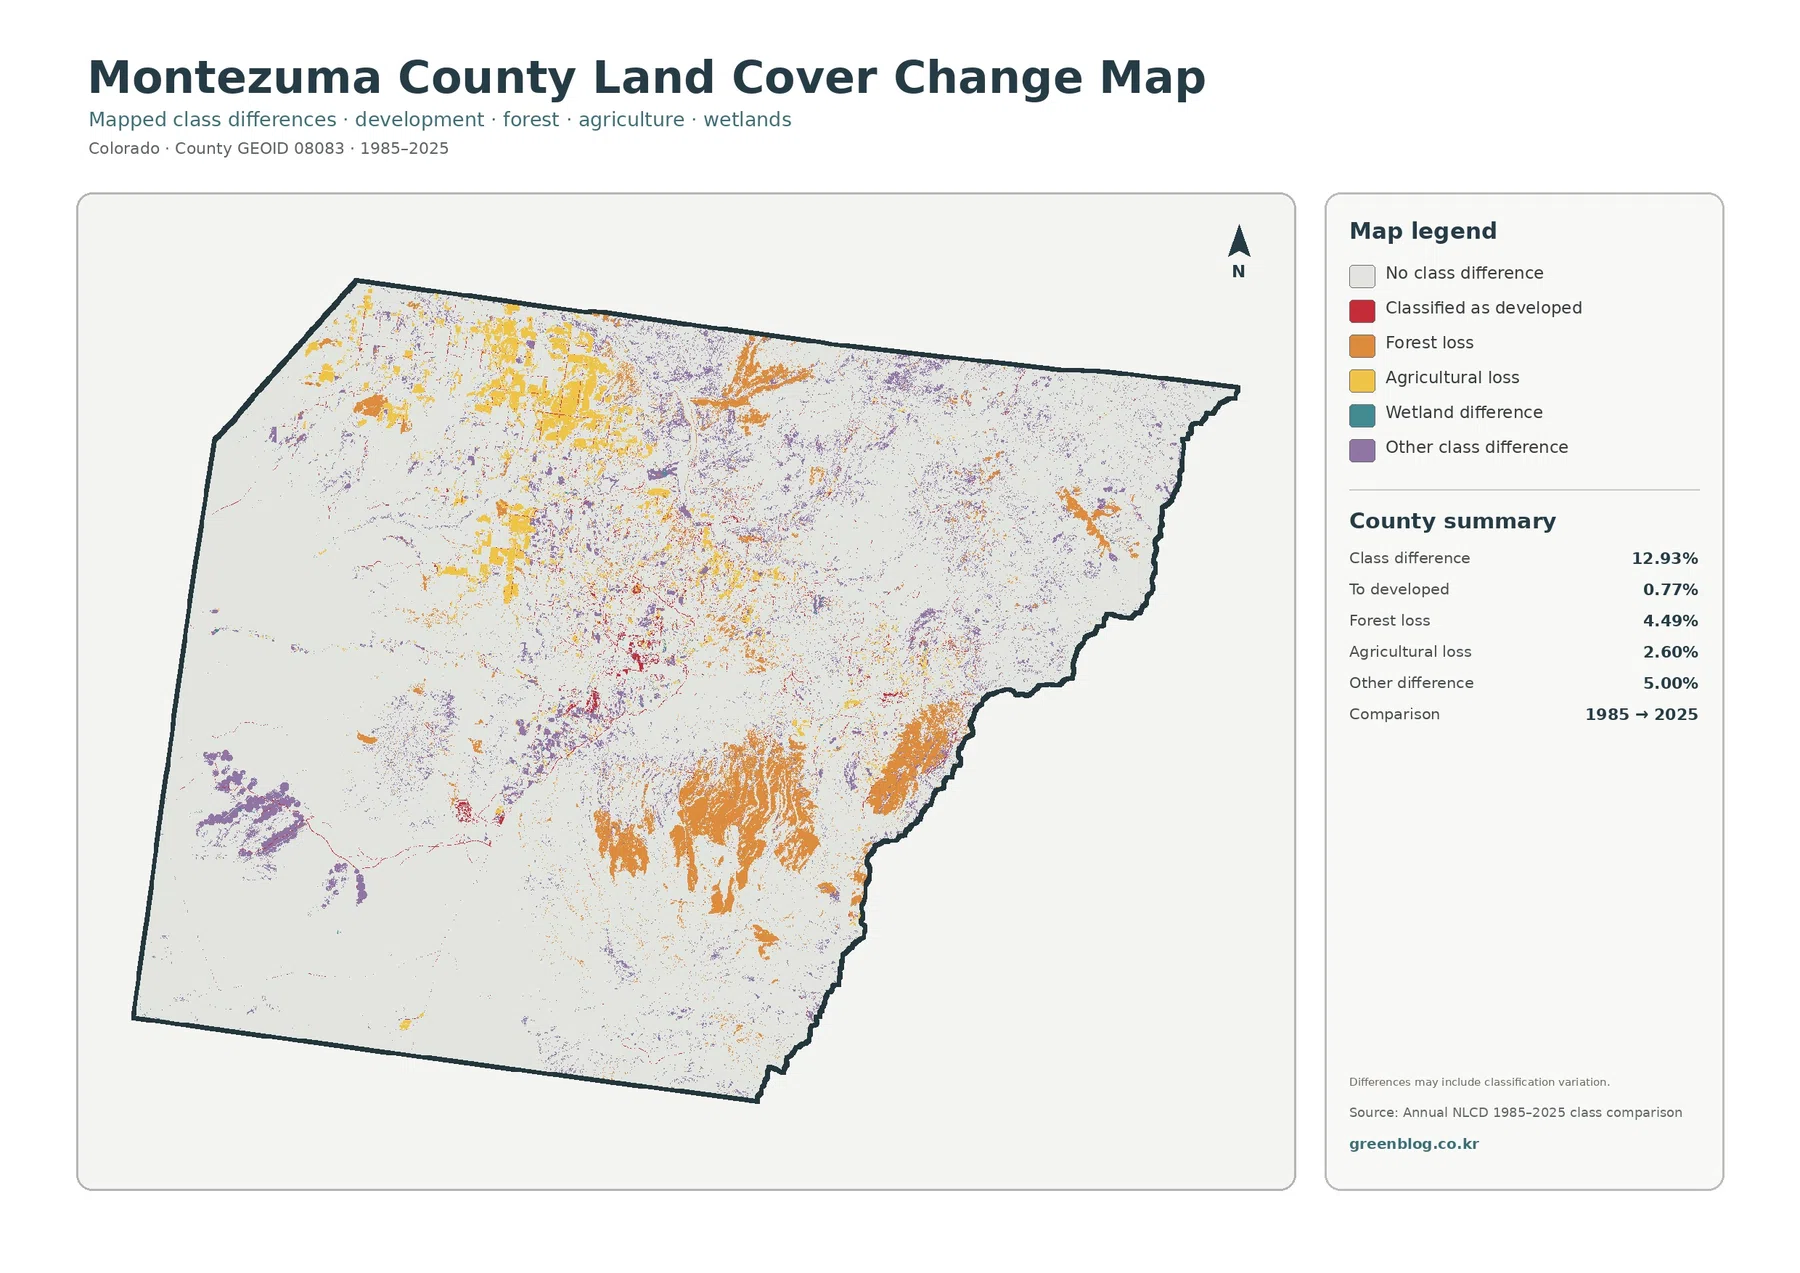
Agricultural-loss colors are noticeable across parts of the northwest, while forest-loss colors appear in several eastern and southern forested areas. Some developed-transition pixels occur around the more settled central area. These patterns do not identify the cause of a change. A cell that differs between two classification years could reflect real land conversion, vegetation disturbance and recovery, differences in seasonal appearance, mixed pixels, or changes in classification performance.
For that reason, 12.93% should not be described as “12.93% of the county was damaged.” A reliable explanation of a specific colored patch would require intermediate imagery and event records such as fire history, agricultural records, permits, or local land-management information. The map is best treated as a screening and comparison layer: it shows where the two endpoints differ and where further investigation may be worthwhile.
Use the four maps as a sequence rather than four isolated pictures
A practical reading order begins with current land cover. That view establishes the county’s dry southwest, forested northeast, farm concentrations, water, and developed areas. The forest-and-farmland map can then simplify those relationships, while the impervious map isolates built surface around Cortez and along transportation routes. The change map makes the most sense after the current pattern is understood, because its colored pixels are easier to interpret when the underlying 2025 cover is already familiar.
For education or regional presentations, Montezuma County provides a clear example of how elevation and moisture can correspond with very different surface cover inside one county. The official wildfire plan’s low-, middle-, and high-elevation vegetation zones provide a useful narrative, while the map supplies the visible distribution. The combination works well for explaining why shrubland, forest, agriculture, and development are not evenly spread across the county.
For watershed study, McPhee Reservoir and nearby wet cover provide useful landmarks. For agricultural comparison, the northwestern and central farm blocks can be contrasted with natural shrub and forest. For settlement context, the impervious map makes the Cortez concentration clear without letting large natural areas dominate the view. None of these uses requires treating the map as a parcel-level authority; they rely on the county-scale patterns that the dataset is designed to show.
Scale, classification date, and mixed pixels matter
Annual NLCD is raster data derived from satellite observations, commonly represented at a 30-meter cell size. Raster data divide the landscape into cells and assign each cell a representative class or value. In Montezuma County, one cell may contain trees, shrubs, a road edge, bare soil, or a small building at the same time. The final map simplifies that mixture, so the color boundary should not be mistaken for a surveyed edge on the ground.
The 2025 map represents the supplied classification year. Construction, wildfire, vegetation recovery, crop changes, or water-level changes after that observation period will not appear. The 1985–2025 comparison also does not tell the reader when a difference first occurred or whether a cell changed more than once between the endpoints. These limitations are especially important around narrow riparian corridors, small roads, field margins, and mixed woodland-shrub transitions.
Used at the right scale, the maps still communicate the county very effectively. Shrubland and forest together make up nearly nine-tenths of the mapped area, while agriculture and developed cover are much more concentrated. Mean impervious surface is low at 0.48%, but the Cortez area is visually distinct. The long-term layer then adds a separate question: not what the county looks like today, but where the 1985 and 2025 classifications do not match.
Download the four original JPG maps
The download archive contains four original JPG files for Montezuma County: the 2025 land-cover map, forest-and-farmland map, impervious-surface/developed-land map, and 1985–2025 land-cover-change map. They share the same county extent, which makes them convenient for side-by-side comparison in reports, classroom material, presentations, and general reference work.
The supplied asset manifest lists each JPG at 2480×1754 pixels and marks the package as not meeting its A3 high-resolution reference. If a large poster is planned, check print sharpness at the intended size before relying on the file. For screen use, ordinary documents, medium-size prints, and comparative slides, the original JPGs provide more flexibility than the WebP previews shown in the article.
Frequently Asked Questions
Why does Montezuma County show so much shrubland and forest?
The 2025 summary gives shrubland 50.25% and forest 38.21%. County planning material describes a dry, shrub- and grass-dominated southwest, middle elevations with sagebrush and pinyon-juniper, and higher northeastern terrain with more substantial forest. The map reflects that broad local gradient.
Which map is best for seeing development around Cortez?
Use the impervious-surface map first. The countywide mean is only 0.48%, but higher values cluster around Cortez and along some road corridors. The general land-cover map is useful beside it because developed cells can then be compared with nearby agriculture, shrubland, and forest.
Does the 12.93% class difference mean 12.93% of the county was lost or damaged?
No. It means the mapped class in 1985 differs from the mapped class in 2025 for 12.93% of the county. Real land change may be part of that value, but mixed pixels, seasonal conditions, vegetation state, and classification differences can also contribute. A specific cause requires additional historical records and imagery.
Map File Information
The ZIP contains four original JPG maps for Montezuma County, Colorado: current land cover, forest and farmland, impervious/developed land, and the 1985–2025 class-difference map.
- Included Files: Use only the versions confirmed in the article and supplied images
- File Type: Use the confirmed download contents
- Intended Use: Printing, education, presentations, and map-based projects
Related Maps
- Adams County Colorado Land Cover Map
- Alamosa County Colorado Land Cover Map
- Arapahoe County Colorado Land Cover Map
Sources and References
These sources support the land-cover classes, county boundary, and local context used to interpret Montezuma County’s vegetation, water, agriculture, and settlement pattern.
- MRLC Annual NLCD Data – annual land-cover and related datasets
- USGS Annual NLCD Land Cover Classification – classification definitions and background
- U.S. Census Bureau TIGER/Line Shapefiles – county boundary data
- Montezuma County Community Wildfire Protection Plan – local elevation zones, vegetation, and natural-environment context
- Montezuma County Emergency Operations Plan – county geography, municipalities, reservoirs, and regional background
- Montezuma County CSU Extension – local agriculture, horticulture, and natural-resource education
Green Map creates custom-edited map images using open geographic data sources such as geoBoundaries, Natural Earth, OpenStreetMap, and government open data.
These maps are edited visual materials, not raw data files, and are provided for education, documents, presentations, and graphic reference.