Baca County sits in Colorado’s far southeastern corner, and its 2025 land-cover picture is dominated by open ground rather than forest or urban development. Grassland accounts for 56.03% of the county, agriculture for 29.92%, and shrubland for 11.24%. Developed cover is only 2.27%, so small settlements and roads occupy a very different visual scale from the broad farm and grassland blocks around them.
Four views are included here: current land cover, forest and farmland, impervious surface and developed land, and a 1985–2025 land-cover comparison. The four original JPG maps are available in one download near the end of the page. Together they are useful for comparing rural cover, locating the limited built surface, and separating current conditions from long-term classification differences.
Table of Contents
A rural county where open cover sets the scale
Baca County’s official website describes the county as part of the southeastern corner of Colorado and emphasizes farms and ranches in its local identity. That background fits the supplied maps closely. Across most of the county, grassland forms the continuous base while agricultural cells appear as large rectangular blocks, especially through the north, east, and central portions. Shrubland becomes more noticeable toward the western and southern sides, where the neat agricultural blocks are less continuous.
The small shares are just as informative as the dominant ones. Forest is 0.21%, wetlands are 0.31%, and water is 0.01% in the supplied 2025 summary. Baca County therefore does not read like a forested mountain county or a lake-centered landscape. The useful comparison is between grassland, cultivated ground, shrub-covered areas, and the very small amount of developed surface distributed among communities and roads.
Built surfaces stand out because they are so limited
The impervious-surface map strips away most land-cover detail and focuses on pavement, rooftops, and other surfaces that water cannot easily soak through. Baca County’s mean impervious value is 0.29%, while only 0.02% of the county is mapped at 50% impervious or higher. Most of the county is therefore shown in the zero or very-low range, with warmer colors appearing only in a few compact clusters and thin connecting lines.
That pattern is useful when reading the county’s settlements. The county website lists Campo, Pritchett, Springfield, Two Buttes, Vilas, and Walsh among its towns and communities. The supplied impervious map does not label those places, so the colored clusters should not be assigned to a specific town without another reference map. What the map can support is the broader observation that built surface is concentrated in small nodes and road-like corridors rather than spreading across a continuous urban area.
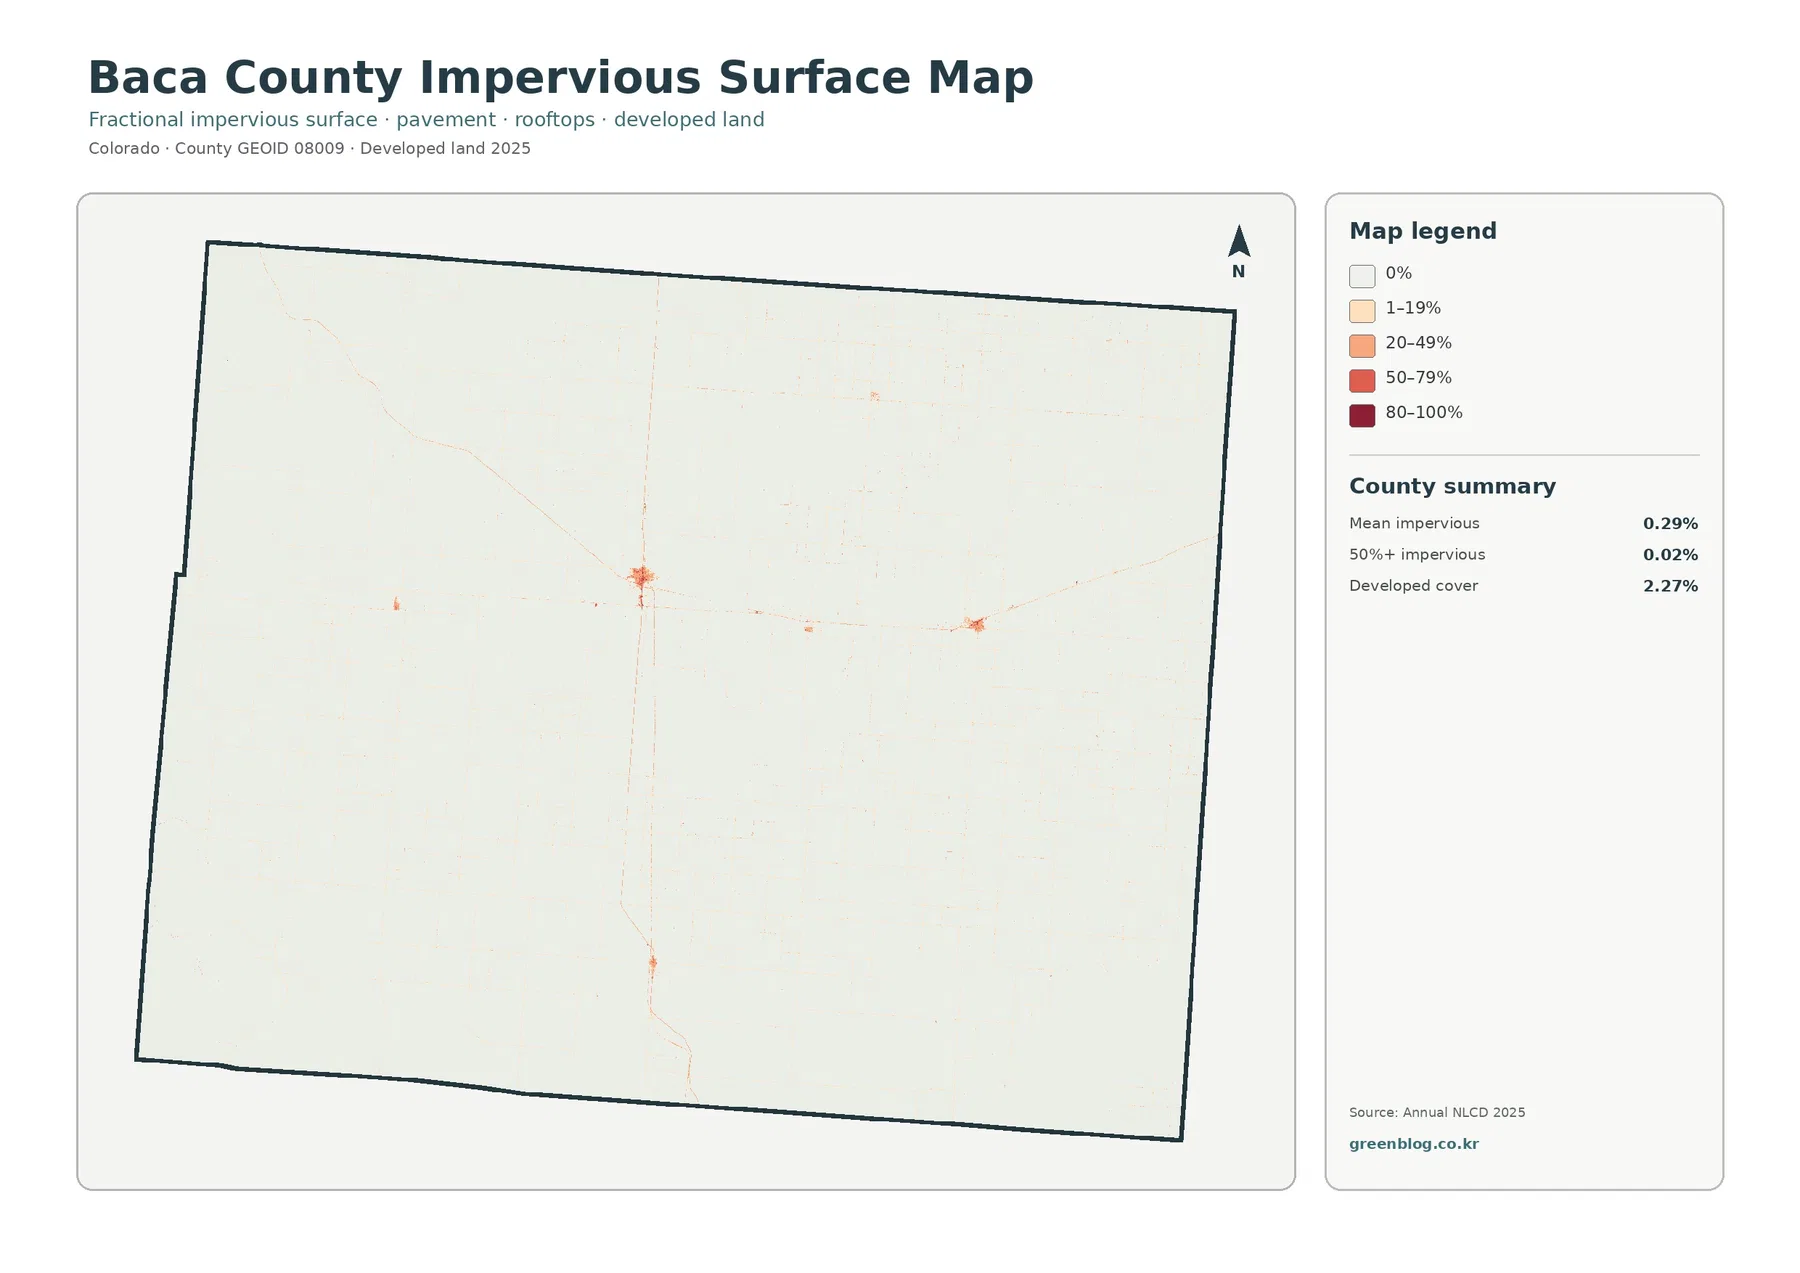
Developed cover and impervious percentage should not be treated as the same measure. The general land-cover map reports 2.27% developed land, which can include low-intensity developed cells where vegetation and built materials are mixed. The impervious layer estimates the fraction of hard surface within cells. A lightly developed cell can therefore belong to a developed class without being mostly pavement or roof, which helps explain why the countywide impervious average is much lower than the developed-cover percentage.
Grassland and cropland form a broad patchwork
The forest-and-farmland view makes the agricultural pattern easier to see by reducing the number of categories. Cropland appears in large, bright blocks across the northeastern half and continues through many central and southeastern areas. Shrub and grass classes fill the spaces between those blocks and become more continuous toward the west. Rather than one uninterrupted agricultural belt, the county shows a patchwork in which cultivated parcels and open rangeland repeatedly meet along straight field edges.
The summary values put that patchwork in perspective: agriculture is 29.92%, grassland is 56.03%, and shrubland is 11.24%. Forest, at 0.21%, is too limited to define the countywide landscape, and it appears only in small scattered areas on the map. The map is therefore better suited to comparing farmed ground with grass and shrub cover than to studying forest distribution. Water and wetlands are also minor, at 0.01% and 0.31% respectively.
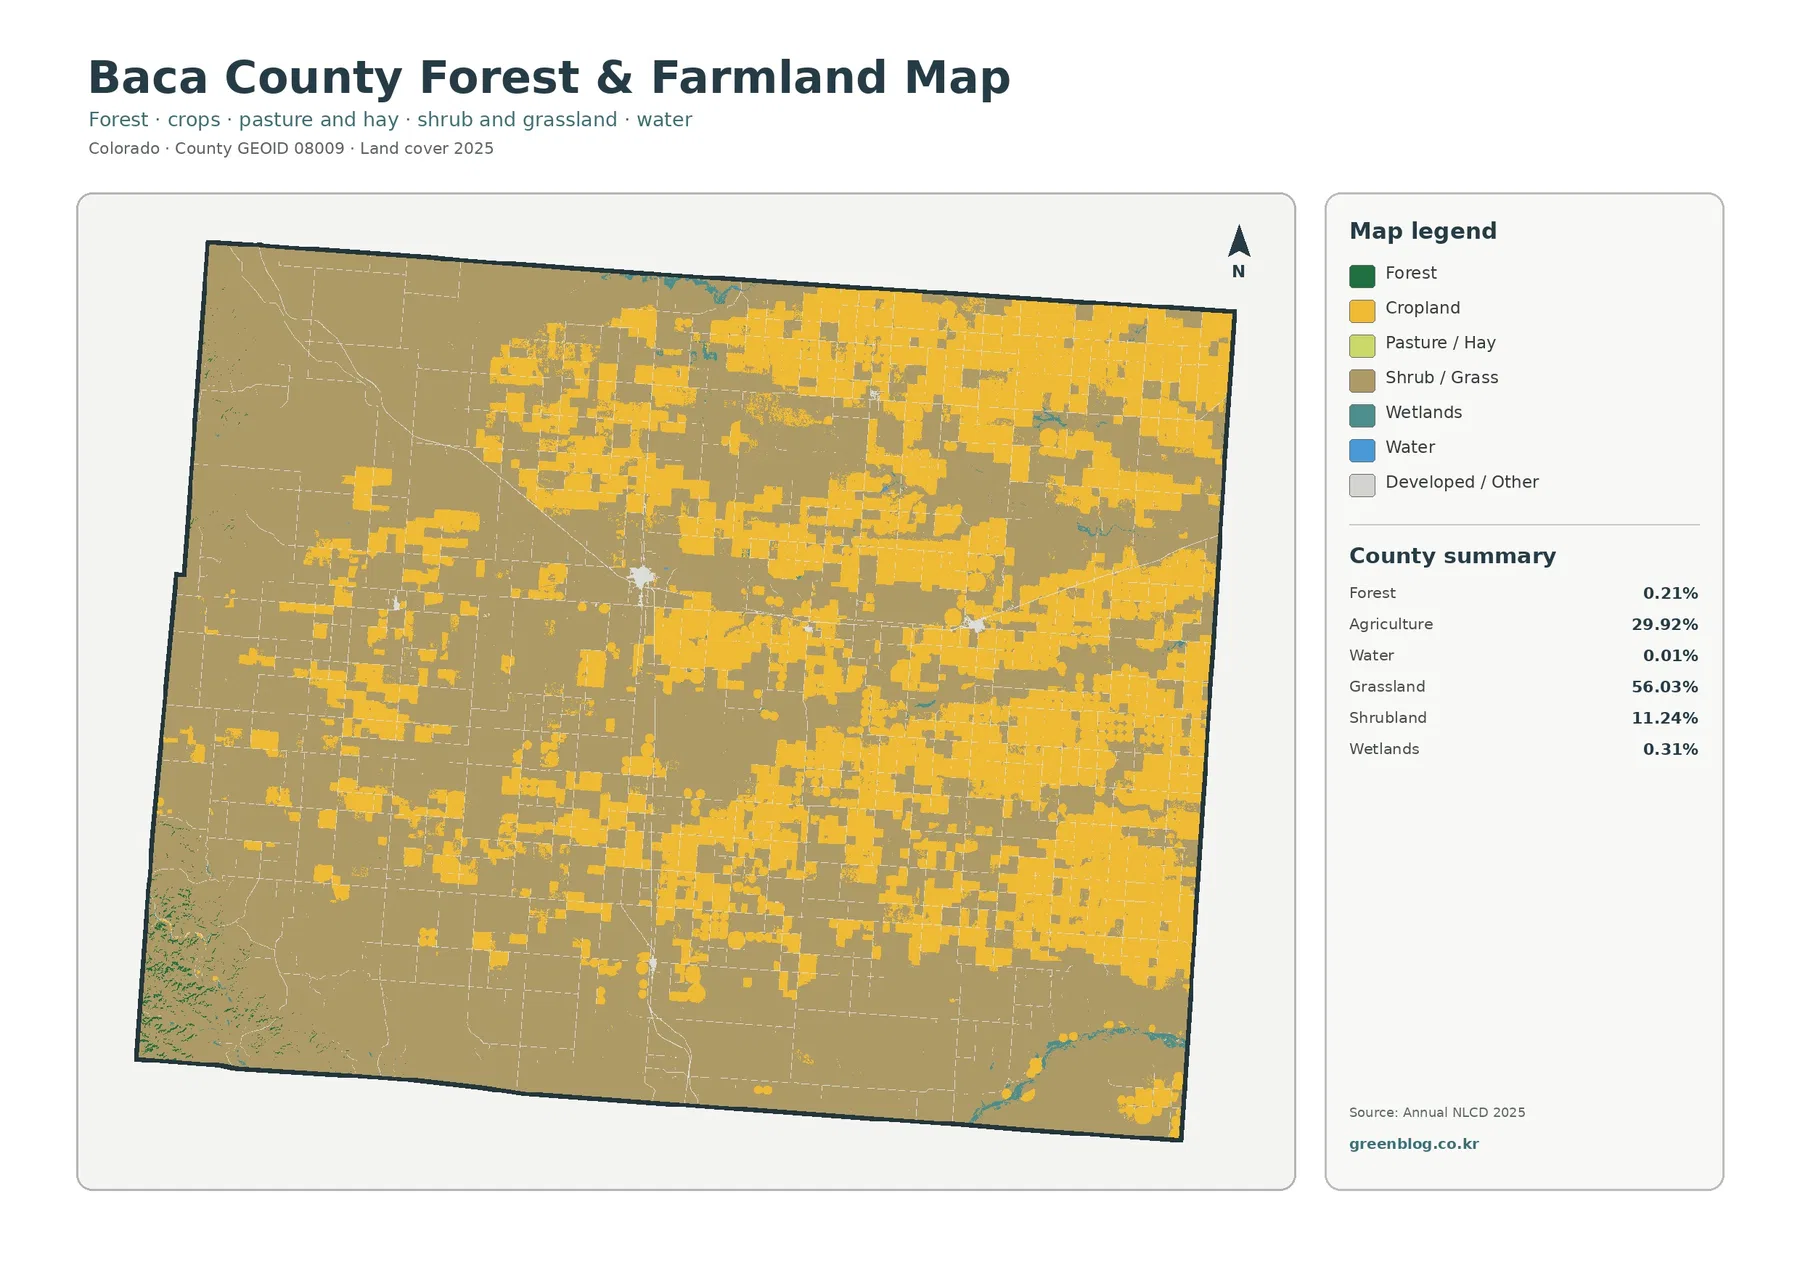
This layer describes surface cover, not farm ownership, crop type, grazing status, or zoning. A cell mapped as agriculture indicates that the satellite-based classification placed it in an agricultural class for the mapped year. It does not reveal which crop was planted, whether a field was irrigated, or where a legal parcel begins. Those questions require agricultural records, parcel data, or field information that is outside the scope of this map set.
The current map connects the simplified layers
The general 2025 land-cover map is the best place to reconnect the simplified themes. Grassland covers much of the background, agricultural blocks break across it, and shrubland is more apparent along portions of the west and south. Small red developed areas are visible as isolated points, while wetland and water colors occupy only tiny pieces of the county. The combination explains why the more specialized maps look so different: one emphasizes the farm-and-grassland mosaic, while another removes almost everything except built surface.
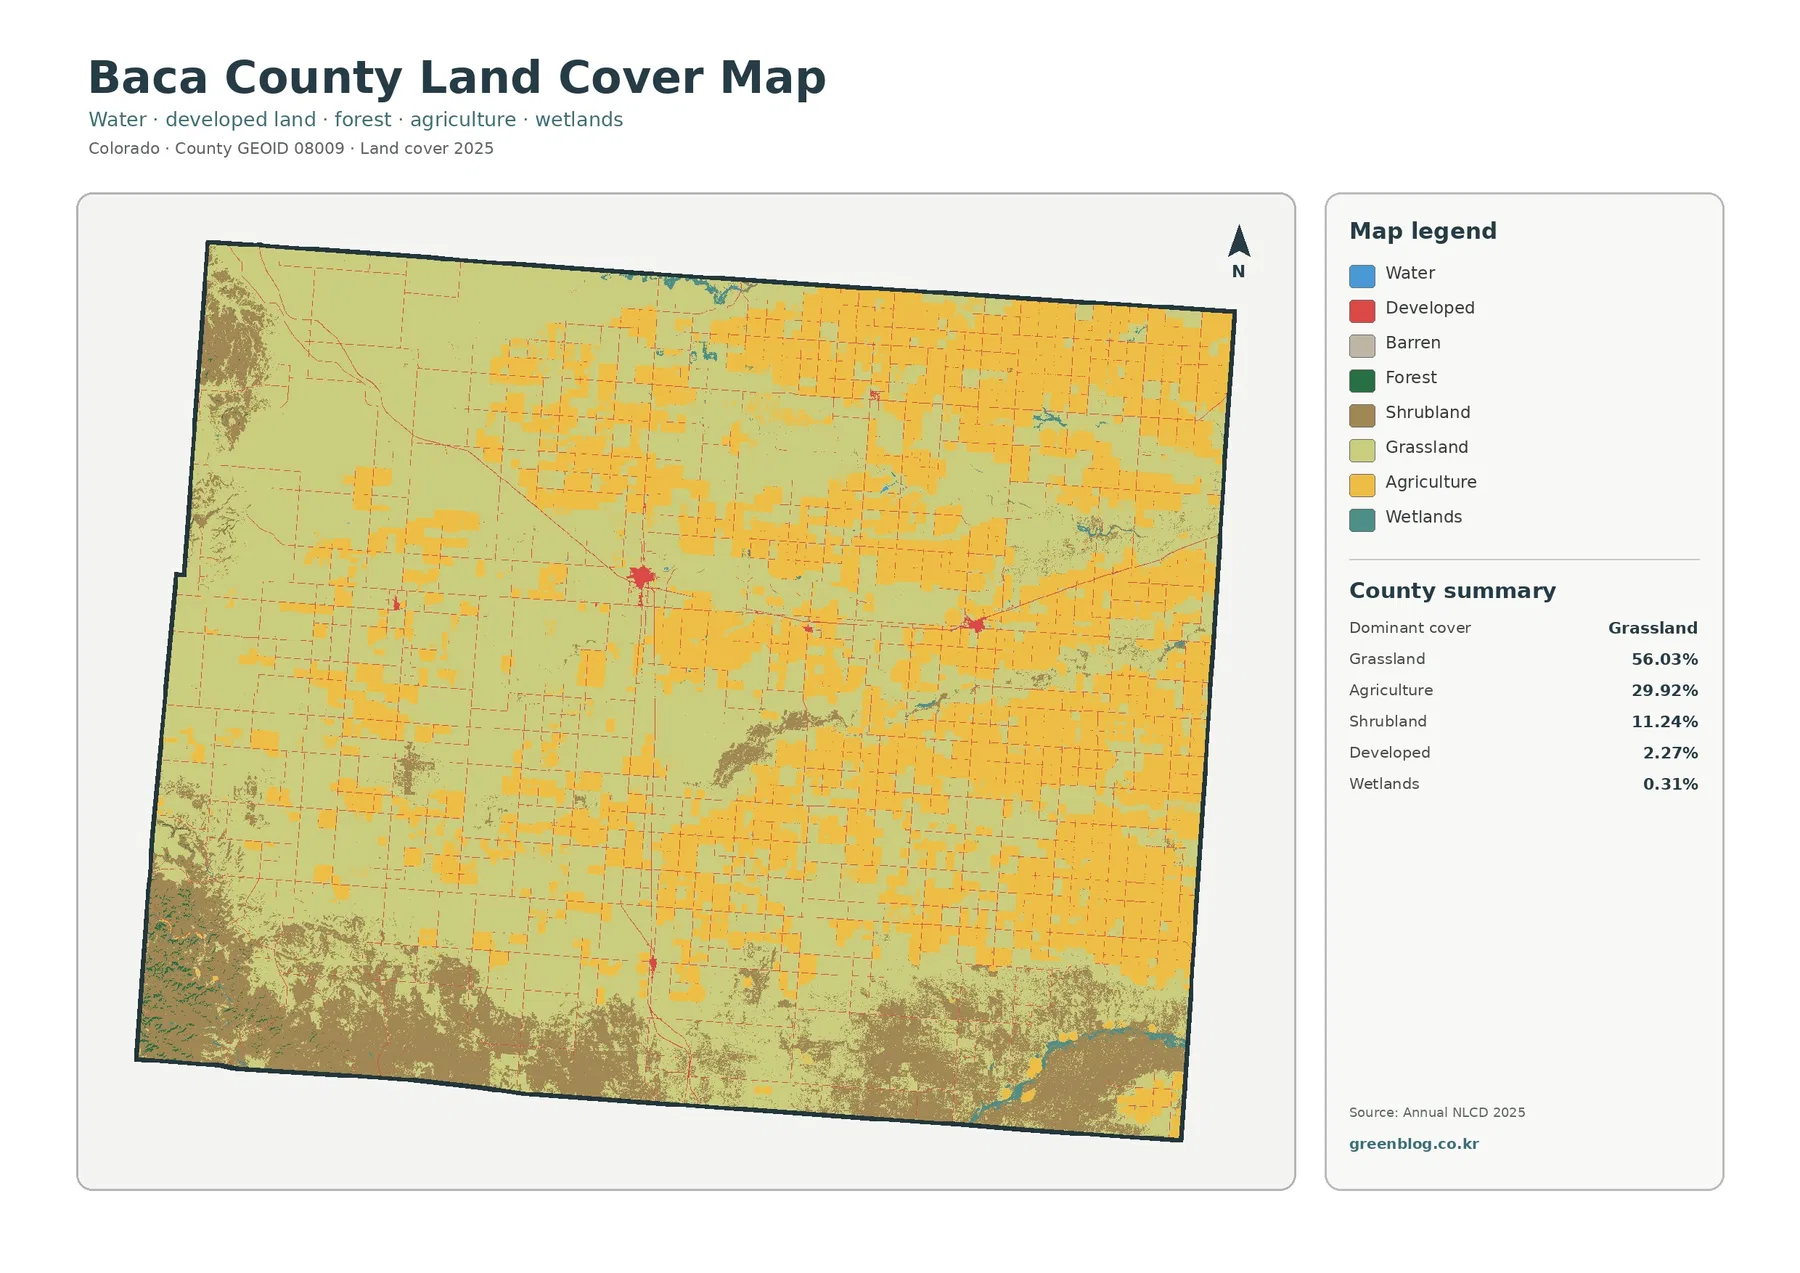
The legend includes water, developed land, barren land, forest, shrubland, grassland, agriculture, and wetlands. Not every class has the same importance in Baca County. Large grassland and agricultural areas can be interpreted at county scale, while tiny water, wetland, and forest classes are easier to miss and should be checked at a closer zoom. A category that occupies a very small percentage is not necessarily absent simply because it does not stand out in the full-page image.
Land cover is also different from legal land use. The classification describes what covers the ground as detected and categorized from remote-sensing data. It does not establish ownership, allowable development, parcel boundaries, or a planning designation. That distinction matters in a county with extensive agricultural land because a map color cannot replace a deed, zoning map, farm record, or site inspection.
The 1985–2025 comparison is dominated by agricultural-class differences
The change map compares classifications from 1985 and 2025. The supplied summary reports class differences across 21.97% of the county. Agricultural loss is the largest labeled component at 18.04%, while 0.46% is classified as change to developed and 3.39% falls into other differences. Forest loss is shown as 0.00%. On the map, the agricultural-loss color is spread through many rectangular areas, especially where current agricultural and grassland patterns are most fragmented.
The phrase “agricultural loss” needs careful reading. It means that cells classified as agriculture at one side of the comparison are no longer in that agricultural class at the other side. It does not, by itself, prove permanent abandonment, economic decline, or a legal conversion of farmland. The map itself warns that class differences may include classification variation, and long comparisons can also be influenced by mixed pixels and differences in how land cover is represented across datasets.
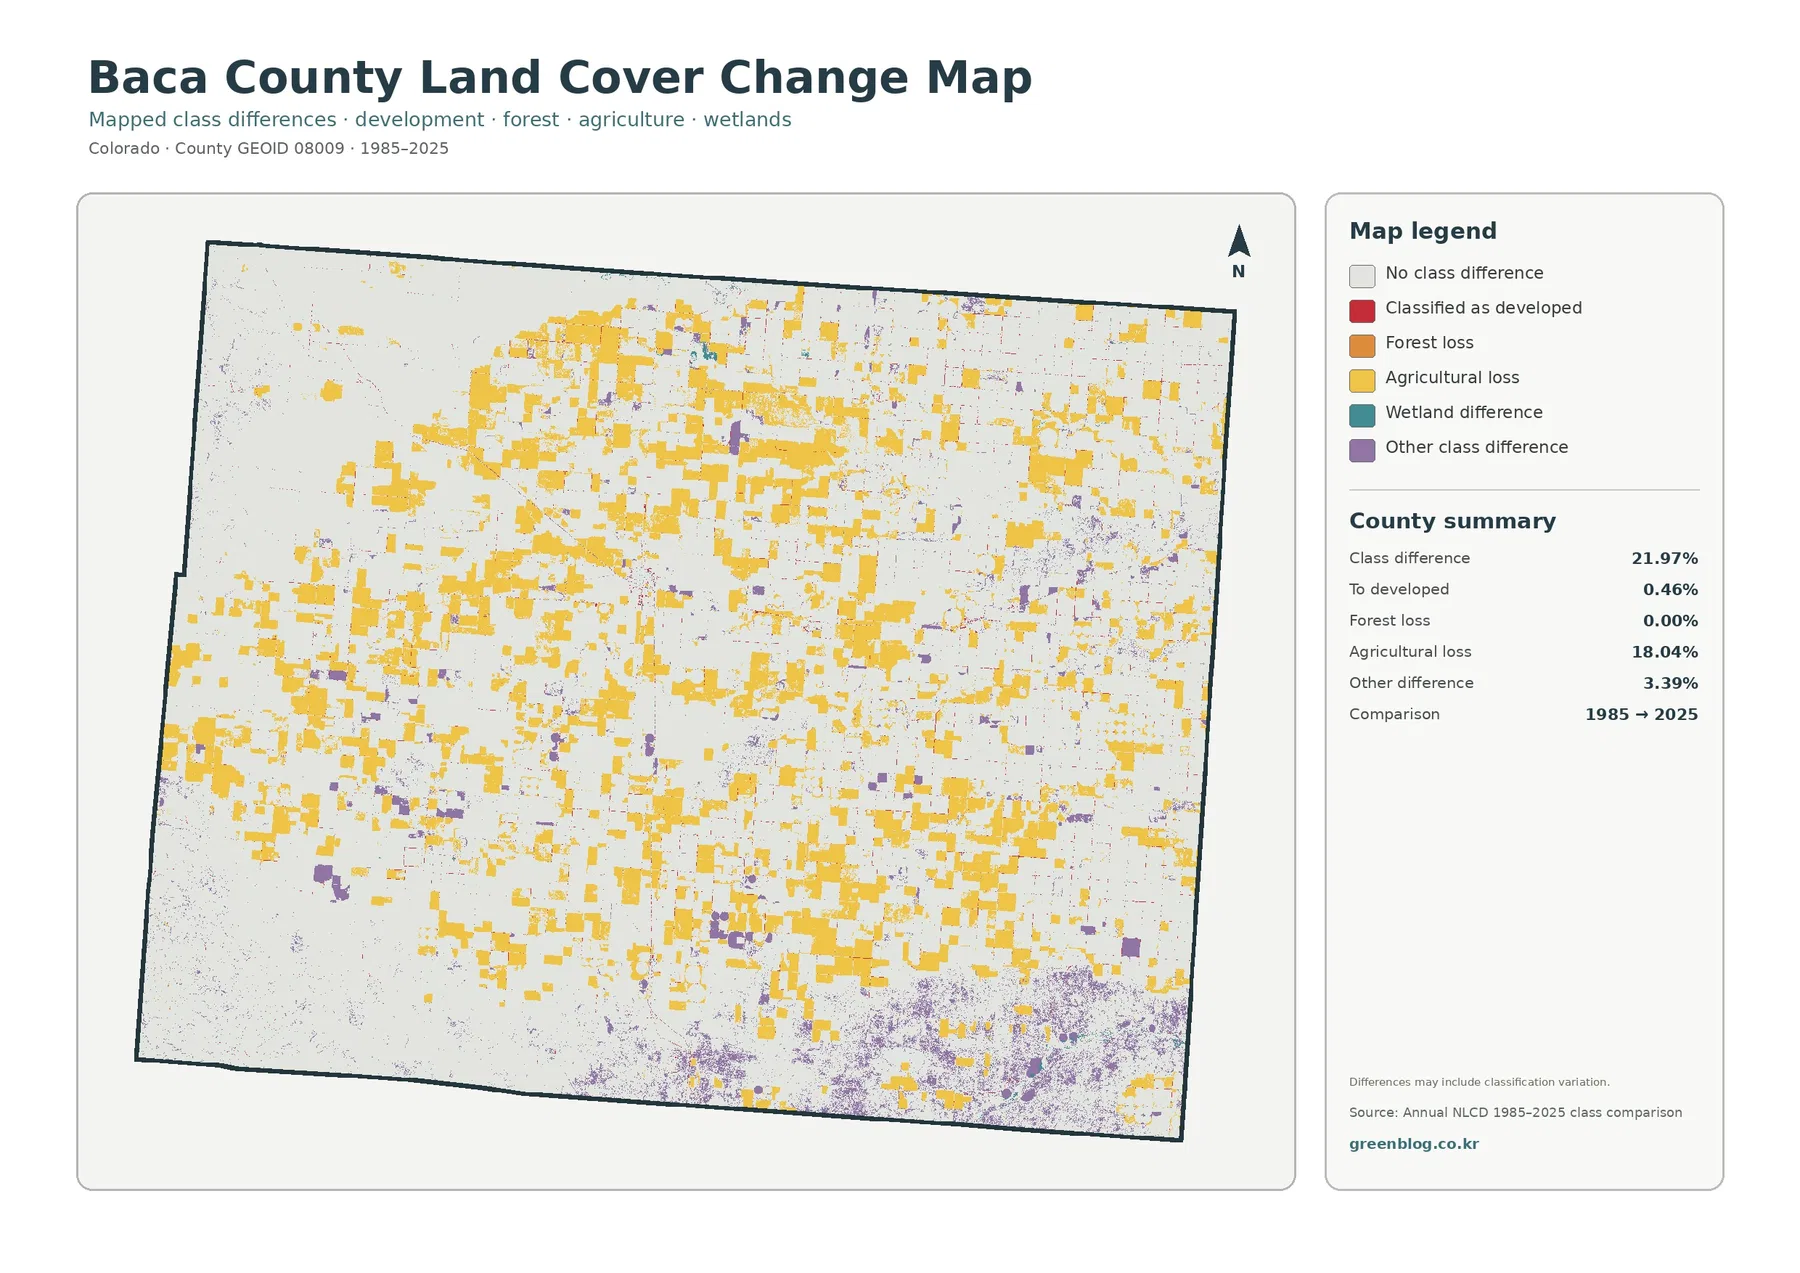
A productive way to use this layer is to place it beside the 2025 land-cover map rather than reading it alone. If a change cell falls in an area that is currently grassland, agriculture, or shrubland, the current map gives context for the end condition. Areas with no class difference provide another useful reference because they show where the broad category remained the same between the two comparison years. The map cannot identify the exact year in which a change occurred between 1985 and 2025.
A practical sequence for comparing the four maps
For a countywide overview, start with the current land-cover map and identify the large grassland, agricultural, and shrubland areas. Move next to the forest-and-farmland map to simplify that comparison and trace the shape of cultivated blocks. The impervious map then answers a different question: where are hard surfaces concentrated within a county that is otherwise overwhelmingly open? Finish with the change map to locate places where the classification differs between 1985 and 2025.
This sequence works well for classroom exercises because students can see how the same county changes when the map emphasizes a different variable. It also works for reports and presentations that need a concise rural-development comparison. For example, the 2.27% developed-cover figure can be paired with the 0.29% mean impervious value to show that developed classification and hard-surface intensity are related but not interchangeable measures.
For agricultural or natural-resource discussions, the maps are best used as context rather than as operational instructions. Colorado State University Extension’s Baca County office lists agriculture and natural resources among its program areas, which reflects the local relevance of these topics. The map set can help frame questions about where grassland and agriculture are concentrated, but decisions about soils, water, grazing, planting, or individual properties require more detailed local information.
Scale, mixed pixels, and classification limits
Annual NLCD is a raster product, meaning the landscape is represented by a grid of cells. A raster cell is simply one small square in that grid. If a cell contains a road, grass, a building, and bare ground at the same time, the final class or impervious fraction simplifies that mixture. Narrow roads, tiny ponds, small wet spots, or isolated buildings may therefore appear wider, smaller, merged with a neighboring class, or not visible at the scale of the county map.
The 2025 maps describe the classification for that mapped year, not a live view of conditions on the ground. Vegetation can vary seasonally, fields can rotate between crops and fallow conditions, and new construction can occur after the observation period. The 1985–2025 comparison is similarly a two-endpoint view. It helps locate long-term classification differences but does not provide a year-by-year history or establish why a particular cell changed.
These limitations are especially important for Baca County’s smallest categories. Water at 0.01%, forest at 0.21%, and wetlands at 0.31% occupy so little of the county that a full-page image can make them look nearly absent. When those classes are the subject of a project, zoom in and consult source data or a more specialized hydrology or vegetation dataset rather than relying only on the countywide preview.
Download the four Baca County JPG maps
The download contains the four original JPG maps used for this county package: current land cover, forest and farmland, impervious/developed land, and the 1985–2025 land-cover comparison. Each JPG is 2480×1754 pixels. The package manifest does not mark these files as meeting its A3 high-resolution reference, so they are provided at their original size without claiming a larger print specification.
Frequently Asked Questions
Why does Baca County have so little impervious surface on the map?
The supplied layer reports a countywide mean impervious value of 0.29%, with only 0.02% of the area at 50% impervious or higher. Most of Baca County is grassland, agriculture, or shrubland, while built surfaces are concentrated in small communities and road corridors. The map therefore remains very light across most of the county and becomes darker only in limited clusters.
Does the 18.04% agricultural-loss value mean 18.04% of farms disappeared?
No. It is a land-cover classification comparison between 1985 and 2025, not a count of farms or a measure of legal farmland conversion. The change layer notes that classification variation can be part of the difference. Farm numbers, acreage in production, ownership, and the reason for any change must be checked with separate agricultural or parcel records.
Which Baca County map should I use first?
Use the general 2025 land-cover map first when you need the full county pattern. Choose the forest-and-farmland map when the main question is the boundary between cropland and open grass/shrub cover. Use the impervious map for built-surface concentration, and the change map only when you specifically need the 1985–2025 classification comparison.
Map File Information
The ZIP contains the four original Baca County JPG maps: land cover, forest and farmland, impervious/developed land, and 1985–2025 land-cover change.
- File Type: Four JPG files in one ZIP archive
Related Maps
- Adams County Colorado Land Cover Map
- Alamosa County Colorado Land Cover Map
- Arapahoe County Colorado Land Cover Map
Sources and References
- MRLC Annual NLCD Data — source access for Annual NLCD land-cover products.
- USGS Annual NLCD Land Cover Classification — definitions and interpretation of land-cover classes.
- U.S. Census Bureau TIGER/Line Shapefiles — reference source for county boundaries.
- Baca County, Colorado — official county background, community list, and local context.
- Colorado State University Extension — Baca County — local agriculture and natural-resources program context.
Green Map creates custom-edited map images using open geographic data sources such as geoBoundaries, Natural Earth, OpenStreetMap, and government open data.
These maps are edited visual materials, not raw data files, and are provided for education, documents, presentations, and graphic reference.