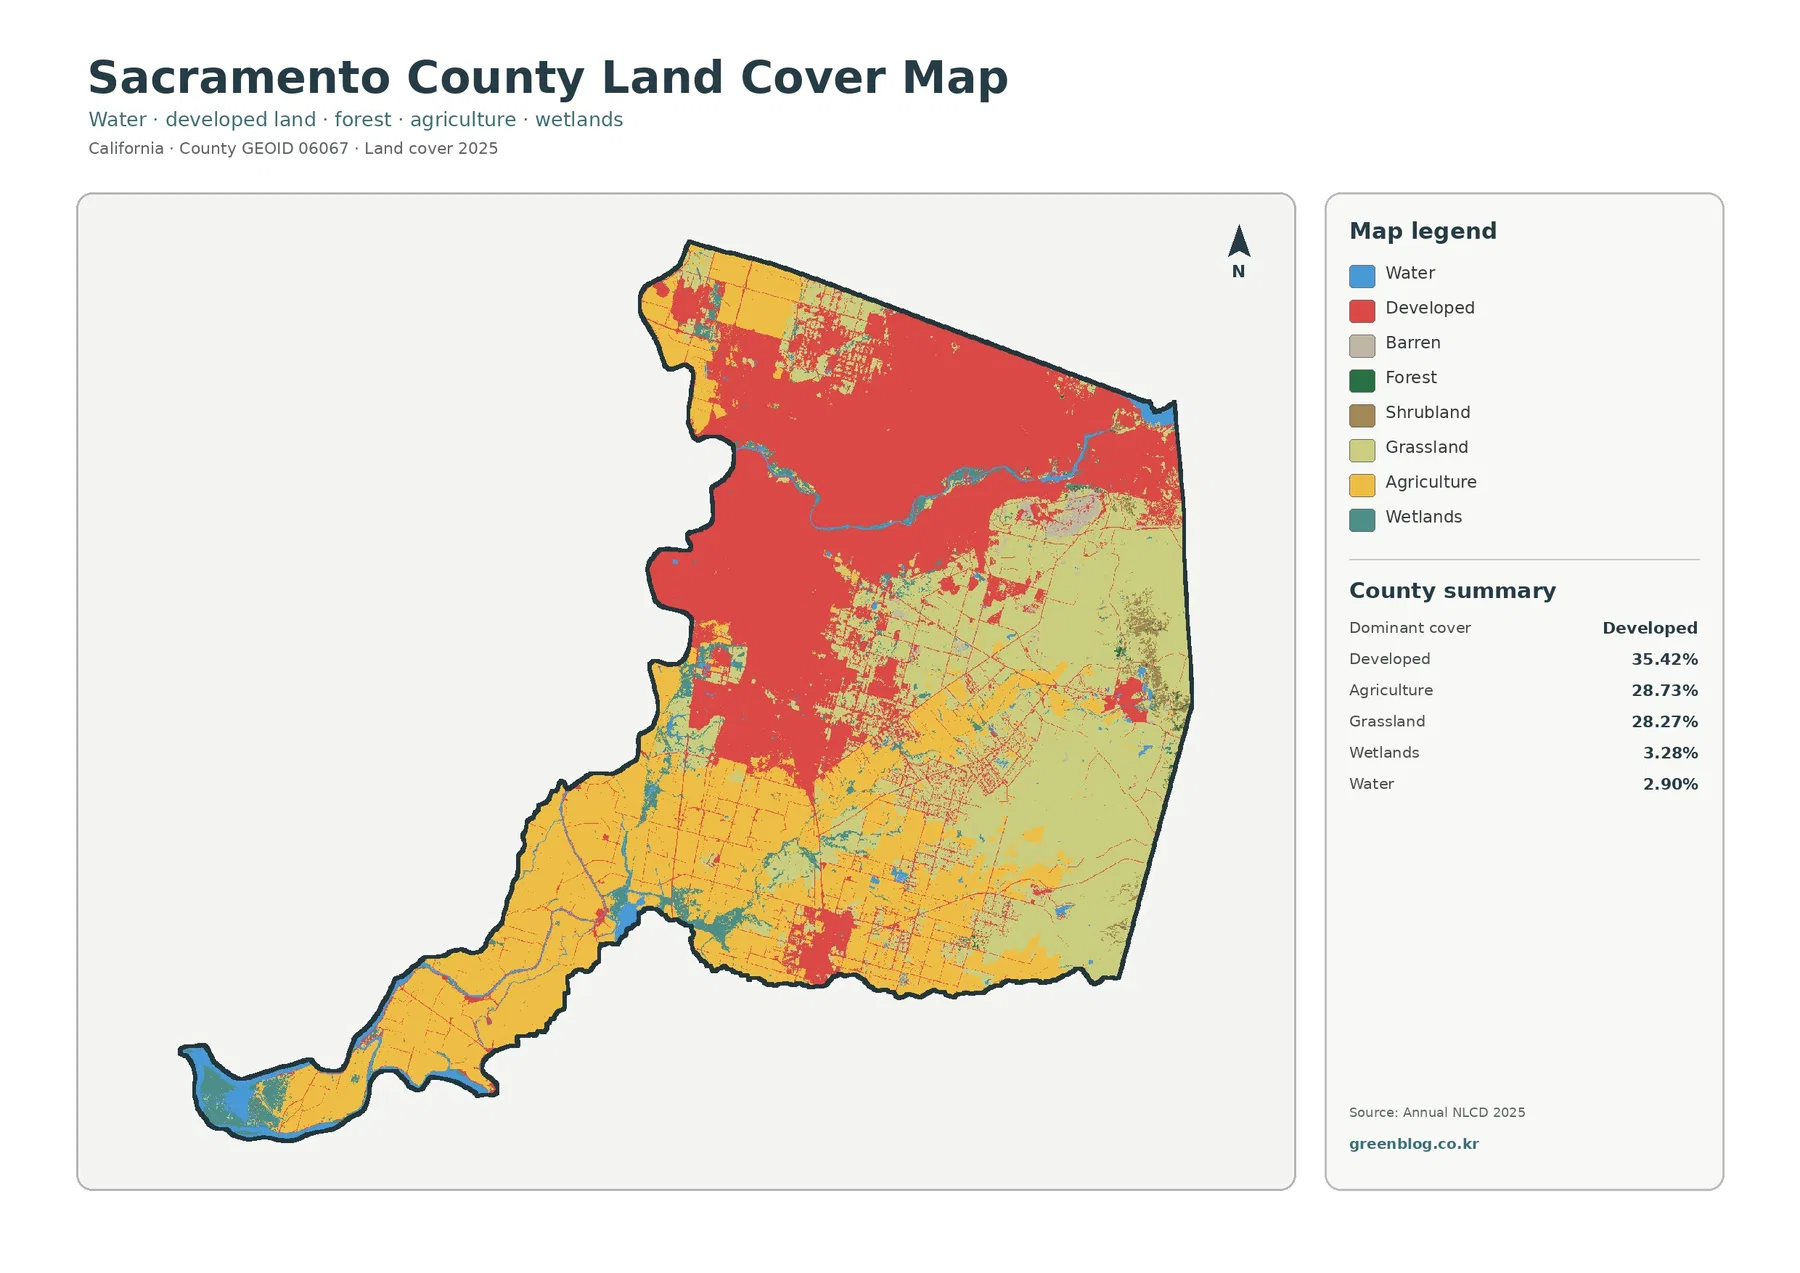
Sacramento County’s 2025 land-cover map is defined by an unusually close three-way balance. Developed cover leads at 35.42%, but agriculture at 28.73% and grassland at 28.27% are nearly equal to one another and occupy very different parts of the county. The broad northern half is dominated by developed land, the south and southwest contain extensive farmed areas and Delta water, and the east and southeast open into large grassland tracts.
This page compares four views of that pattern: general land cover, forest and farmland, impervious surface and developed land, and mapped class differences between 1985 and 2025. The WebP images are quick previews, while the four original JPG maps are available together in one download below. Land cover describes what is physically covering the ground; it does not define zoning, ownership, permitted development, or a parcel’s legal land use.
Table of Contents
Three major covers divide Sacramento County into very different landscapes
Developed land accounts for 35.42% of the 2025 summary, agriculture 28.73%, and grassland 28.27%. Wetlands contribute 3.28%, water 2.90%, shrubland 0.68%, and forest only 0.10%. Those percentages are useful, but the map matters just as much as the table because the three dominant classes are not evenly mixed. Each forms a recognizable regional pattern.
The developed class forms the largest continuous block across the northern and north-central part of the county, in the general area of the Sacramento metropolitan landscape. Moving south, that red field breaks into smaller patches and gives way to agriculture, grassland, wetlands, and water. The southeastern side is especially different from the urban north, with broad grassland cover and much less continuous development.
That north-to-south contrast is more informative than calling Sacramento County simply “urban” or “agricultural.” Both descriptions are partly true, depending on where the map is being viewed. A countywide percentage compresses those differences into one number, while the map reveals that the urban footprint, farm belt, open grasslands, and Delta waterways occupy distinct zones.
Water corridors cut through the urban north and become a Delta network in the southwest
Water covers 2.90% of the county and wetlands 3.28%, modest shares by area but highly visible because they form long lines, broad bends, and clustered channels. In the northern urban zone, blue and wetland-colored corridors interrupt the developed surface. Along the western side and into the southwestern extension, water becomes more frequent and is closely interwoven with agricultural land.
The American River is one of the county’s major river corridors, and Sacramento County’s Regional Parks department manages the American River Parkway along it. The land-cover image does not show the park boundary, yet the river corridor helps explain why a linear strip of water and adjacent non-developed cover remains visible inside a much larger developed setting. It is a useful example of why a small countywide water percentage can still be geographically important.
The southwest is different again. Sacramento County’s official Delta planning material describes the local Delta as a landscape of waterways and fertile land where agriculture remains a major use. That context matches the map’s visual texture: yellow agricultural blocks are repeatedly interrupted by blue water and teal wetland classes. The pattern is far more intricate than the broad urban cover farther north.
These mapped wetlands should not be treated as regulatory wetland boundaries. Annual NLCD identifies land-cover classes from remote-sensing data, whereas jurisdictional wetland determinations require other datasets and, often, site-specific review. The same caution applies to water: a blue cell does not tell the reader whether the feature is a navigable channel, flood-control facility, drainage ditch, or another type of water body.
Agriculture 28.73% forms a broad southern and southwestern belt
Agricultural cover is the second-largest class in the county, only 6.69 percentage points below developed land. The yellow areas are strongest across the southern half and the long southwestern portion of the county, with another agricultural concentration near the northwestern edge. Field-like shapes and repeated blocks make the agricultural landscape especially easy to distinguish from the broad red urban cover to the north.
Sacramento County’s General Plan Agricultural Element separately addresses the protection and continued productivity of agricultural land outside urban areas. That planning context is useful background for a county where the current land-cover map still shows agriculture across more than one-quarter of the area. The 28.73% figure, however, is a land-cover statistic rather than a legal farmland designation, crop acreage total, or statement about the economic value of agriculture.
The forest-and-farmland view makes the agricultural pattern easier to follow because much of the developed and miscellaneous background is muted. In that simplified view, the southern farm belt is visually connected to the Delta waterways, while the east is dominated by open grassland. This is a more useful map than the general view when the question is specifically where agricultural cover sits relative to water and open land.
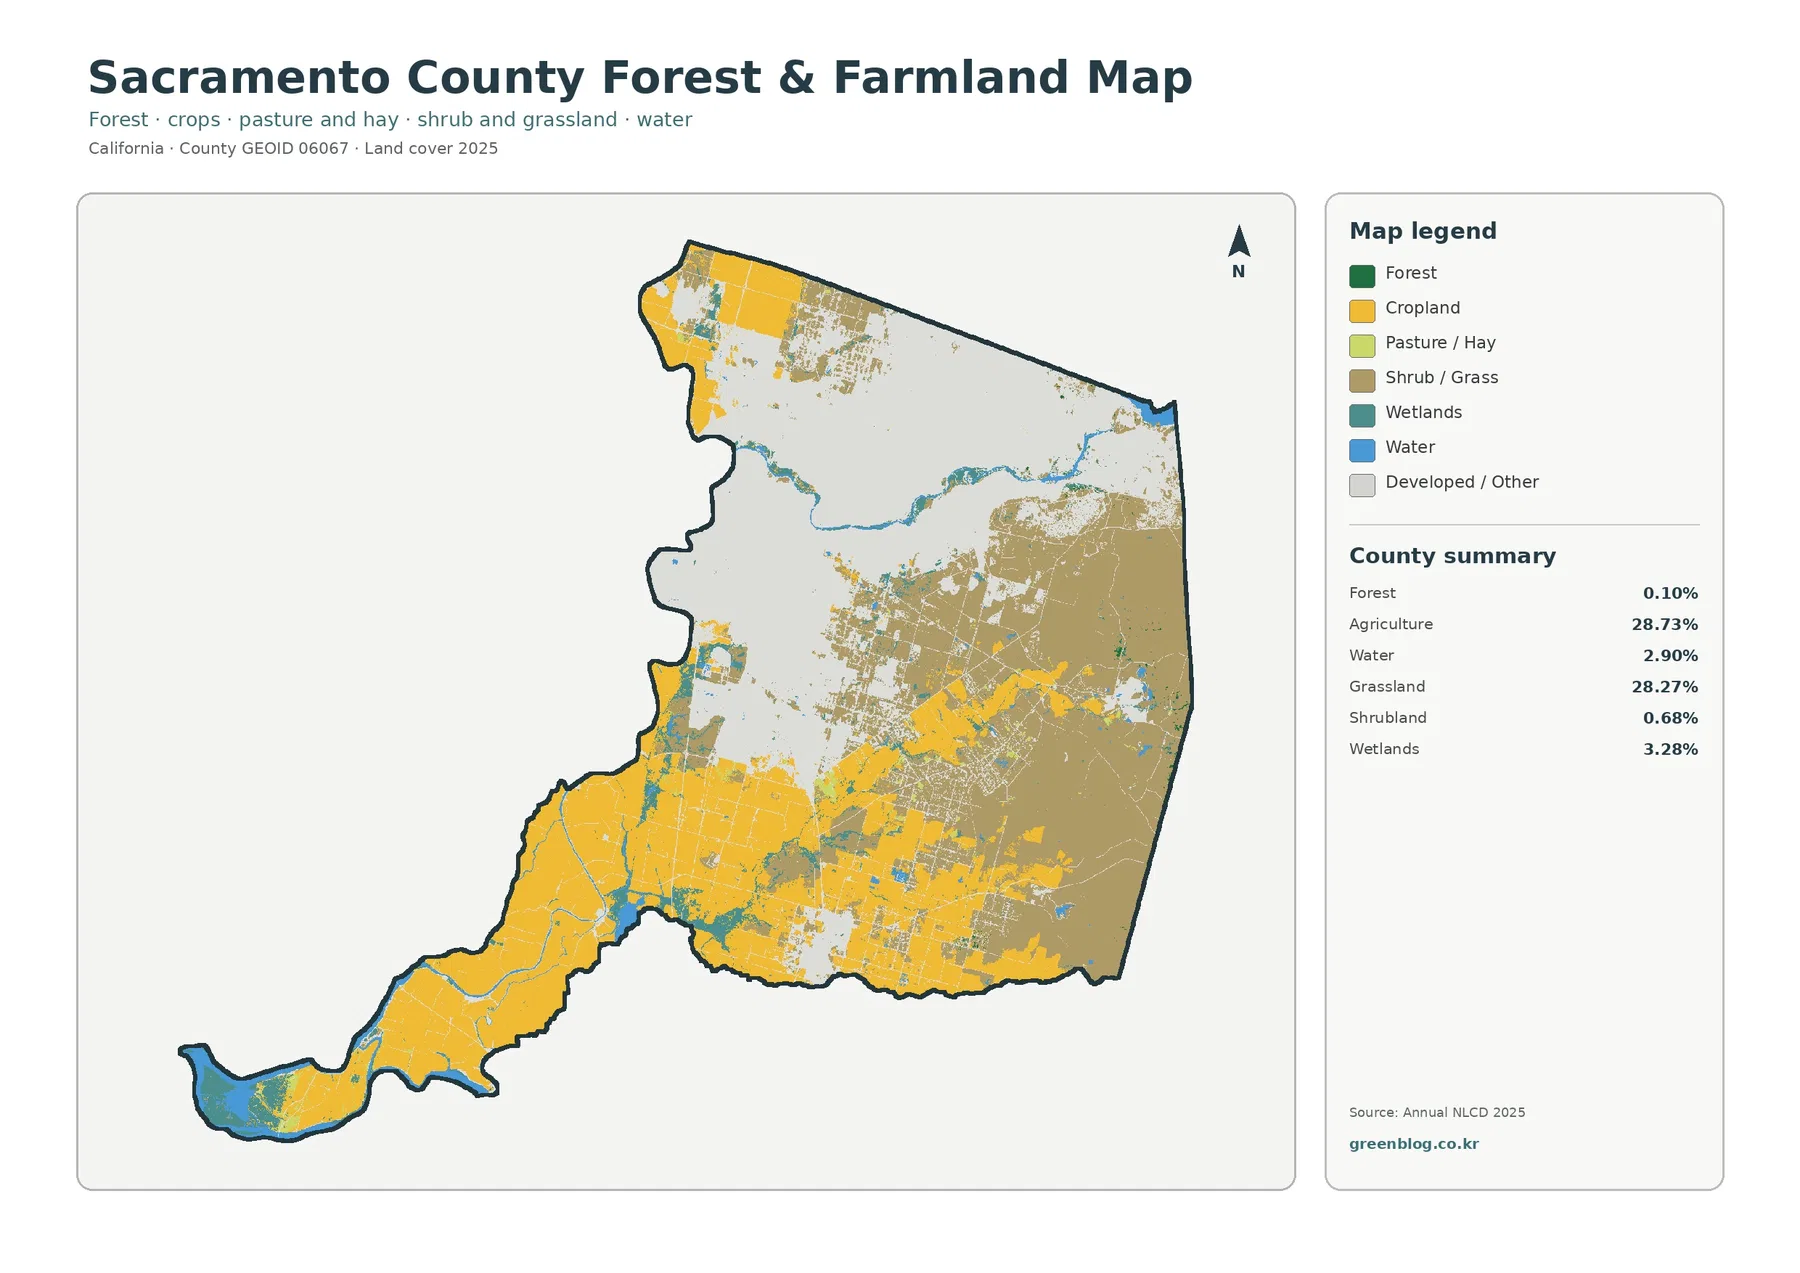
Forest is only 0.10%, so it is not a defining countywide cover in the way it is for many Sierra or North Coast counties. That does not mean Sacramento County lacks trees. Urban trees, riparian tree lines, parks, and small wooded patches may be present without forming large enough continuous areas to dominate 30-meter land-cover cells. The statistic is best read as “very little mapped forest class,” not “almost no trees.”
Grassland 28.27% gives the eastern and southeastern county a much more open appearance
Grassland nearly matches agriculture in area, yet it occupies a different part of the map. Large light-colored tracts spread across the east and southeast, with additional grassland mixed through transition areas between the urban north and agricultural south. This distribution creates a clear east-west contrast as well as the stronger north-south contrast visible in developed and agricultural cover.
Grassland should not be read as a synonym for parkland, grazing land, vacant property, or land available for development. It is a surface-cover class. A grassland cell can occur on properties with very different ownership, planning designations, and management purposes. County open-space and land-use documents answer those administrative questions, while Annual NLCD answers the narrower question of what broad cover type was mapped on the ground.
For visual comparison, trace the southern agricultural blocks eastward until they begin to give way to broad grassland. Then look back north toward the developed area. That simple reading path makes the county’s three dominant classes easy to distinguish without relying on municipal boundaries. It also shows why the nearly identical agriculture and grassland percentages do not describe similar landscapes.
Shrubland is only 0.68%, making Sacramento County quite different from California counties where shrub and chaparral dominate. In county comparisons, the combination of large developed, agricultural, and grassland shares is more distinctive here than shrubland or forest. Water and wetlands add a fourth regional signature because of the Delta and river corridors, even though their percentages are smaller.
Impervious surface reveals where the developed class is actually hardest
Developed cover and impervious surface answer related but different questions. Developed cover identifies a broad land-cover setting, while imperviousness estimates the share of hard surfaces such as pavement and rooftops within each cell. Sacramento County’s mean impervious surface is 16.49%, and 17.83% of the county is mapped at 50% impervious or higher.
The strongest impervious values cluster in the same general northern urban area that is red on the land-cover map, but the impervious map adds internal detail. Some neighborhoods and outer developed areas are lighter because they contain more vegetation or open ground. Darker patches mark cells with much larger proportions of hard surface. The result is a textured urban pattern rather than a single uniform block.
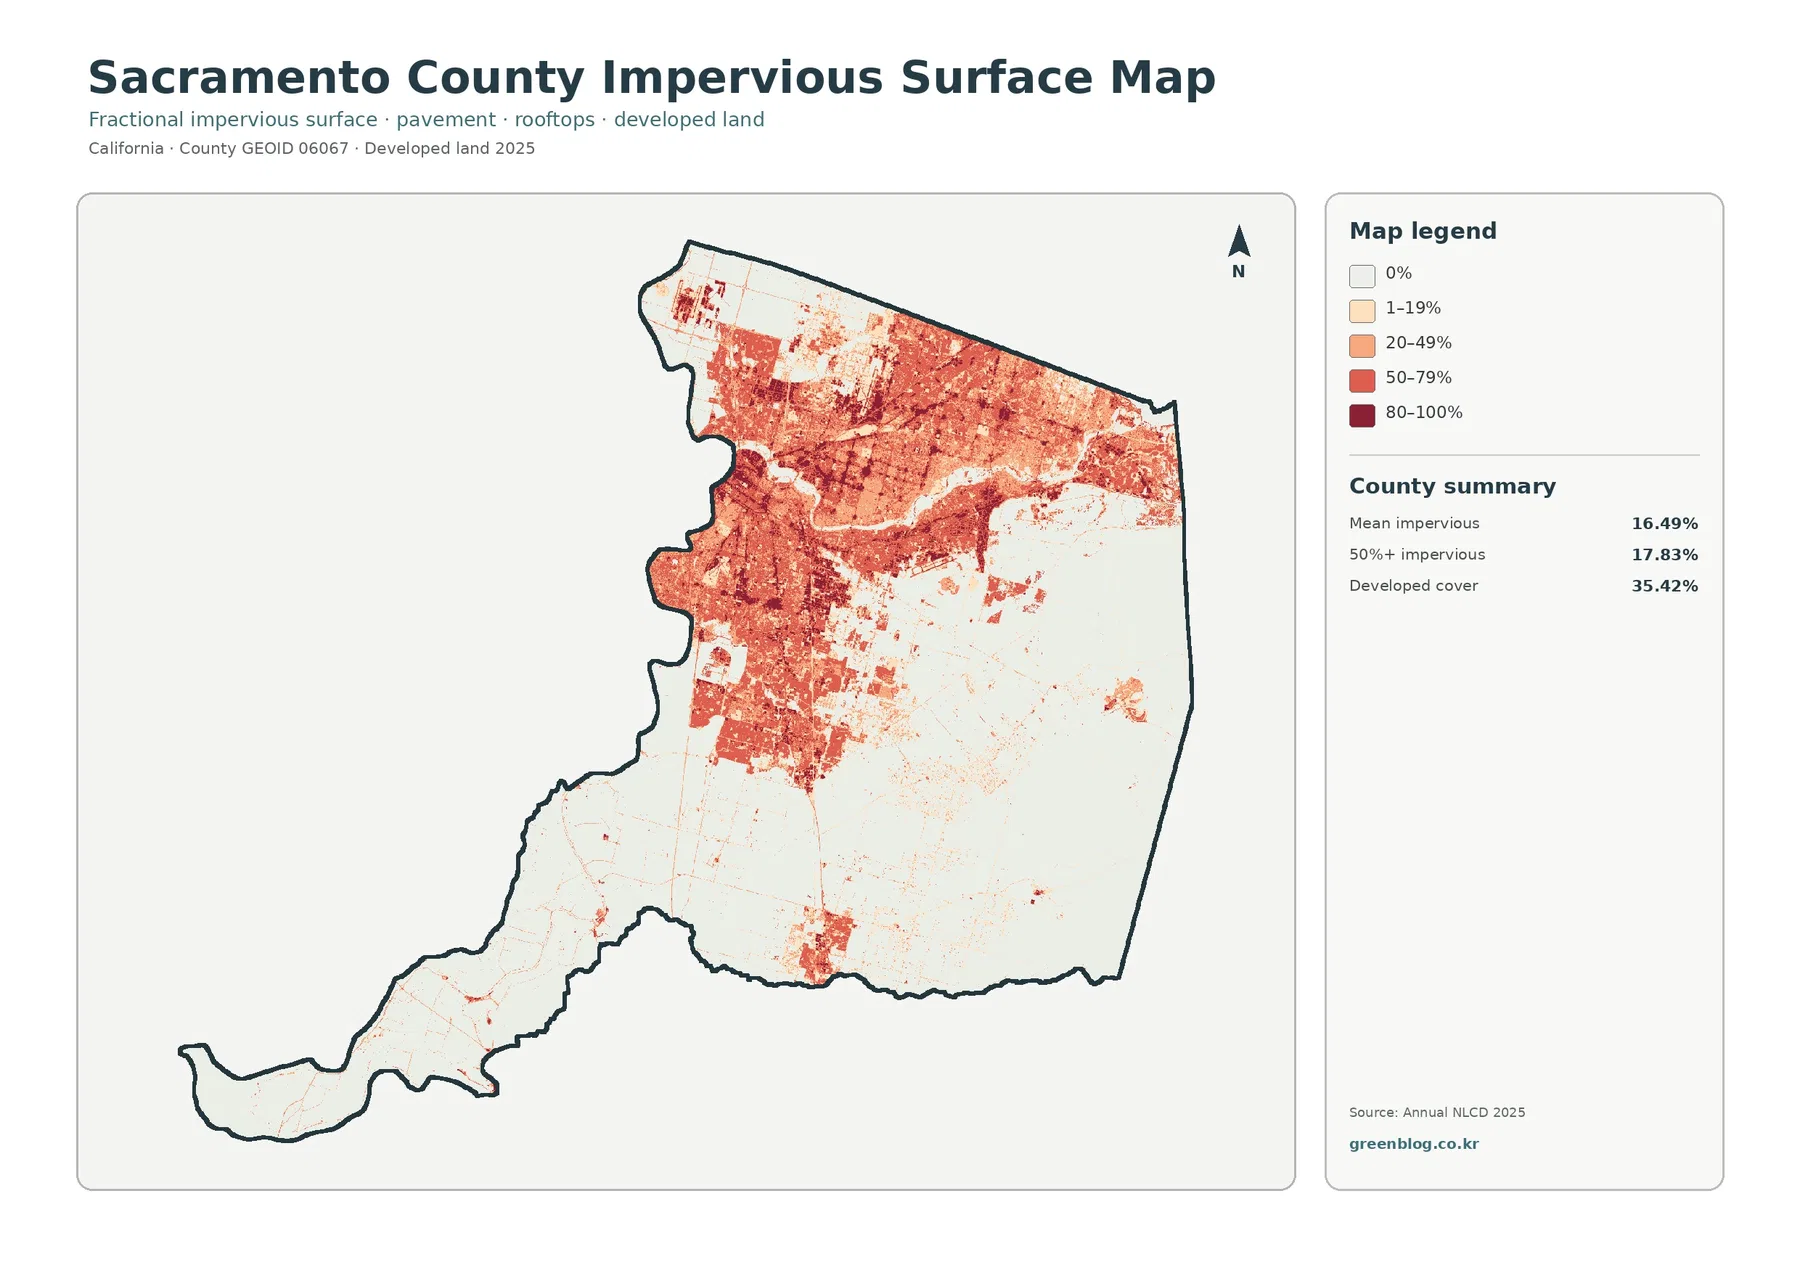
South of the main urban concentration, hard-surface values drop sharply across much of the agricultural and grassland landscape. Smaller developed clusters and thin linear features remain visible, but they do not form the same continuous high-impervious field found in the north. The Delta extension is especially light overall, consistent with its broad agricultural and water-dominated cover.
A 16.49% county mean should not be used as the impervious percentage for a neighborhood or parcel. Raster cells average mixed surfaces, and local conditions can differ greatly from the countywide figure. Nor is imperviousness by itself a flood-risk map. Runoff and flooding also depend on topography, drainage infrastructure, river levels, levees, soils, rainfall, and other factors.
The map is most useful for comparing concentration. It shows where hard surfaces form large connected areas, where they become patchy, and where they nearly disappear into farmland, grassland, wetlands, and water. For urban-versus-rural presentations, pairing this map with the general land-cover view communicates both the breadth of developed land and the intensity of its hard surfaces.
The 1985–2025 map records a 23.50% endpoint class difference
The change map compares broad land-cover classes at two endpoints, 1985 and 2025. It reports a total class difference of 23.50%. Within that total, 11.64% is mapped as a change to developed cover, 3.18% as agricultural loss, 0.02% as forest loss, and 8.21% as other class difference. These categories do not sum to the current 2025 land-cover shares because they describe a different measurement.
Red “to developed” cells are widespread around the northern and central urbanized landscape and appear in additional clusters farther south. Their location makes sense when compared with the current developed and impervious maps, but the change map does not identify a construction date or explain why a cell changed. It only shows that the broad endpoint class differs in the specified way.
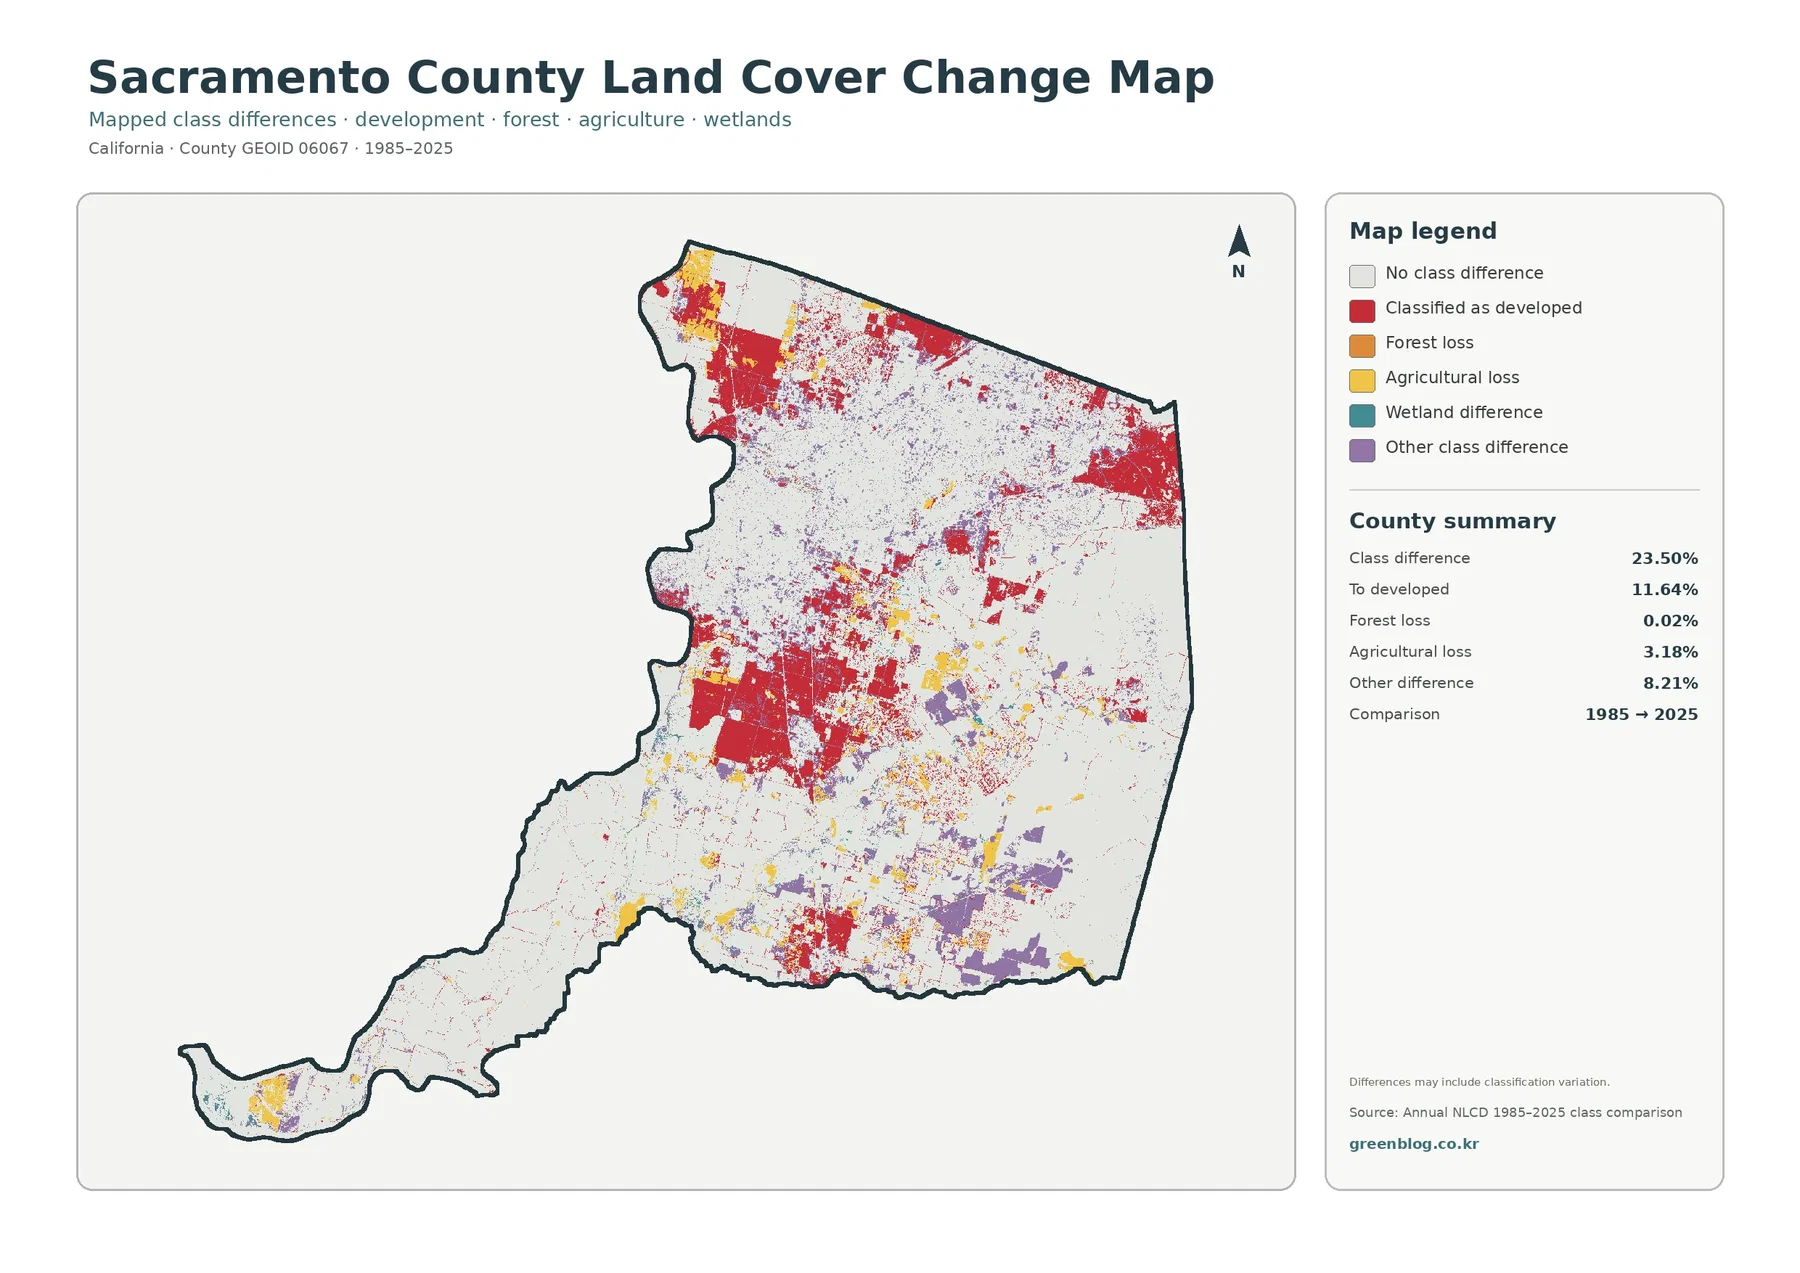
Agricultural-loss cells appear in several parts of the southern and transitional landscape. They should not automatically be described as urban conversion, because “to developed” is shown as its own category. A cell can leave the agricultural class for another reason or another mapped cover. Establishing the actual sequence requires intermediate Annual NLCD years, aerial imagery, or local land records.
The map also warns that differences may include classification variation. Seasonal vegetation, mixed pixels, image conditions, and classification procedures can place a cell in different broad classes at the two endpoints even when physical change is subtle. Conversely, a white cell means the 1985 and 2025 endpoint classes match; it does not prove that nothing changed during the intervening forty years.
A four-map reading sequence keeps present cover and historical difference separate
Begin with the general 2025 map and locate four anchors: the broad developed north, the southern agricultural belt, the eastern and southeastern grasslands, and the river-and-Delta water network. Those features establish the county’s current layout. Once they are familiar, the specialized maps become easier to interpret because each removes some information and emphasizes another part of the same boundary.
Use the forest-and-farmland map for agriculture, grassland, wetlands, and water. It is particularly helpful in the southwest, where the Delta pattern can become visually busy on the full land-cover map. The simplified colors make it easier to see agricultural blocks separated by channels and wetland areas, while also showing how little mapped forest class exists countywide.
Switch to impervious surface when the question becomes urban intensity rather than urban extent. The developed class tells where developed landscapes occur; imperviousness shows where hard surfaces occupy a larger share of each cell. The two maps together prevent a low-density developed area from being interpreted as if it were entirely paved.
View the change map last. By that point the 2025 agricultural, grassland, water, and developed zones are already familiar, so the 1985–2025 difference categories have a clear present-day reference. This order also reduces the common mistake of treating the 23.50% class-difference figure as a current land-cover percentage or a permanent land-use conversion rate.
Map File Information and the four-JPG download
The download package contains four Sacramento County JPG maps: general 2025 land cover, forest and farmland, impervious surface and developed land, and the 1985–2025 land-cover class-difference map. Because every image uses the same county outline, they work well as a comparison set for reports, classroom material, presentations, or printed reference sheets.
Keep the legend and date visible when reusing the files. Three maps describe 2025 conditions, while the change image compares 1985 with 2025. If the title or legend is cropped away, viewers can easily confuse a current developed-cover percentage with a historical difference category.
The JPGs are finished reference graphics rather than raw GIS layers. They are suited to broad visual comparison, but not to measuring parcel boundaries, calculating exact acreage, or extracting a precise cell value. Analytical users should return to the Annual NLCD datasets and authoritative county boundaries listed in the sources.
For a printed comparison, placing the general map beside one specialized map is usually clearer than reducing all four to very small thumbnails. General land cover plus impervious surface explains the urban north; general land cover plus forest-and-farmland highlights the agricultural south and Delta; current cover plus the change map works best for a time-comparison discussion.
Raster scale and land-cover definitions set important limits
Annual NLCD is raster data, so each cell receives a representative class. At roughly 30-meter scale, one cell can contain a road, yard, building, trees, and bare soil, or a mix of cropland and drainage features. The mapped category simplifies that mixture. Boundaries between urban land and farms, narrow river corridors, small wetlands, and individual field edges can therefore look more generalized than they would in parcel or engineering data.
That limitation matters in central Sacramento County, where developed, agricultural, and grassland classes meet, and in the Delta, where narrow waterways and wetlands thread between farmed areas. The colored edge should be interpreted as the approximate transition in representative cover at raster scale, not as a surveyed property line, levee alignment, or regulatory boundary.
Imperviousness has the same mixed-cell issue. A suburban cell may include rooftops and streets but also lawns and trees, while a commercial cell may be dominated by parking and roofs. That is why developed cover can occupy 35.42% of the county while the mean impervious surface is 16.49%. The two statistics are complementary rather than contradictory.
Finally, land cover is not land-use regulation. Agricultural cover does not prove that a parcel has an agricultural zoning designation; grassland does not identify protected open space; developed cover does not define a city limit or growth boundary. Sacramento County planning, parcel, agricultural, and flood-management sources are required when the question is administrative rather than visual.
Frequently Asked Questions
Why do developed land, agriculture, and grassland all have such large shares in Sacramento County?
They are concentrated in different parts of the county. Developed cover is strongest across the north and north-central area, agriculture is extensive in the south and southwest, and grassland dominates much of the east and southeast. Countywide percentages combine those separate landscapes, so the map is necessary to understand where each large share actually occurs.
Why is developed cover 35.42% while mean impervious surface is 16.49%?
Developed cover is a broad land-cover class that can include buildings, roads, yards, trees, soil, and other surfaces within developed settings. Imperviousness estimates only the hard-surface portion such as pavement and rooftops. Because developed areas also contain permeable ground and vegetation, the countywide impervious mean can be much lower than the developed-cover share.
Does the 23.50% 1985–2025 class difference mean that 23.50% of Sacramento County permanently changed land use?
No. The number means that the broad mapped land-cover class differs between the two endpoints for that share of the county. The change map notes that classification variation may be included. Real development or agricultural change can contribute, but mixed pixels and classification differences can also matter. Intermediate-year data and local records are needed to determine timing and cause.
Map File Information
Download the four original Sacramento County land-cover JPG maps together in one ZIP file.
- File Type: ZIP containing four JPG files
Related Maps
- Alameda County California Land Cover Map
- Alpine County California Land Cover Map
- Amador County California Land Cover Map
Sources and references
These sources document the Annual NLCD classes and provide official Sacramento County context for agriculture, the American River, and the Delta. They should be used according to purpose: land-cover sources describe mapped surface classes, while county planning sources address local land-use and resource policy.
- MRLC Annual NLCD Data — annual land-cover and related datasets
- USGS Annual NLCD Land Cover Classification — class definitions and legend information
- U.S. Census Bureau TIGER/Line Shapefiles — county boundary reference data
- Sacramento County General Plan Agricultural Element — official background on county agricultural land and policy
- Sacramento County American River Parkway — official river-corridor park and planning information
- Sacramento County Delta Project Applicant’s Guidebook — official context for waterways, agriculture, and land use in the county’s Delta area
Green Map creates custom-edited map images using open geographic data sources such as geoBoundaries, Natural Earth, OpenStreetMap, and government open data.
These maps are edited visual materials, not raw data files, and are provided for education, documents, presentations, and graphic reference.