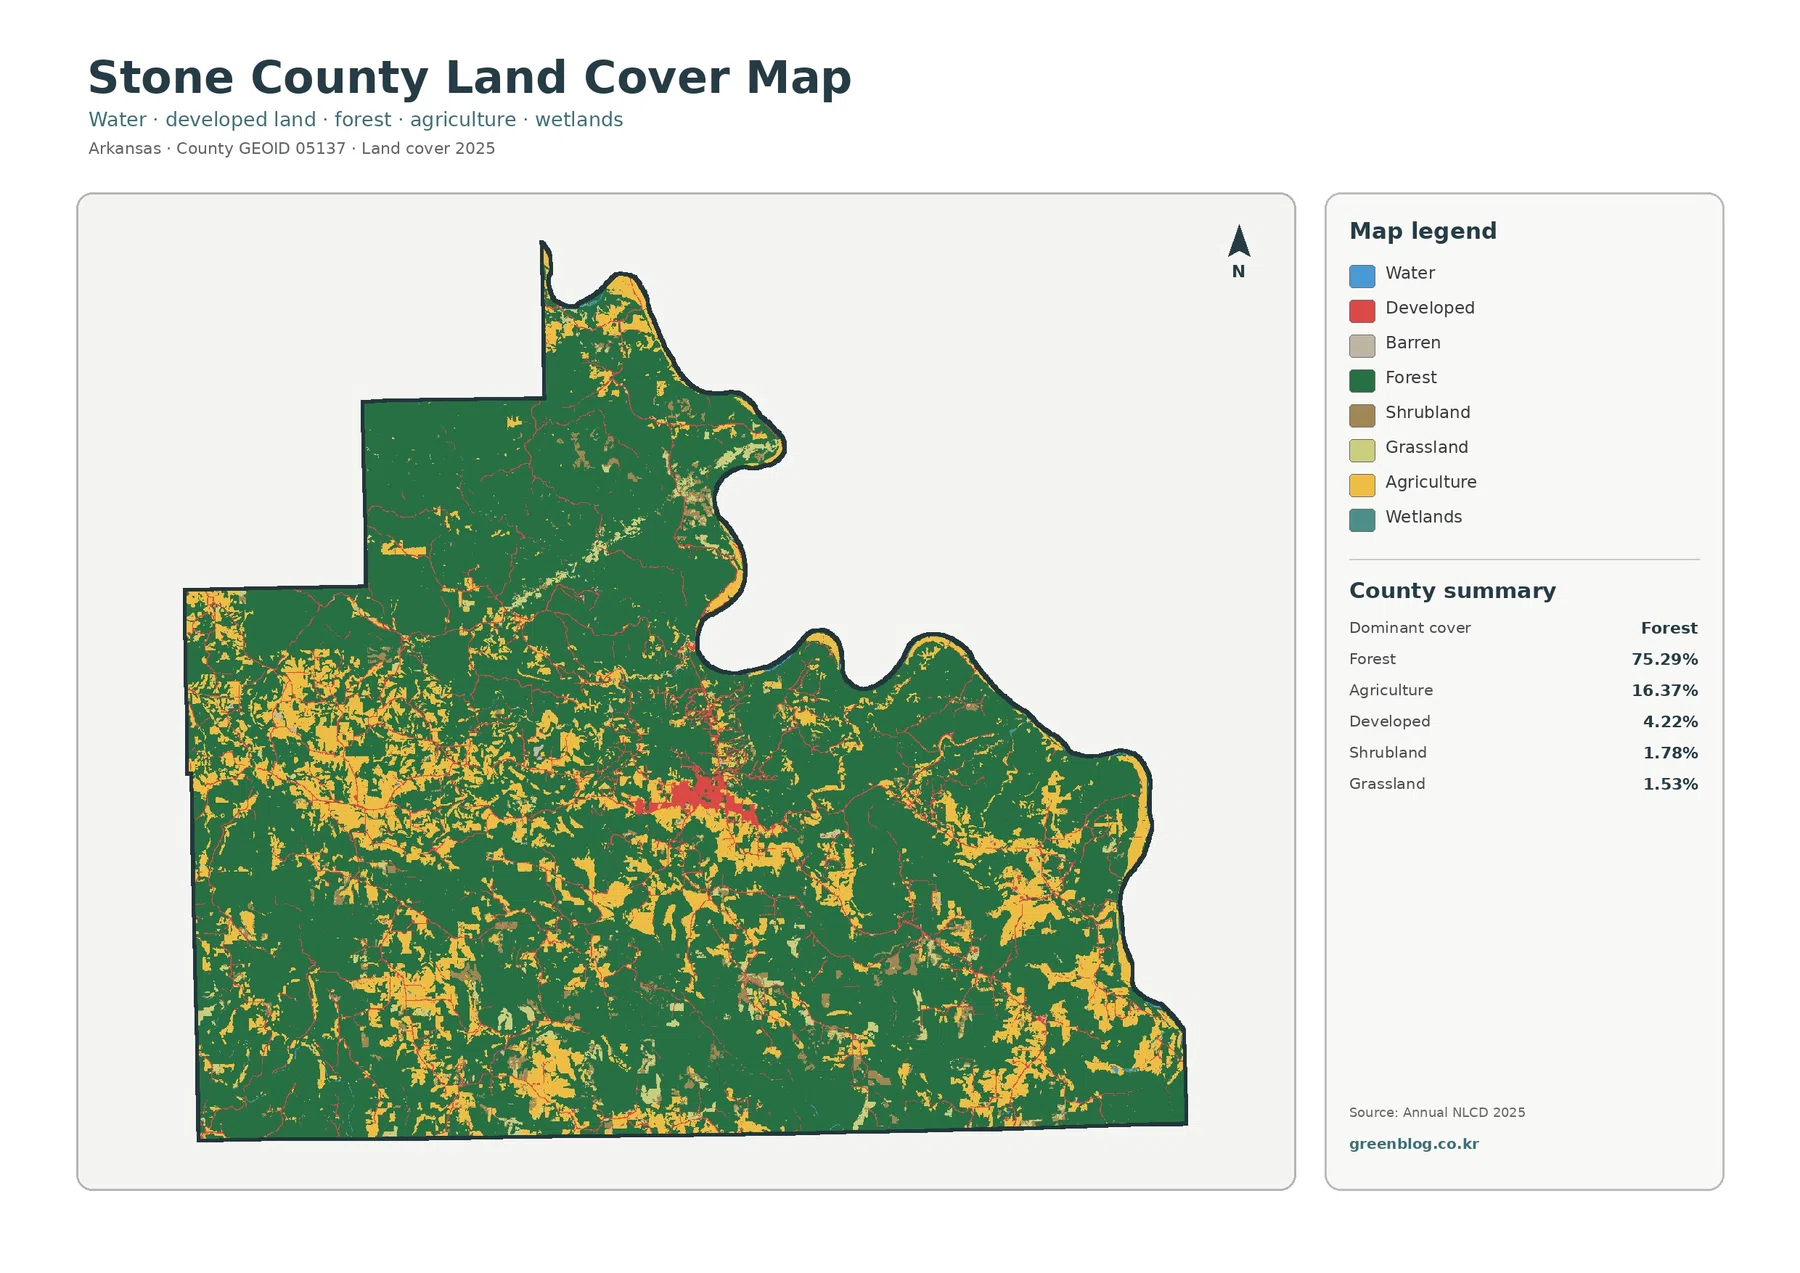
Stone County sits in north-central Arkansas, where the 2025 land-cover map is dominated by one unmistakable pattern: forest covers most of the county. The supplied summary places forest at 75.29 percent, followed by agriculture at 16.37 percent and developed land at 4.22 percent. Open agricultural patches become more frequent across the southern and southwestern portions, while the strongest developed cluster appears near the center of the county around Mountain View.
The page includes four complementary views rather than four versions of the same picture. One map shows the full land-cover mix, another separates forest from farmland and other open classes, a third isolates impervious surfaces such as pavement and rooftops, and the last compares mapped classes from 1985 to 2025. The four original JPG maps are also available together in one download for printing or offline reference.
Table of Contents
A forest-first landscape with smaller openings in the south
The general land-cover map makes Stone County look overwhelmingly green, and the 75.29 percent forest figure explains why. Large forested areas extend across the north and east, but forest is also the dominant cover through much of the west and south. Agriculture does not form one continuous plain. Instead, yellow agricultural patches break up the forest in many smaller openings, with a noticeably denser pattern of open land toward the south and southwest.
Agriculture covers 16.37 percent of Stone County and appears as irregular openings within or beside wooded land, especially in the south and southwest. These colors describe land cover—the surface seen in the dataset—not zoning, ownership, parcel use, or development rights. A mapped agricultural cell therefore should not be treated as a legal land-use designation.
Forest and farmland become easier to compare when the legend is simplified
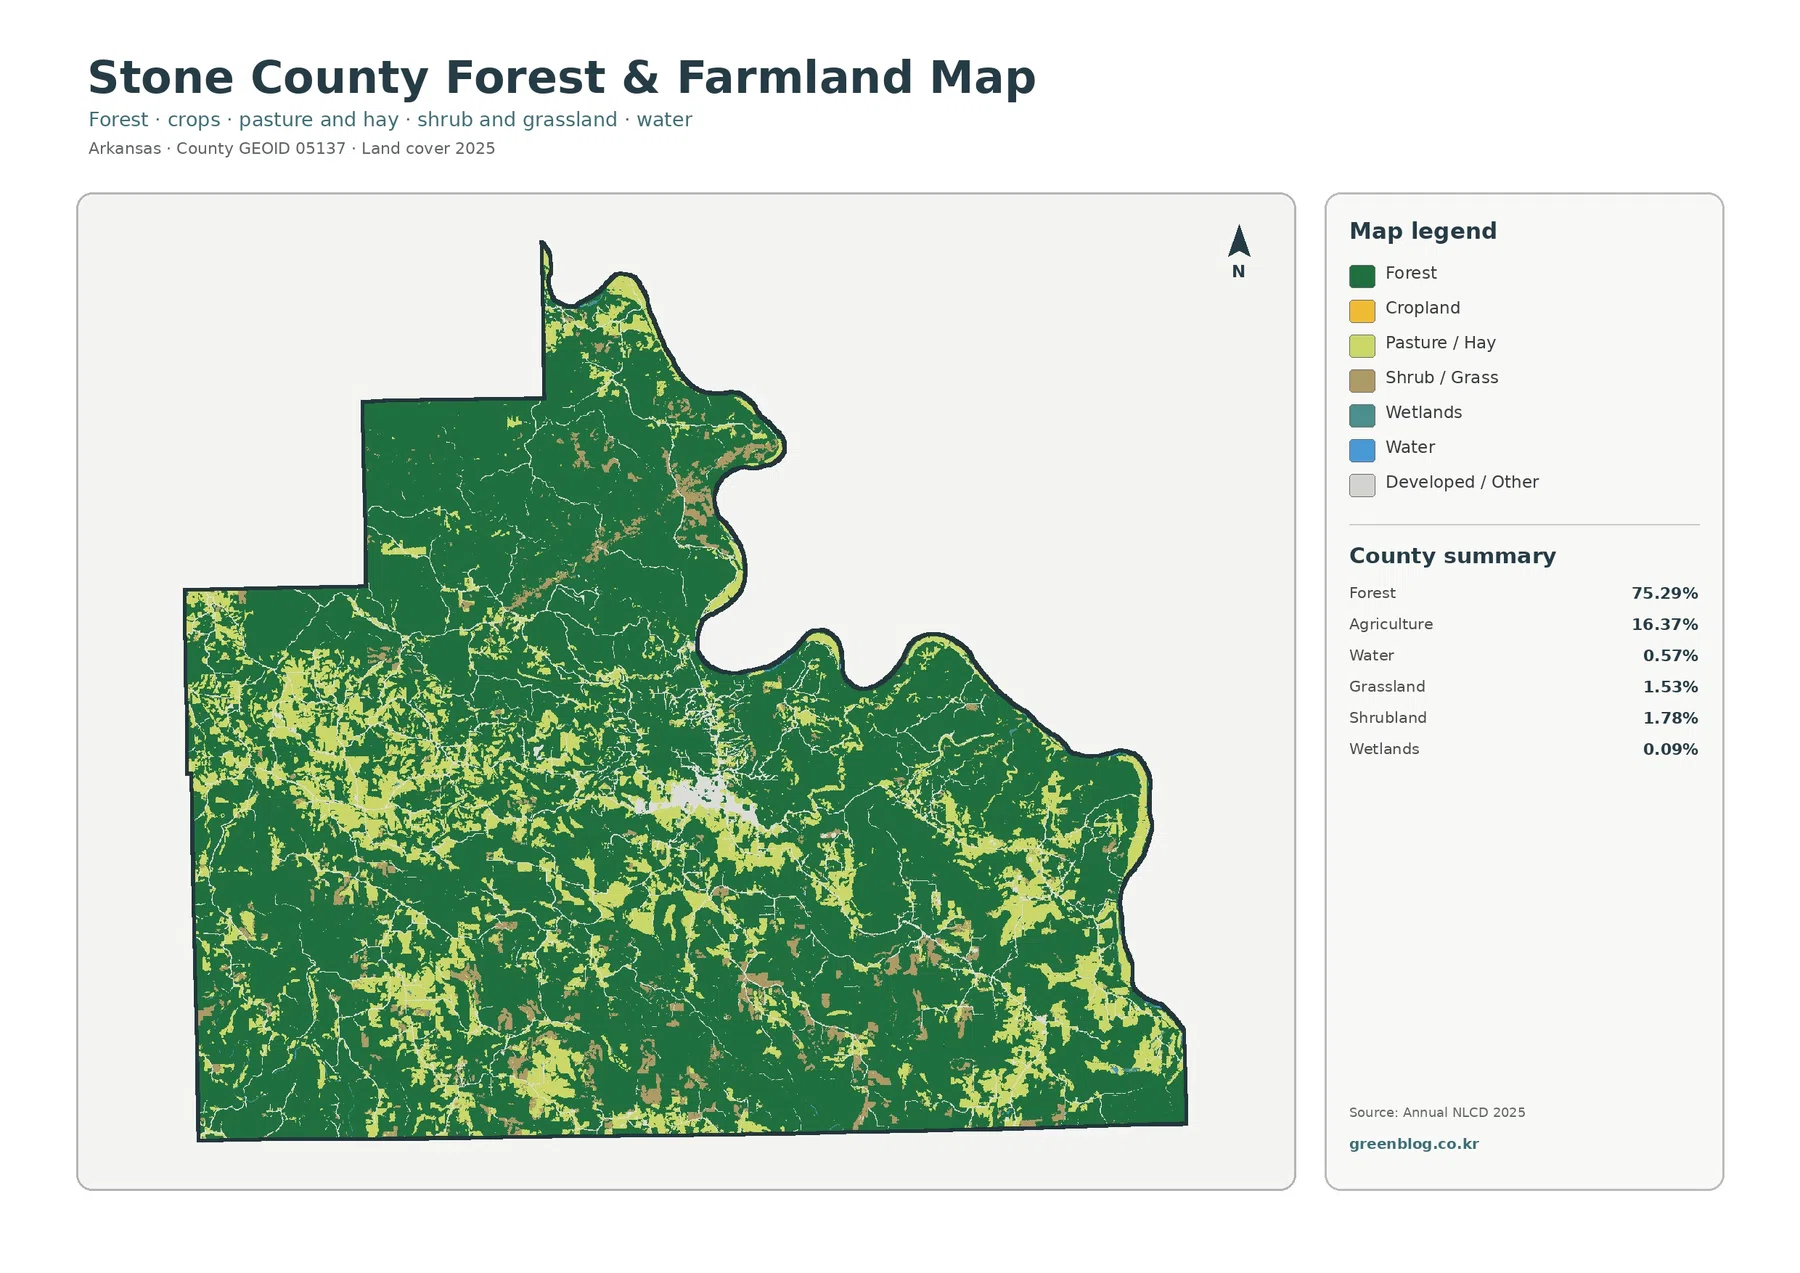
The forest-and-farmland view reduces the visual competition among land-cover classes. Forest remains 75.29 percent and agriculture 16.37 percent, while the supplied summary also lists water at 0.57 percent, grassland at 1.53 percent, shrubland at 1.78 percent, and wetlands at 0.09 percent. With those classes grouped more simply, the southern half reveals many more light agricultural and open patches than the northern half.
The result is not a clean north-south boundary. Forest continues through the south, and agricultural areas continue into the central and western parts of the county. What changes is the frequency of the openings. The north contains broader stretches of uninterrupted green, whereas the south and southwest show a more interwoven pattern of woodland, agriculture, and other open cover. Near the center, the Mountain View area is visible as a separate developed/other concentration inside that larger forest-and-farm matrix.
Local references support the forested setting. The U.S. Forest Service places Sylamore Experimental Forest in Stone County near Mountain View and describes its upland oak-hickory forest. The map does not show that management boundary, but the source gives context for the woodland visible across the county.
Mountain View stands out as a compact developed center
Developed land covers 4.22 percent of Stone County, yet it attracts attention because most of the surrounding county is forested. The largest concentration lies near the center, corresponding to the Mountain View area. From that cluster, thinner developed traces extend outward in several directions. Those narrow features line up with the kind of settlement and road-side development that often appears as linear land cover, but the map does not label roads, so it is better to treat them as visible developed corridors rather than assign specific route names.
Impervious cover is low overall and highly concentrated
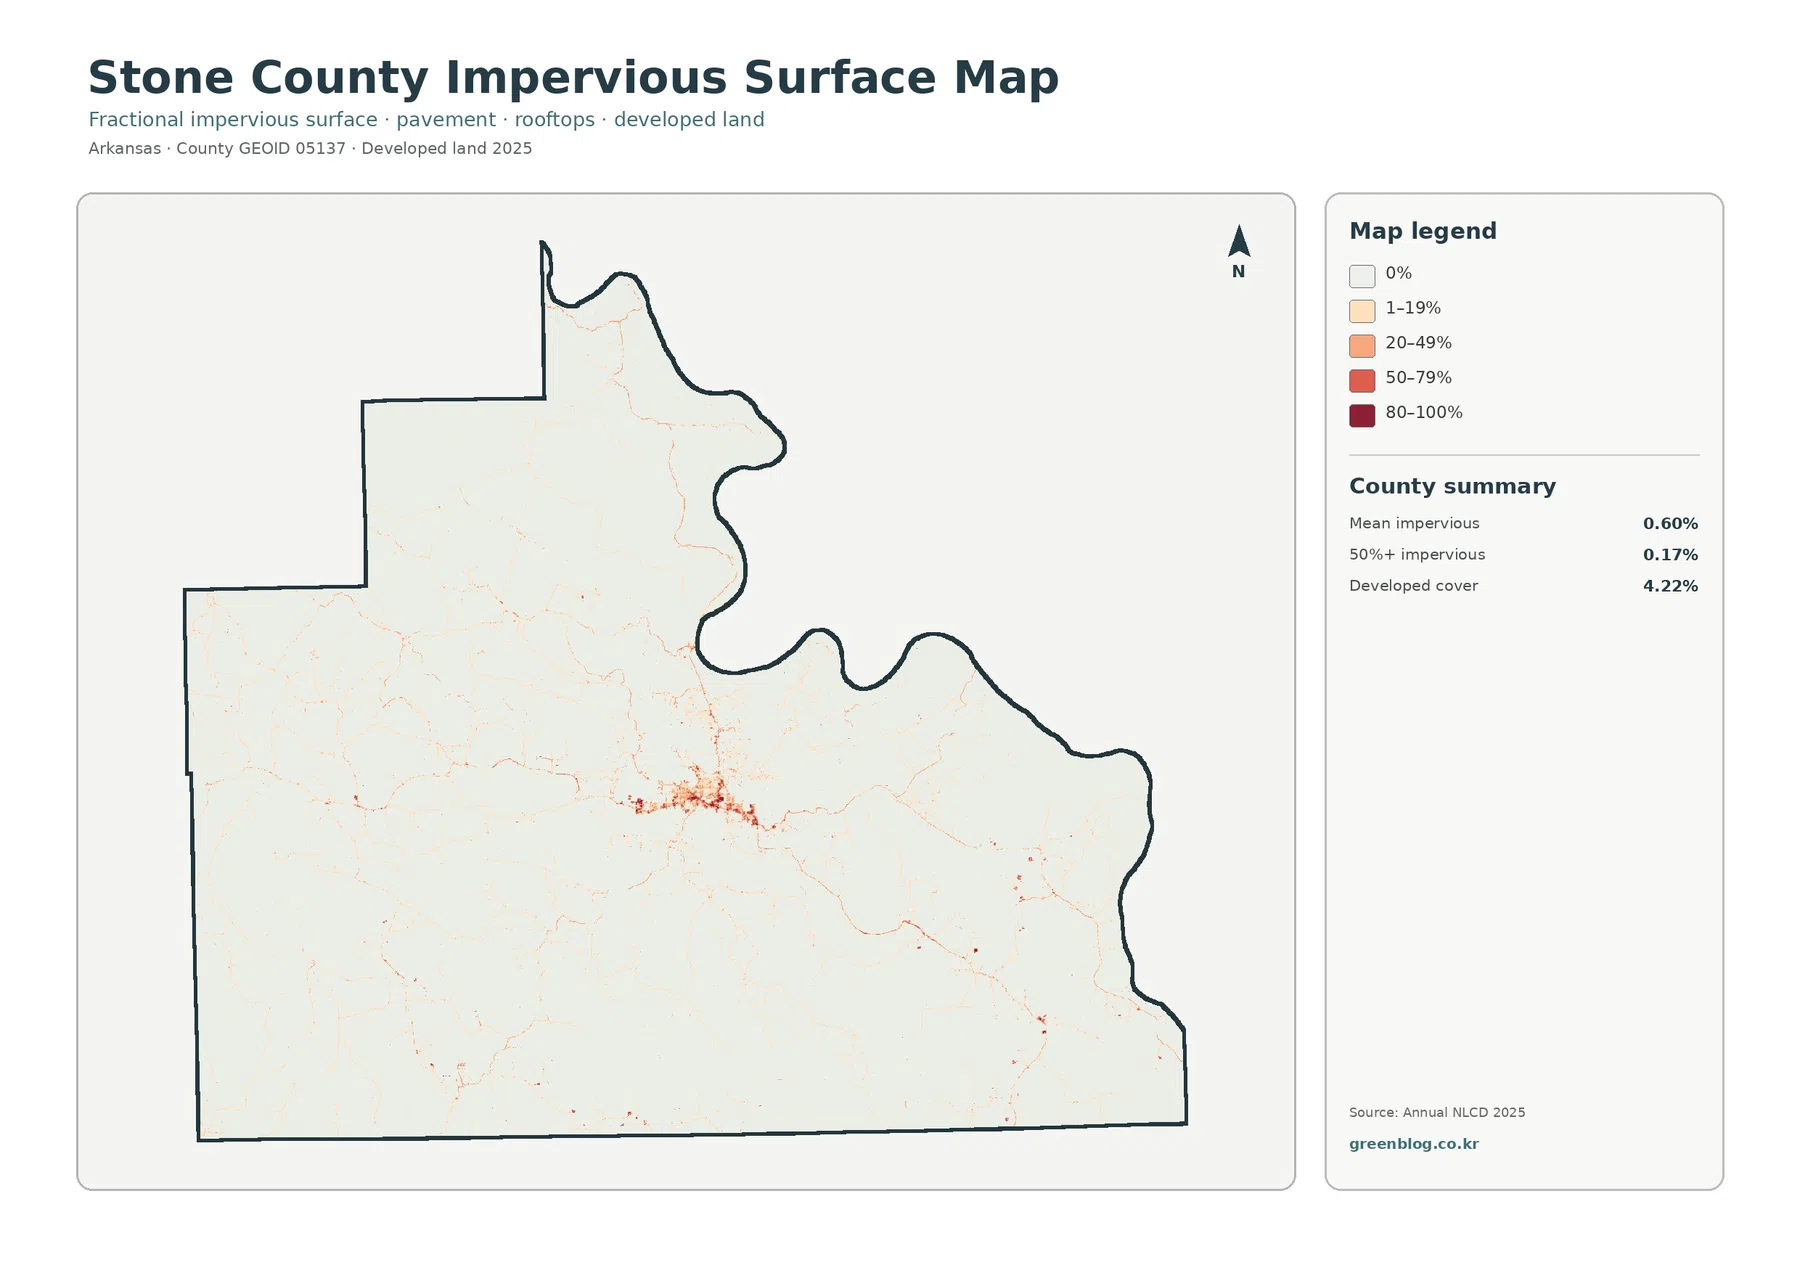
Impervious surface means land where water has difficulty soaking into the ground because of pavement, rooftops, parking areas, and similar hard surfaces. The Stone County impervious map reports a countywide mean of 0.60 percent. Only 0.17 percent of the county falls in the 50-percent-or-greater impervious category. Those numbers are much smaller than the 4.22 percent developed-cover figure because developed land can still contain lawns, trees, bare soil, and other surfaces that are not fully sealed.
Visually, most of the county stays near the lightest category. The strongest orange and red pixels form a compact concentration around the central Mountain View area, with thin traces continuing outward. Smaller isolated marks appear elsewhere, including portions of the south and west, but they do not approach the density of the central cluster. This map therefore gives a more precise picture of where built surfaces are concentrated than the broader developed class alone.
The 1985–2025 map highlights where classifications differ, not a single story of change
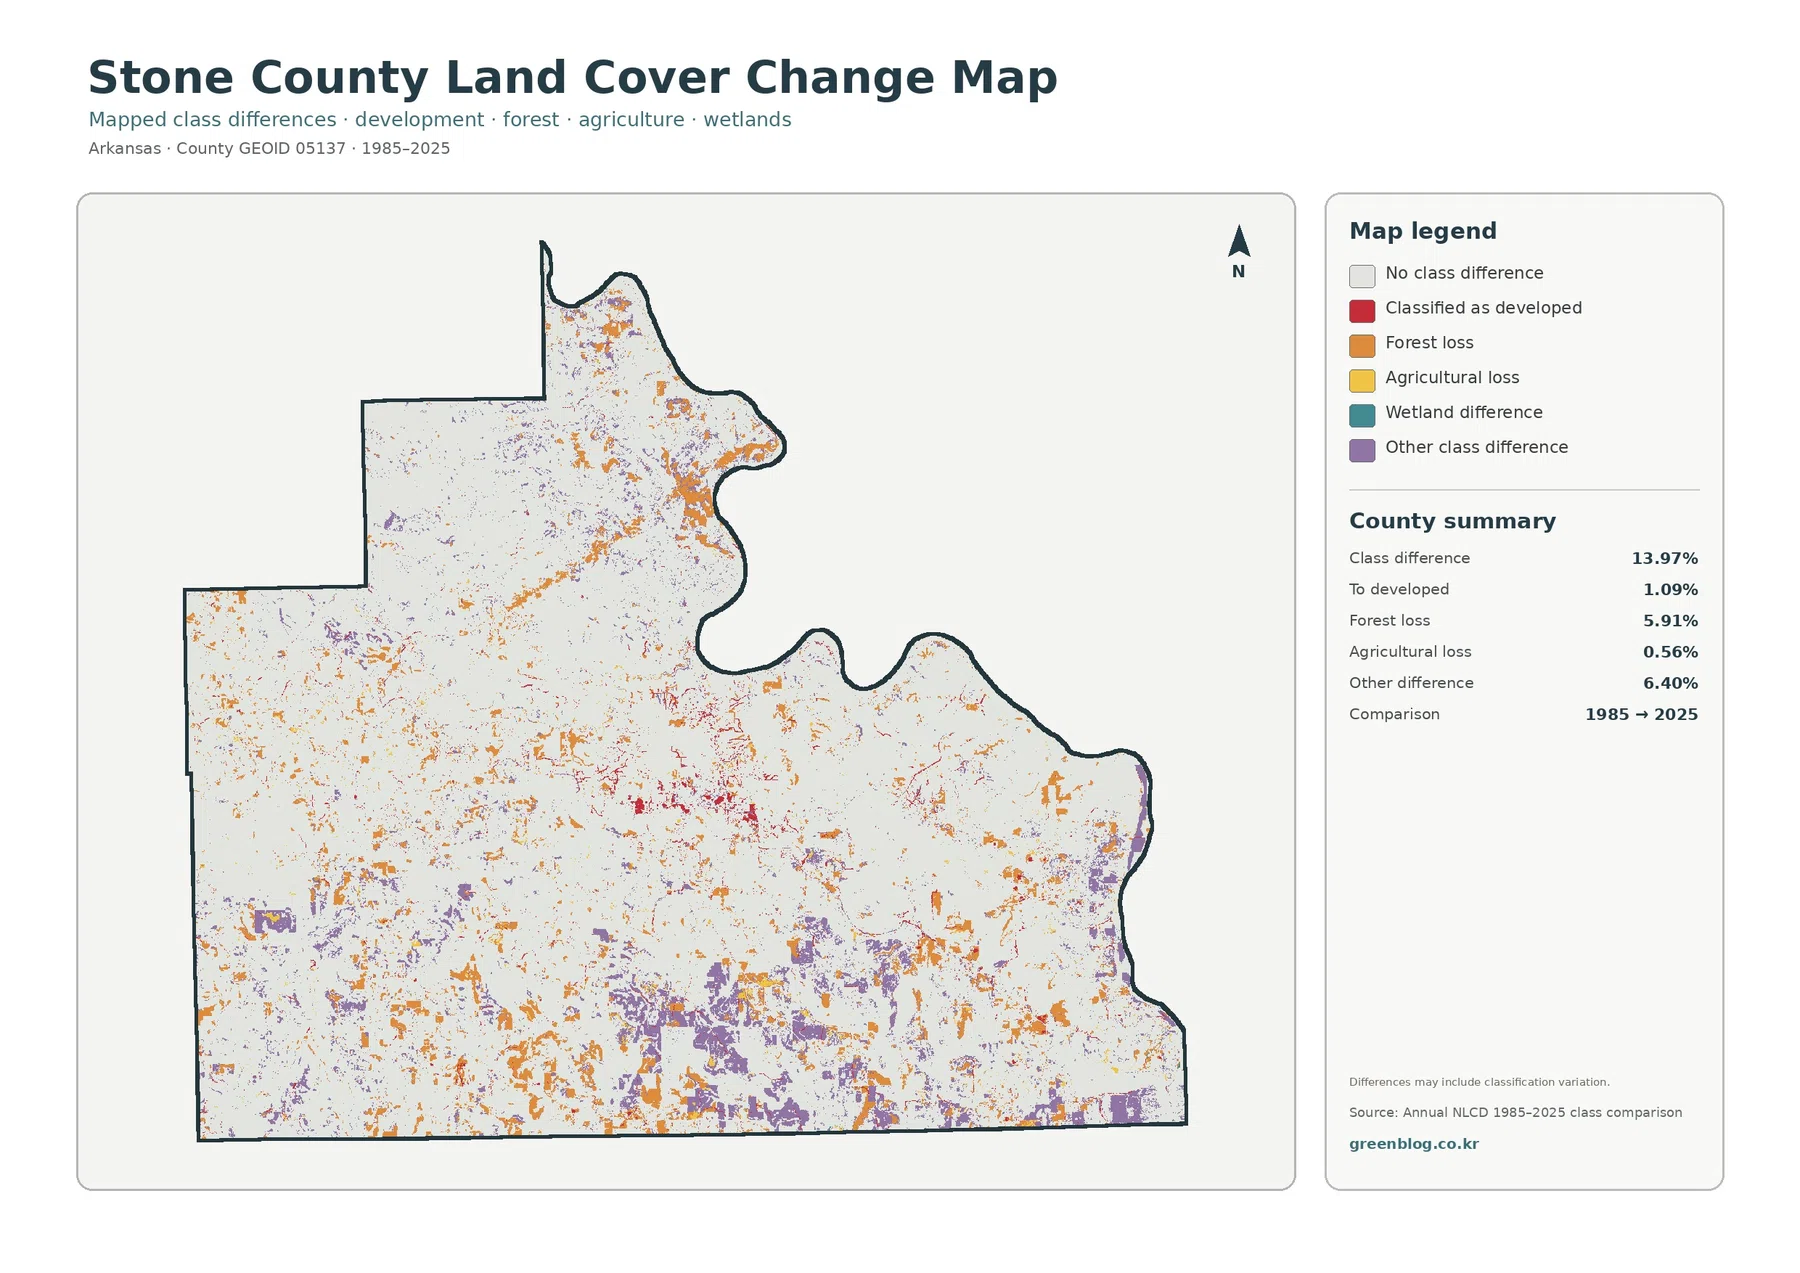
The change map compares mapped classes from 1985 and 2025. Its summary reports class differences across 13.97 percent of Stone County. Within that total, 1.09 percent is marked as classified to developed, 5.91 percent as forest loss, 0.56 percent as agricultural loss, and 6.40 percent as other difference. These categories should not be added to a simple narrative that the county “lost” 13.97 percent of its land; they describe different types of mapped class differences between two dates.
Red developed-change marks are most noticeable in and around the central developed area, where they overlap the location that is already prominent on the current land-cover and impervious maps. Orange forest-loss marks are scattered through many sections, including north-central and eastern parts of the county. Purple other-difference areas become more common in portions of the south and southwest. The distribution is patchy rather than uniform, which is why the change map works best as a locator for areas that deserve a closer look.
Practical uses for printing, teaching, and local comparison
For classroom use, the general land-cover map gives students an immediate visual example of a heavily forested Ozark county. The 75.29 percent forest figure can be paired with the 16.37 percent agriculture share to discuss why land cover varies within a single county. Students can then compare the forest-and-farmland map with a topographic or geologic map to ask where open land is more common, without assuming that the land-cover map alone explains the cause.
Which Stone County map should you use first?
Start with the general land-cover map when you want a quick countywide picture. It answers the basic questions: where forest dominates, where agriculture becomes more common, and where developed land is concentrated. The forest-and-farmland map is better when the main goal is to compare woodland with agricultural or open areas because its simplified legend reduces distractions from smaller classes.
Scale, raster cells, and other limits to keep in mind
Land-cover products such as Annual NLCD are designed to compare broad areas with a consistent classification system. They are raster datasets, meaning the landscape is divided into grid cells and each cell receives a class. A cell can contain more than one real-world surface, especially along roads, field edges, stream corridors, or small clearings. That mixed-pixel effect is one reason boundaries on the map should not be read as parcel lines.
Frequently Asked Questions
What is the dominant land cover in Stone County, Arkansas?
Forest is the dominant 2025 class at 75.29 percent. Agriculture is the second-largest category at 16.37 percent and appears most often as scattered openings within the broader forested landscape.
Which map best shows the Mountain View developed area?
Use the general land-cover map to see the developed area in context, then check the impervious-surface map to narrow the view to places with more pavement, rooftops, and other hard surfaces.
Does every colored pixel on the 1985–2025 change map represent confirmed development or clearing?
No. The change layer can include classification variation as well as real land-cover change. Historical aerial imagery or local records should be used to confirm what happened at a specific location. Map File Information The download combines the four original Stone County JPG maps in one ZIP file. Use the on-page previews for a quick comparison, then download the JPG set when you need larger map graphics for printing, teaching, presentations, or local land-cover reference.
Sources and reference material
- MRLC Annual NLCD Data — Annual NLCD land-cover data.
- USGS Annual NLCD Land Cover Classification — Explains the national land-cover classes.
- University of Arkansas System Division of Agriculture – Stone County — Local Extension information for Stone County communities.
- U.S. Forest Service – Sylamore Experimental Forest — Describes Sylamore forest near Mountain View.
- U.S. Census Bureau TIGER/Line Shapefiles — Official source for county mapping boundaries.
Map File Information
Download the map files associated with this page for reference, printing, and compatible visual projects.
- Included Files: Use only the versions confirmed in the article and supplied images
- File Type: Use the confirmed download contents
- Intended Use: Printing, education, presentations, and map-based projects
Related Maps
- A Craighead County Arkansas Land Cover Map
- Arkansas County Arkansas Land Cover Map
- Ashley County Arkansas Land Cover Map
Green Map creates custom-edited map images using open geographic data sources such as geoBoundaries, Natural Earth, OpenStreetMap, and government open data.
These maps are edited visual materials, not raw data files, and are provided for education, documents, presentations, and graphic reference.