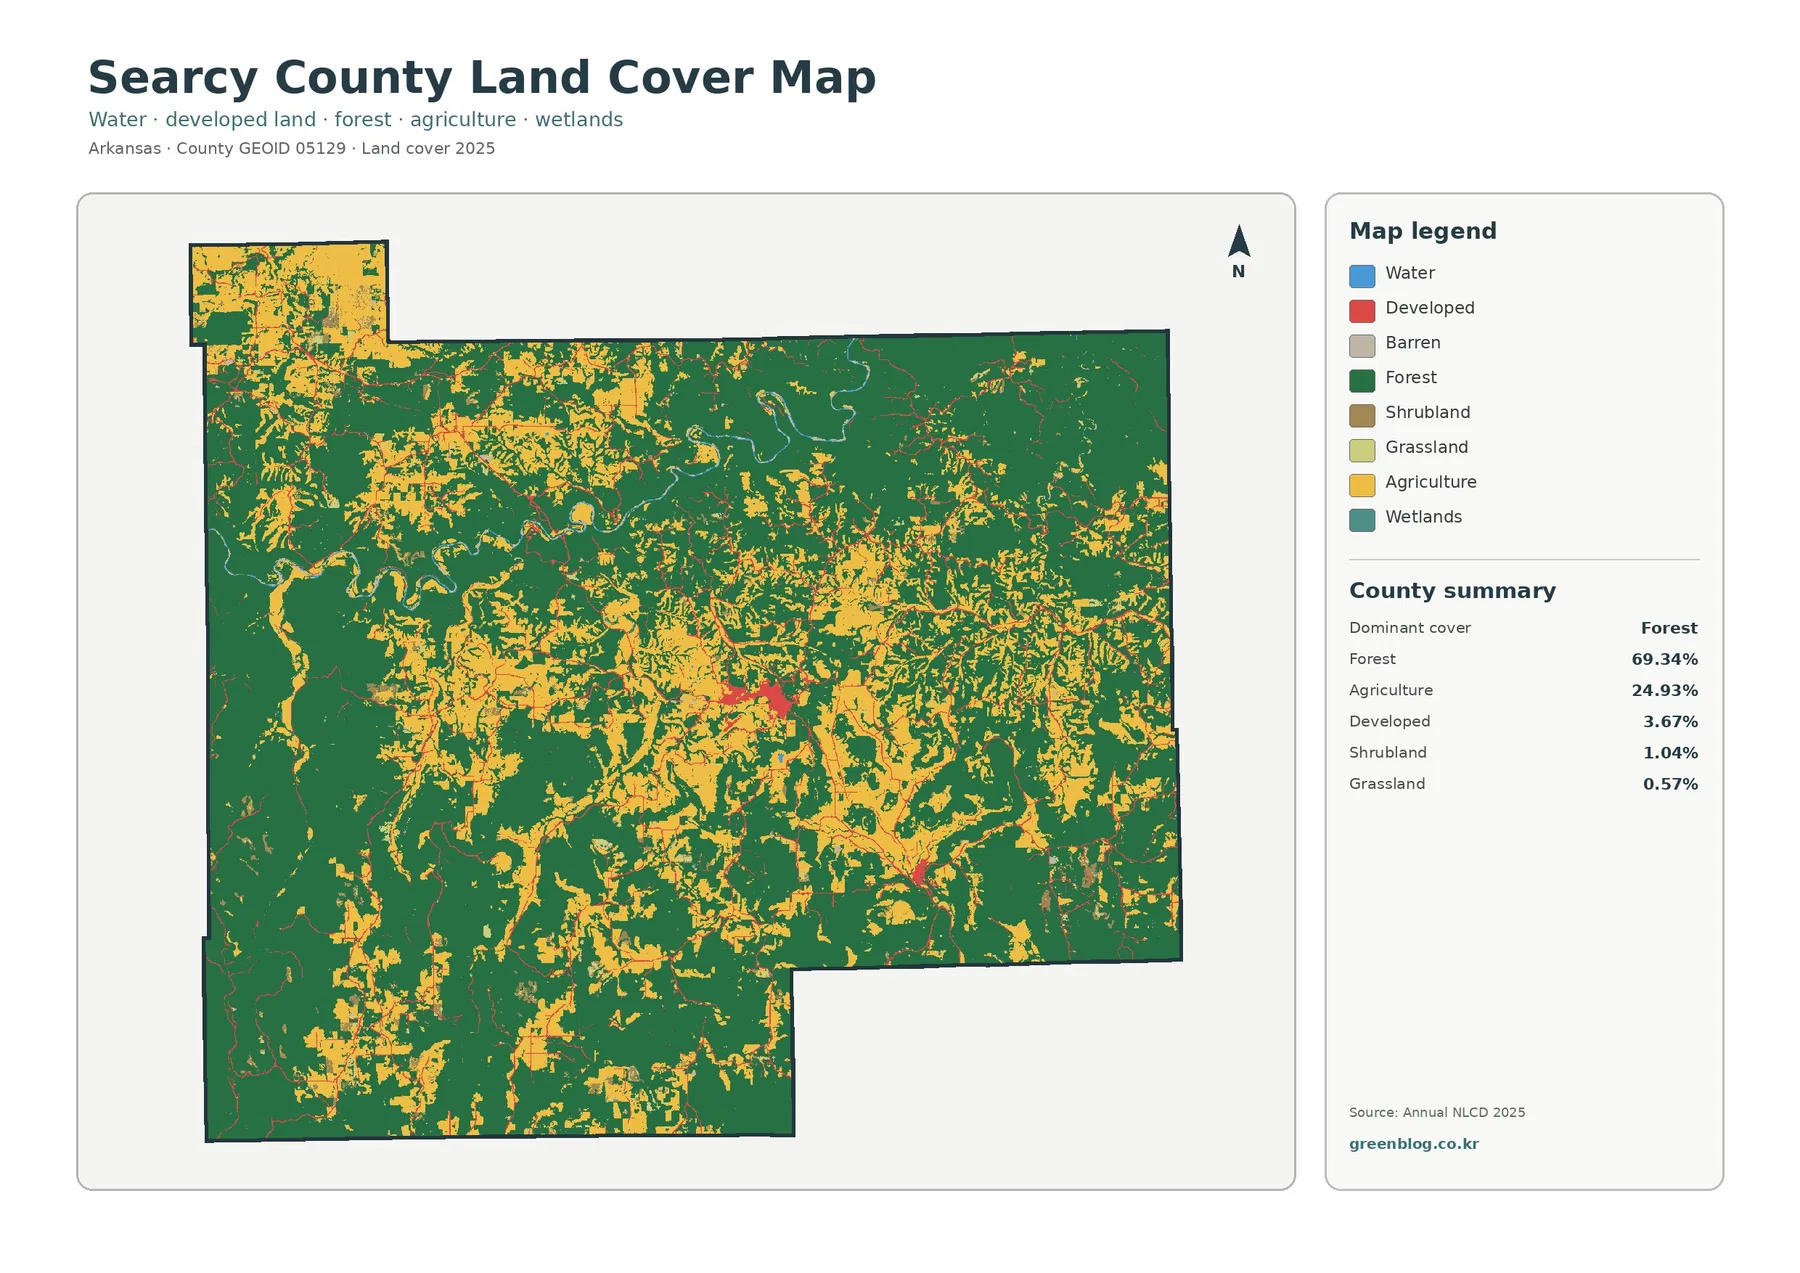
Searcy County’s 2025 land-cover map is dominated by forest, which accounts for 69.34% of the county. Agriculture is still substantial at 24.93%, and it does not sit in one large block. Open agricultural and pasture-like areas cut through the wooded landscape in broad and narrow patches, especially across the central and northwestern portions of the county. Developed land is only 3.67%, yet the compact hard-surface concentration around Marshall stands out clearly against the much larger Ozark forest background.
The page provides four views of the county: general land cover, forest and farmland, impervious surface/developed land, and a 1985–2025 classification comparison. The WebP images are designed for quick reading in the article, while the four original JPG maps are available together in one download below. Land cover describes the physical surface assigned by the classification; it does not establish parcel ownership, zoning, property lines, legal land use, or development rights.
Table of Contents
Searcy County is mostly forest, but its agricultural openings are broad enough to reshape the map
The general 2025 map is green across most of Searcy County, with the largest connected forest areas in the east, southwest, and many parts of the north. The 69.34% forest share is the single strongest statistic in the summary, but the map is more varied than that number suggests. Agricultural cover forms irregular bands and pockets through the middle of the county and into the northwestern extension. Smaller openings also appear in the southeast and along several internal corridors, creating frequent boundaries between woodland and open ground.
Agriculture covers 24.93%, roughly one quarter of the county. Unlike the broad, rectilinear farm patterns visible in many lowland counties, Searcy County’s agricultural color is broken into irregular pieces that expand and narrow between wooded areas. The Association of Arkansas Counties describes the landscape as rugged Ozark Mountains and notes that livestock and timber production remain important locally. The land-cover map does not show elevation or economic activity directly, so those facts should not be treated as an explanation for every mapped patch. They do, however, provide useful county-specific context for a landscape in which forest and rural open ground are closely interwoven.
Developed land accounts for 3.67%. Its largest red cluster lies around Marshall near the middle of the county, while smaller developed traces appear along linear routes and at scattered settlement points. Shrubland is 1.04% and grassland 0.57%, both small shares that are easiest to notice around the margins of larger forest and agricultural areas. These minor classes matter because they soften what would otherwise look like a simple two-class landscape of forest and agriculture.
Water is mapped at only 0.17% and wetlands at 0.04%. Those small percentages should not be confused with local importance. Official county material and the Association of Arkansas Counties both identify the Buffalo National River as a major feature of Searcy County. A river can be narrow in area while still shaping recreation, scenery, and nearby land patterns. Countywide percentages measure surface area, not the significance of a feature to residents or visitors.
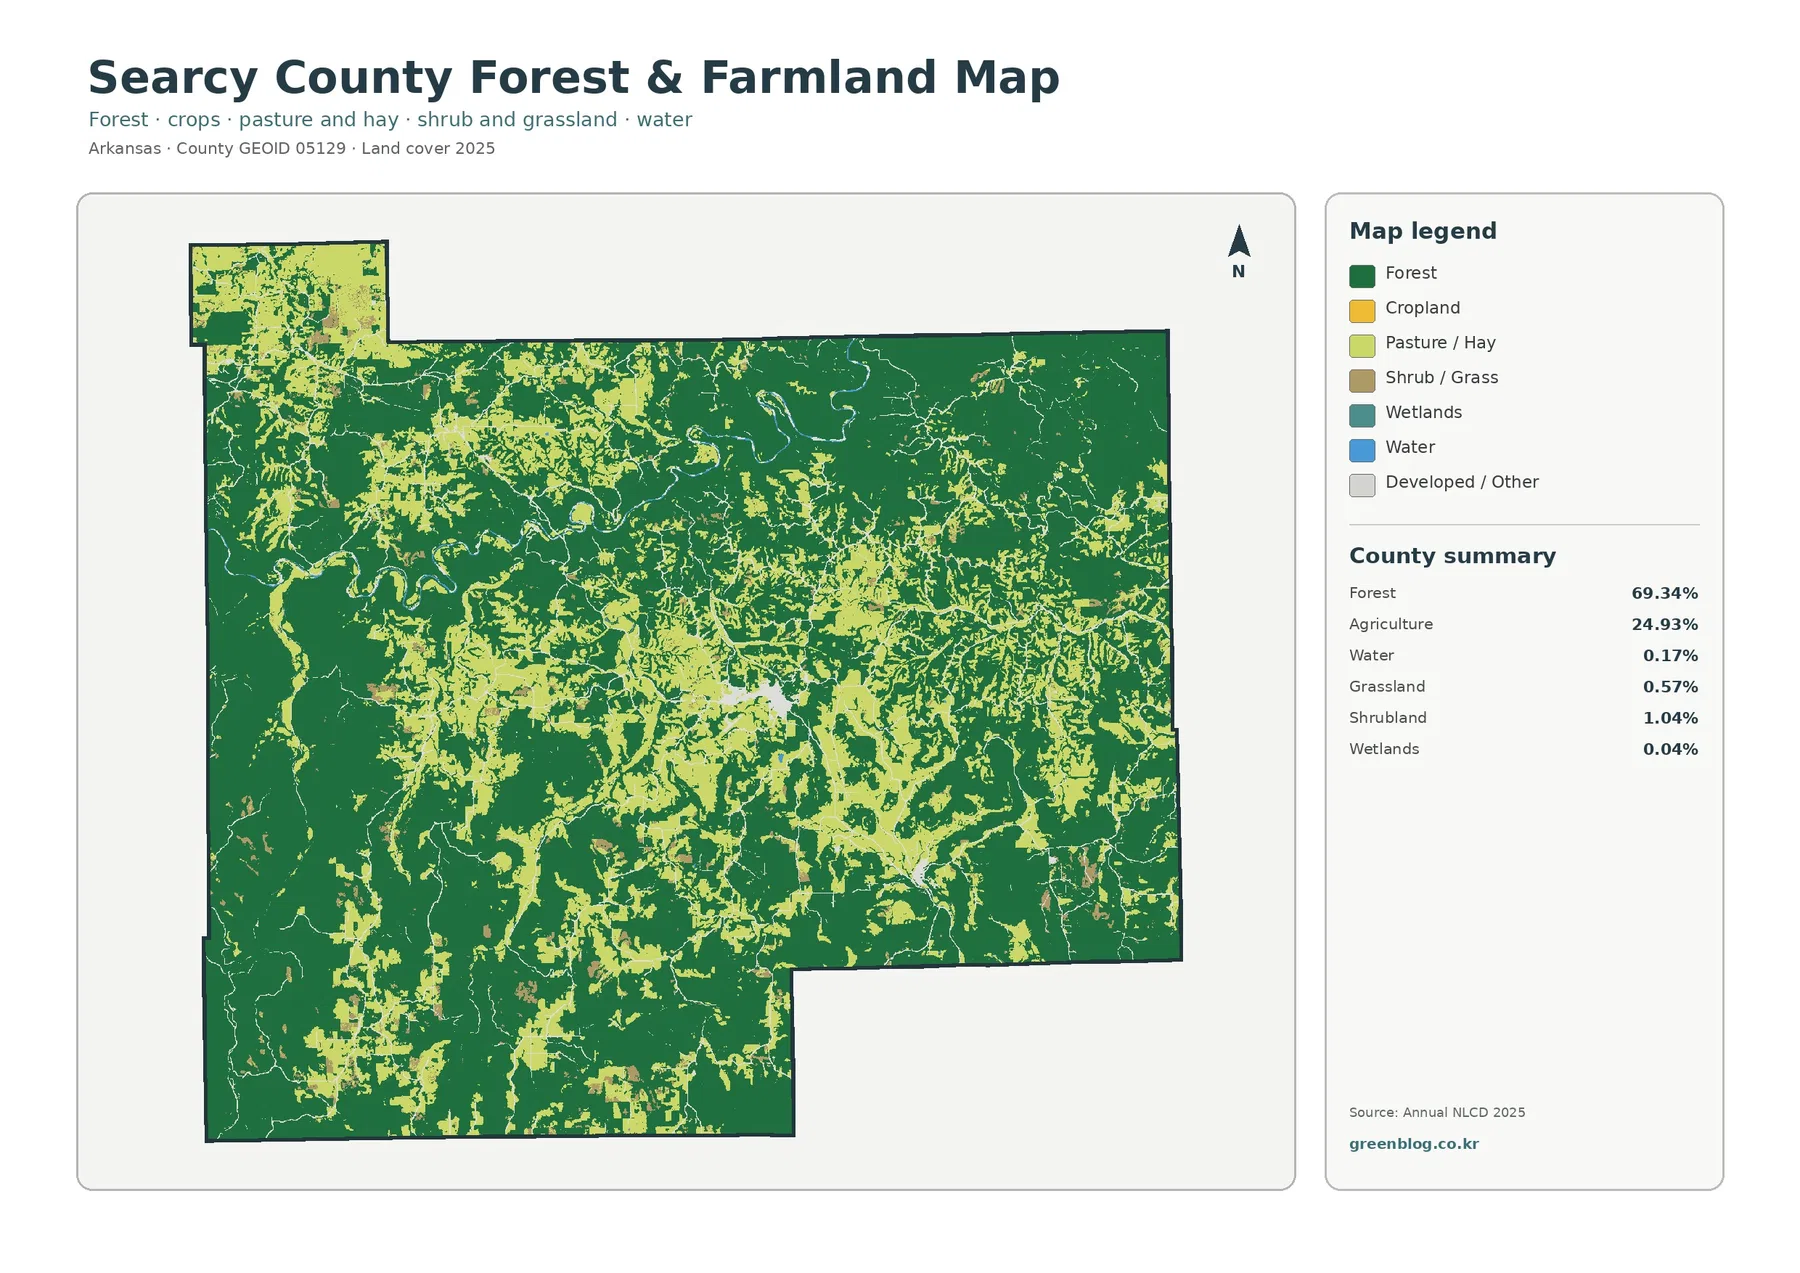
The forest-and-farmland view reveals where open rural land interrupts the Ozark woodland
The forest-and-farmland map reduces the visual competition from developed classes and puts the relationship between forest, agriculture, pasture or hay, shrub and grass cover, wetlands, and water at the center of the image. Forest remains dominant, but the 24.93% agricultural share becomes easier to follow across the county. Broad open zones appear in the central area and northwest, then break into smaller pieces toward other parts of the map. The result is not a neat border between forest and farmland; it is a repeating edge where the two covers meet, separate, and meet again.
That repeated edge is one of the most useful county-specific features in the map set. A person comparing Searcy County with a Delta farming county would see a major difference immediately. Here, open ground is embedded within extensive forest rather than replacing it across one continuous plain. The map is therefore useful for identifying where large wooded blocks remain intact and where agricultural or pasture-like openings are frequent enough to create a more mixed rural landscape.
Searcy County’s official and county-association pages emphasize the Ozark setting, Marshall as the county seat, and the Buffalo National River crossing the county. The preview itself does not label elevations, valleys, fields, or individual waterways, so a specific bright patch should not be assigned to a named farm or valley without another reference map. The safe interpretation is broader: forest covers most directions, open rural cover is most visible in several connected interior zones, and the county contains far more edge between woodland and open ground than the forest percentage alone would suggest.
The 0.17% water share is especially instructive in a county associated with the Buffalo National River. Narrow rivers can occupy little area in a 30-meter raster while still being prominent on the ground. Small channels, riparian vegetation, and mixed river-edge cells can also be generalized into adjacent classes. For exact river width, stream location, access points, or floodplain boundaries, a hydrography or topographic source is more appropriate than this land-cover layer.
Marshall forms a small impervious center in a county where hard surfaces are exceptionally sparse
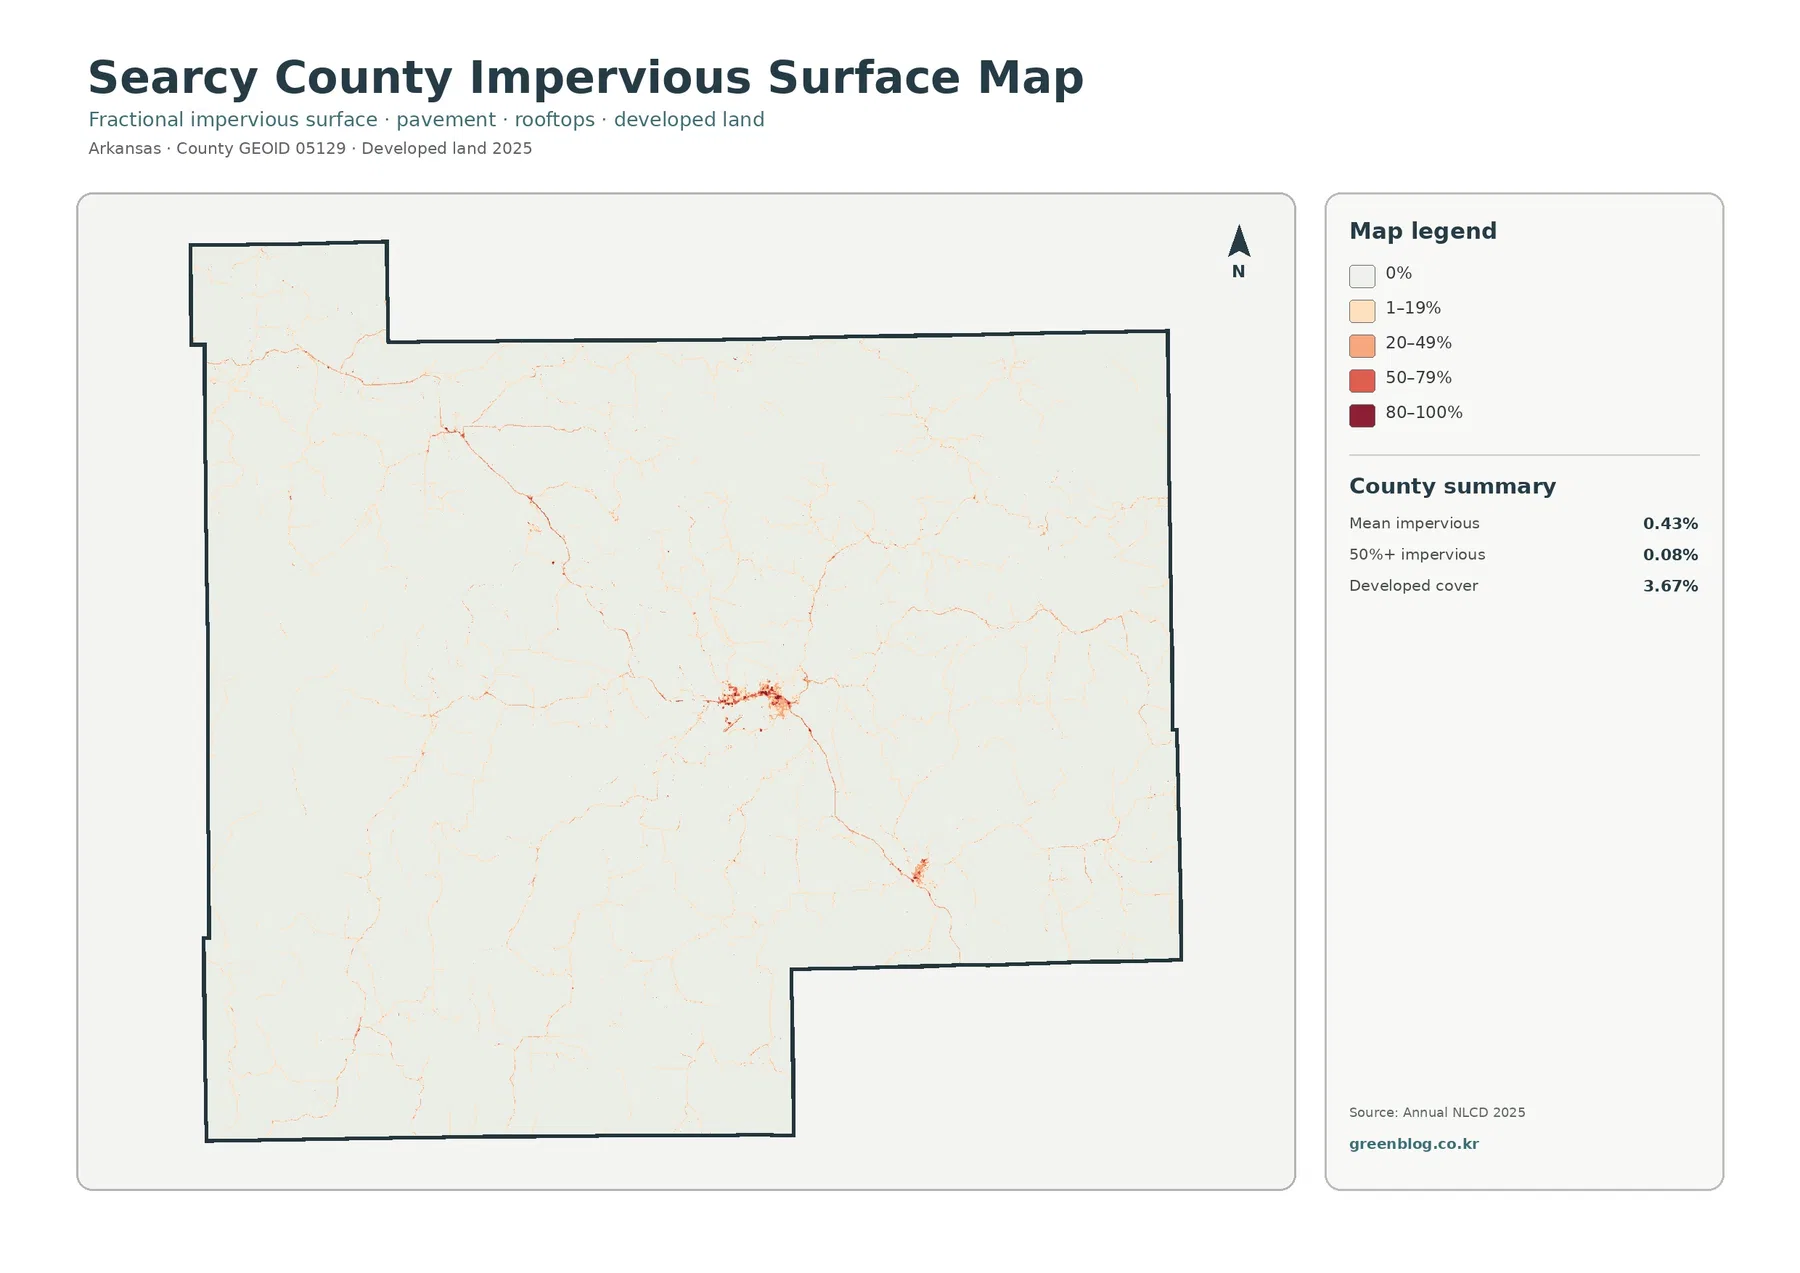
Impervious surface means hard ground such as rooftops, pavement, and parking areas that allows little water to soak into the soil. Searcy County’s mean impervious value is 0.43%, and only 0.08% of the county is mapped at 50% or greater imperviousness. Those values are much lower than the 3.67% developed-land share because a developed land-cover class can still contain lawns, trees, bare soil, and other permeable surfaces around buildings and roads. The two measurements describe related but different aspects of the built environment.
The strongest impervious cluster appears around Marshall in the central part of the county. The Association of Arkansas Counties identifies Marshall as the county seat, and the map makes that main settlement footprint easy to distinguish from the surrounding low-impervious landscape. Fainter linear traces extend away from the center and a smaller concentration appears farther southeast, but most of Searcy County remains white or nearly white. The pattern is consistent with a rural county where hard surface is concentrated in small communities and transportation corridors rather than spread across a broad urban field.
The Greater Searcy County Chamber describes the county as being on the U.S. 65 corridor. A noticeable linear impervious trace passes through the central settlement area, but the preview does not label individual roads, so it should not be treated as a road-identification map by itself. Used alongside a transportation map, however, the impervious layer can help show where pavement and buildings cluster near major routes and where those hard surfaces quickly give way to forest and rural open land.
A countywide mean of 0.43% also should not be applied to every location. Individual cells in Marshall can have far higher impervious percentages, while large forest and agricultural areas are close to zero. The map is useful for relative built-surface intensity, not for deciding whether a site has adequate drainage or whether it is prone to flooding. Those questions require terrain, soils, rainfall, stream networks, and infrastructure information that is outside this layer.
The 1985–2025 comparison marks 8.88% class difference, led by scattered forest-loss cells
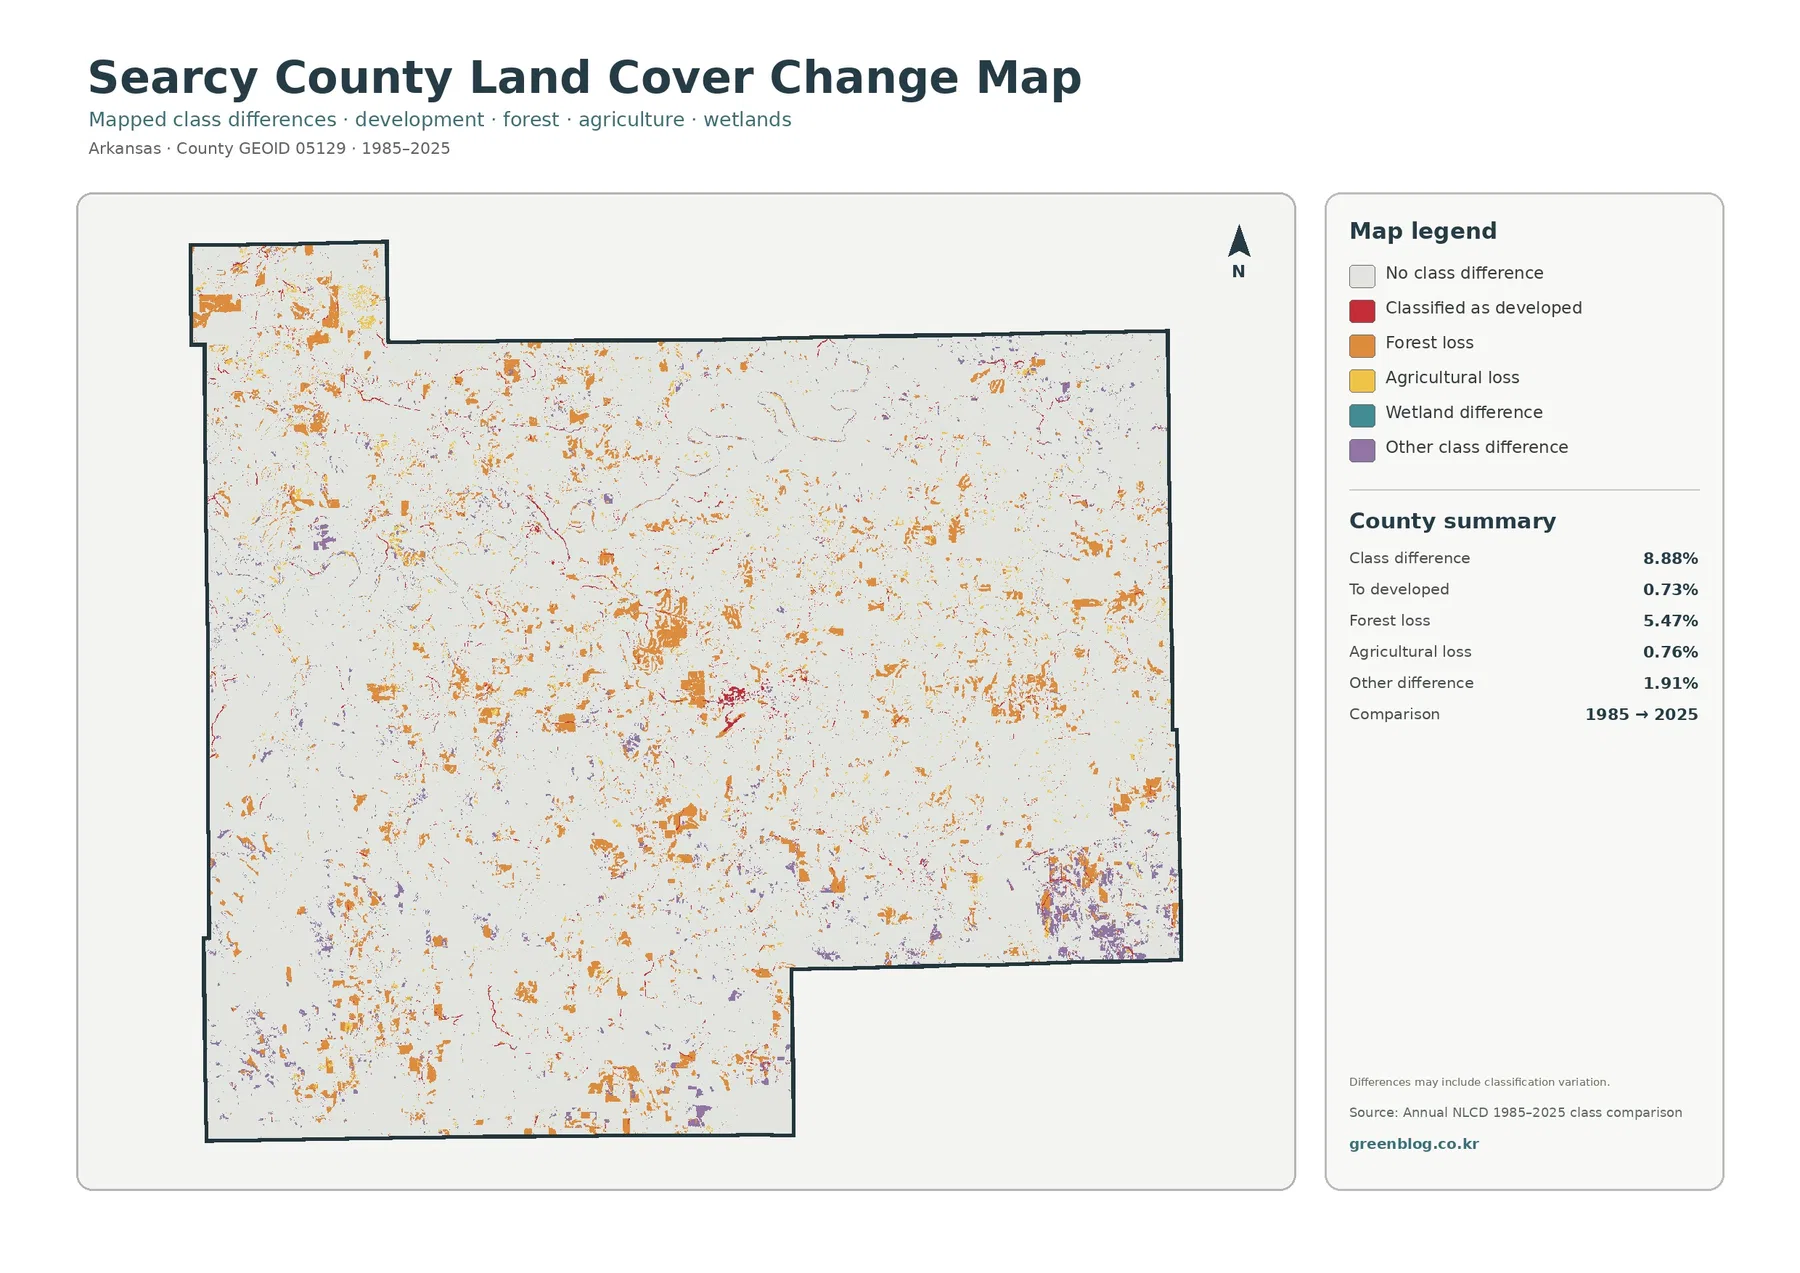
The change map compares broad land-cover classes from 1985 and 2025. Its county summary reports class differences across 8.88% of Searcy County. Forest loss is the largest named category at 5.47%. Cells classified to developed account for 0.73%, agricultural loss for 0.76%, and other class difference for 1.91%. Most of the map remains in the no-class-difference background, but the colored cells are spread widely enough that change is visible in many separate parts of the county.
Orange forest-loss patches appear in the northwest, central area, east, and south rather than forming one continuous clearing. Red cells classified to developed are more concentrated near Marshall and selected linear traces. Agricultural-loss colors occur in smaller fragments around open ground, while purple other-difference cells become particularly noticeable in the southeastern part of the map. That mixture is important: the change layer does not support a simple story in which one process affected the entire county in the same way.
The map itself warns that the differences can include classification variation. A cell can change class because the surface truly changed, but vegetation condition, moisture, image timing, mixed pixels, and classification rules can also contribute. This matters along forest edges, narrow river corridors, and rural openings where several surfaces may occur inside a single 30-meter cell. The 8.88% value therefore should not be read as a parcel-level land-use conversion rate.
For research or planning, the change map works best as a screening tool. A forest-loss patch can identify a place worth checking in dated aerial imagery, but it does not prove timber harvest, permanent clearing, or a legal land-use change. A red developed cell can indicate a stronger built classification in 2025 without revealing when a road or building was constructed. Comparing the change layer with the current 2025 map keeps those two questions separate: what the surface looks like now and where the broad classes differed between the two dates.
Use the four maps as a sequence: current cover, rural mix, hard surfaces, then change
The general land-cover map is the best first image when you need a countywide summary. It combines the 69.34% forest share, 24.93% agriculture, the Marshall developed cluster, and the small water and wetland classes in one view. The forest-and-farmland map is better for tracing the irregular open areas inside the woodland. It removes some of the built-class detail and makes the boundaries between wooded and rural open cover easier to follow.
The impervious map answers a different question: where are pavement, rooftops, and other hard surfaces concentrated? In Searcy County, that question leads quickly to Marshall and a few thin corridors. The change map should come after the current maps, because a colored difference is easier to interpret when you already know whether the surrounding 2025 landscape is forest, agriculture, or developed cover. Placing the maps side by side prevents a small percentage from being mistaken for a countywide condition.
The Buffalo National River context is also a reminder that percentages alone cannot describe the county. Water covers only 0.17% in the supplied summary, yet the river is one of the county’s defining natural features. Developed land is 3.67%, but the impervious map shows that hard surfaces are concentrated rather than widespread. Forest is 69.34%, but substantial agricultural openings break through it in several parts of the county. Reading location together with percentage produces a much more useful picture than ranking the classes alone.
A 30-meter classification is strong for countywide patterns but simplifies roads, river edges, and small parcels
Annual NLCD is a raster land-cover dataset commonly organized in 30-meter cells. That scale is useful for comparing large patterns, but a single cell can contain trees, grass, pavement, a structure, and water at the same time and still receive one dominant class. In Searcy County, narrow roads, small settlements, field edges, and the Buffalo River corridor can therefore look wider, narrower, or less detailed than they do in aerial imagery.
This map set should not be used as a parcel survey. It does not establish property ownership, legal boundaries, zoning, building rights, agricultural acreage for a specific farm, or the exact edge of a river. Those tasks require purpose-built cadastral, planning, survey, or hydrographic data. The strength of the land-cover maps is county-scale comparison: they quickly show where forest is extensive, where open rural cover is common, where hard surfaces cluster, and where broad classifications differ between years.
The current maps use the supplied 2025 classification, while the change map compares 1985 with 2025. Logging, forest regrowth, agricultural shifts, road work, or new construction after 2025 will not appear in these images. When a current site-level answer matters, check for newer Annual NLCD releases and compare them with recent aerial photography or local records. The maps on this page are most useful as a reliable overview and as a starting point for more detailed investigation.
Frequently Asked Questions
Why does Searcy County look heavily forested even though agriculture covers 24.93%?
Forest is the dominant 2025 class at 69.34%, but agriculture is concentrated in broad, irregular openings through the central and northwestern parts of the county instead of being evenly spread. Those open zones create many visible edges inside the larger forest landscape.
What does the 0.43% mean impervious value tell us about Marshall?
Hard surfaces are very sparse across Searcy County overall, but the strongest impervious values cluster around Marshall. Only 0.08% of the county is mapped at 50% or greater imperviousness, so the main built footprint is compact rather than countywide.
Why is mapped water only 0.17% when the Buffalo National River crosses Searcy County?
The percentage measures area, not local importance. A river can be narrow compared with the full county, and 30-meter classification can generalize small channels and river-edge cells. The Buffalo National River can therefore be a defining county feature while water still occupies a small mapped share.
Sources and reference material
- MRLC Annual NLCD Data – current and annual land-cover dataset reference
- USGS Annual NLCD Land Cover Classification – class definitions and interpretation
- U.S. Census Bureau TIGER/Line Shapefiles – Searcy County boundary reference
- Searcy County, Arkansas Official Website – county context for the Ozarks and Buffalo National River
- Association of Arkansas Counties – Searcy County – Marshall, Ozark Mountains, Buffalo National River, livestock and timber context
- Greater Searcy County Chamber of Commerce – local U.S. 65 corridor and county background
Map File Information
The four original Searcy County maps shown on this page are packaged in one ZIP file. The JPG files are larger than the in-page previews and work well for printing, classroom reference, presentation graphics, and side-by-side comparisons with other counties.
- Included Files: Use only the versions confirmed in the article and supplied images
- File Type: Use the confirmed download contents
- Intended Use: Printing, education, presentations, and map-based projects
Related Maps
- A Craighead County Arkansas Land Cover Map
- Arkansas County Arkansas Land Cover Map
- Ashley County Arkansas Land Cover Map
Green Map creates custom-edited map images using open geographic data sources such as geoBoundaries, Natural Earth, OpenStreetMap, and government open data.
These maps are edited visual materials, not raw data files, and are provided for education, documents, presentations, and graphic reference.