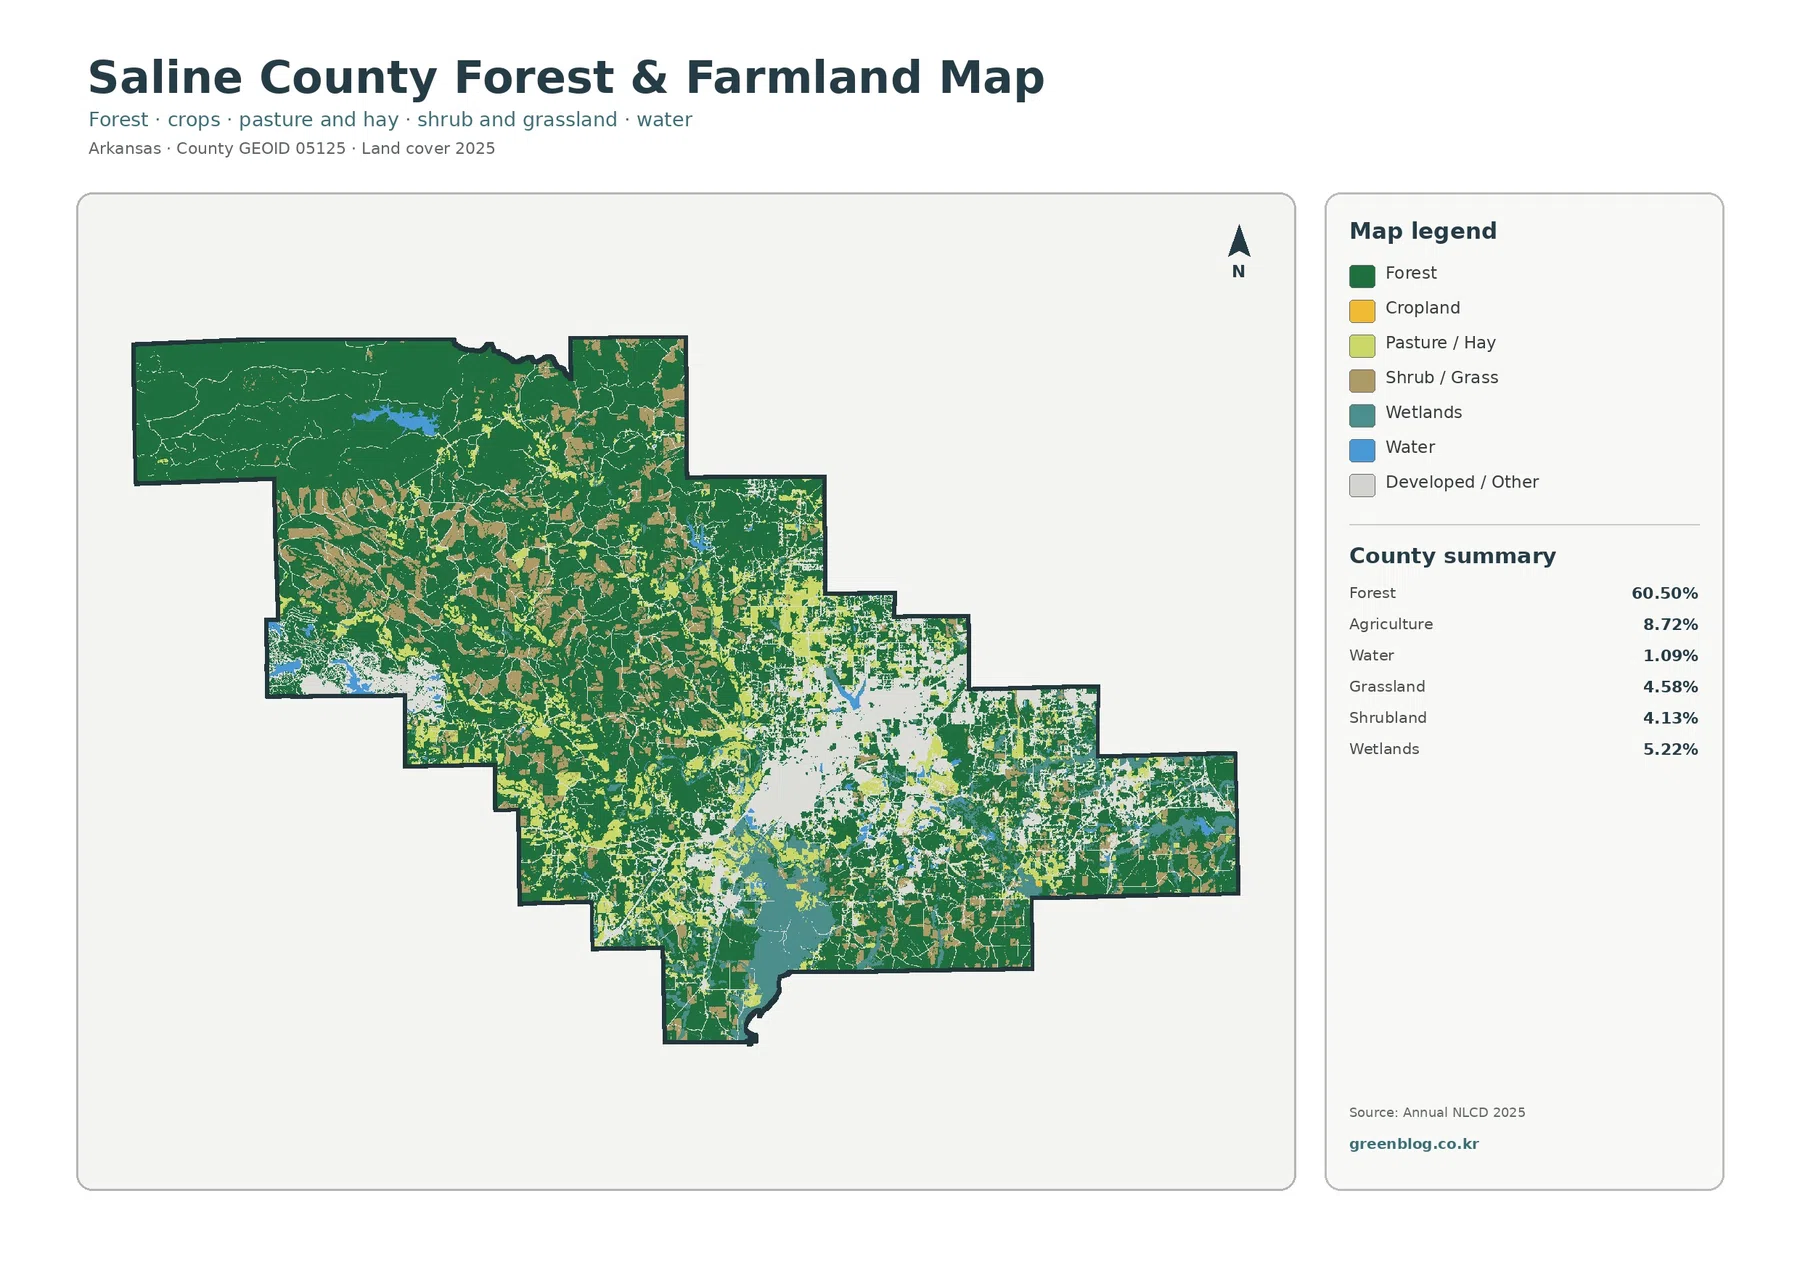
Saline County sits in central Arkansas, and its 2025 land-cover pattern is defined by a strong contrast between a heavily forested western half and a much more developed eastern side. Forest accounts for 60.50% of the county, while developed land reaches 14.82%. Around the Benton–Bryant area, built-up classes form the largest continuous urban cluster on the map. Farther west, the same red developed colors break into small patches and narrow lines within a landscape that remains mostly wooded.
This page brings together four views of that pattern: current land cover, forest and farmland, impervious surface, and a 1985–2025 class comparison. The WebP images are intended for quick reading in the article, and the four original JPG maps are available together in one download below. Land cover describes what is physically on the ground—forest, crops, grass, water, wetlands, or developed surfaces. It does not show parcel ownership, zoning, legal land use, or whether a site can be developed.
Table of Contents
A forest majority does not make Saline County visually uniform
The general 2025 map is useful because it shows where the county’s dominant class actually occurs. Dark green forest covers broad areas along the west and northwest and remains common through much of the center. Moving east, the map becomes more varied. Developed land expands into a large red concentration, agriculture and grassland appear more often, and wetland colors become more noticeable in the southern and eastern portions. The countywide percentages therefore describe the total area, but the map explains how those classes are separated and mixed across the county.
After forest, developed land is the largest category at 14.82%. The strongest concentration lies in the east-central part of the county, where Benton and Bryant provide a useful geographic reference for the urbanized area. The University of Arkansas Cooperative Extension maintains its Saline County office in Benton and lists programs and community projects in both Benton and Bryant. That official local context helps identify the county’s eastern population center, although the land-cover colors should not be treated as municipal boundaries. A developed pixel can include low-density residential land as well as more intensely built surfaces.
The forest-and-farmland view separates wooded country from smaller open areas
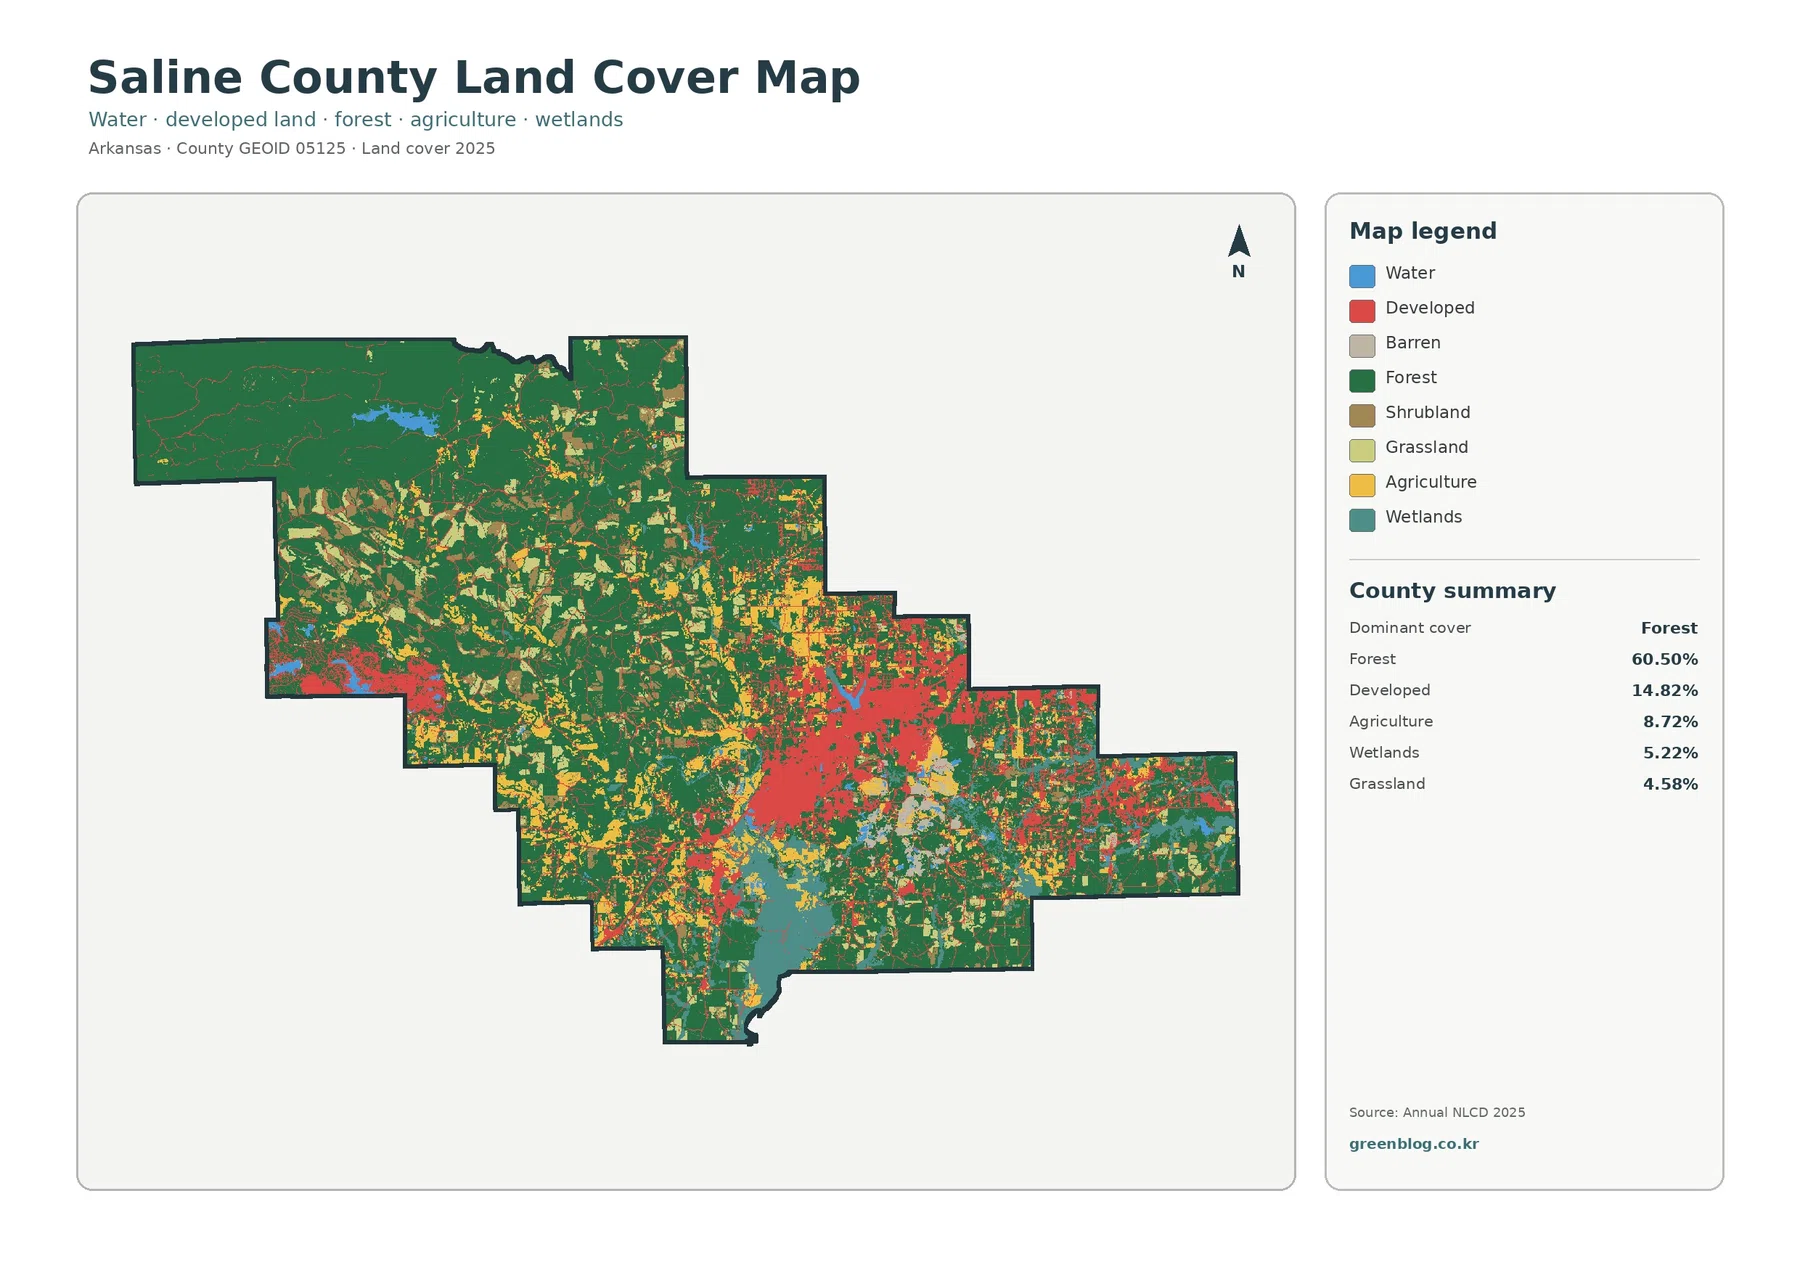
Removing much of the detail associated with developed classes makes the west-to-east difference easier to follow. Forest remains broad and connected across the western side. Closer to the center, openings of cropland, pasture or hay, shrub/grass, and wetlands interrupt the green. The eastern side contains more developed/other land, but the simplified map also reveals that agriculture and open vegetation continue around and between developed areas. Saline County is therefore not simply divided into “forest” and “city”; several transitional land-cover types occupy the space between those two broad settings.
The map summary places agriculture at 8.72%, grassland at 4.58%, and shrubland at 4.13%. Those values are especially useful when reading the many light-colored openings scattered through the forest. The Saline County Cooperative Extension program includes livestock and forage education, soil and forage testing, pasture management, horticulture, and small-farm services. Those programs confirm that agricultural and managed open-land activities are part of the local landscape. They do not, however, identify what is growing in any particular mapped cell, so a yellow or green agricultural patch should not be labeled as a specific crop without another source.
Impervious surface pinpoints the built core more precisely than developed land alone
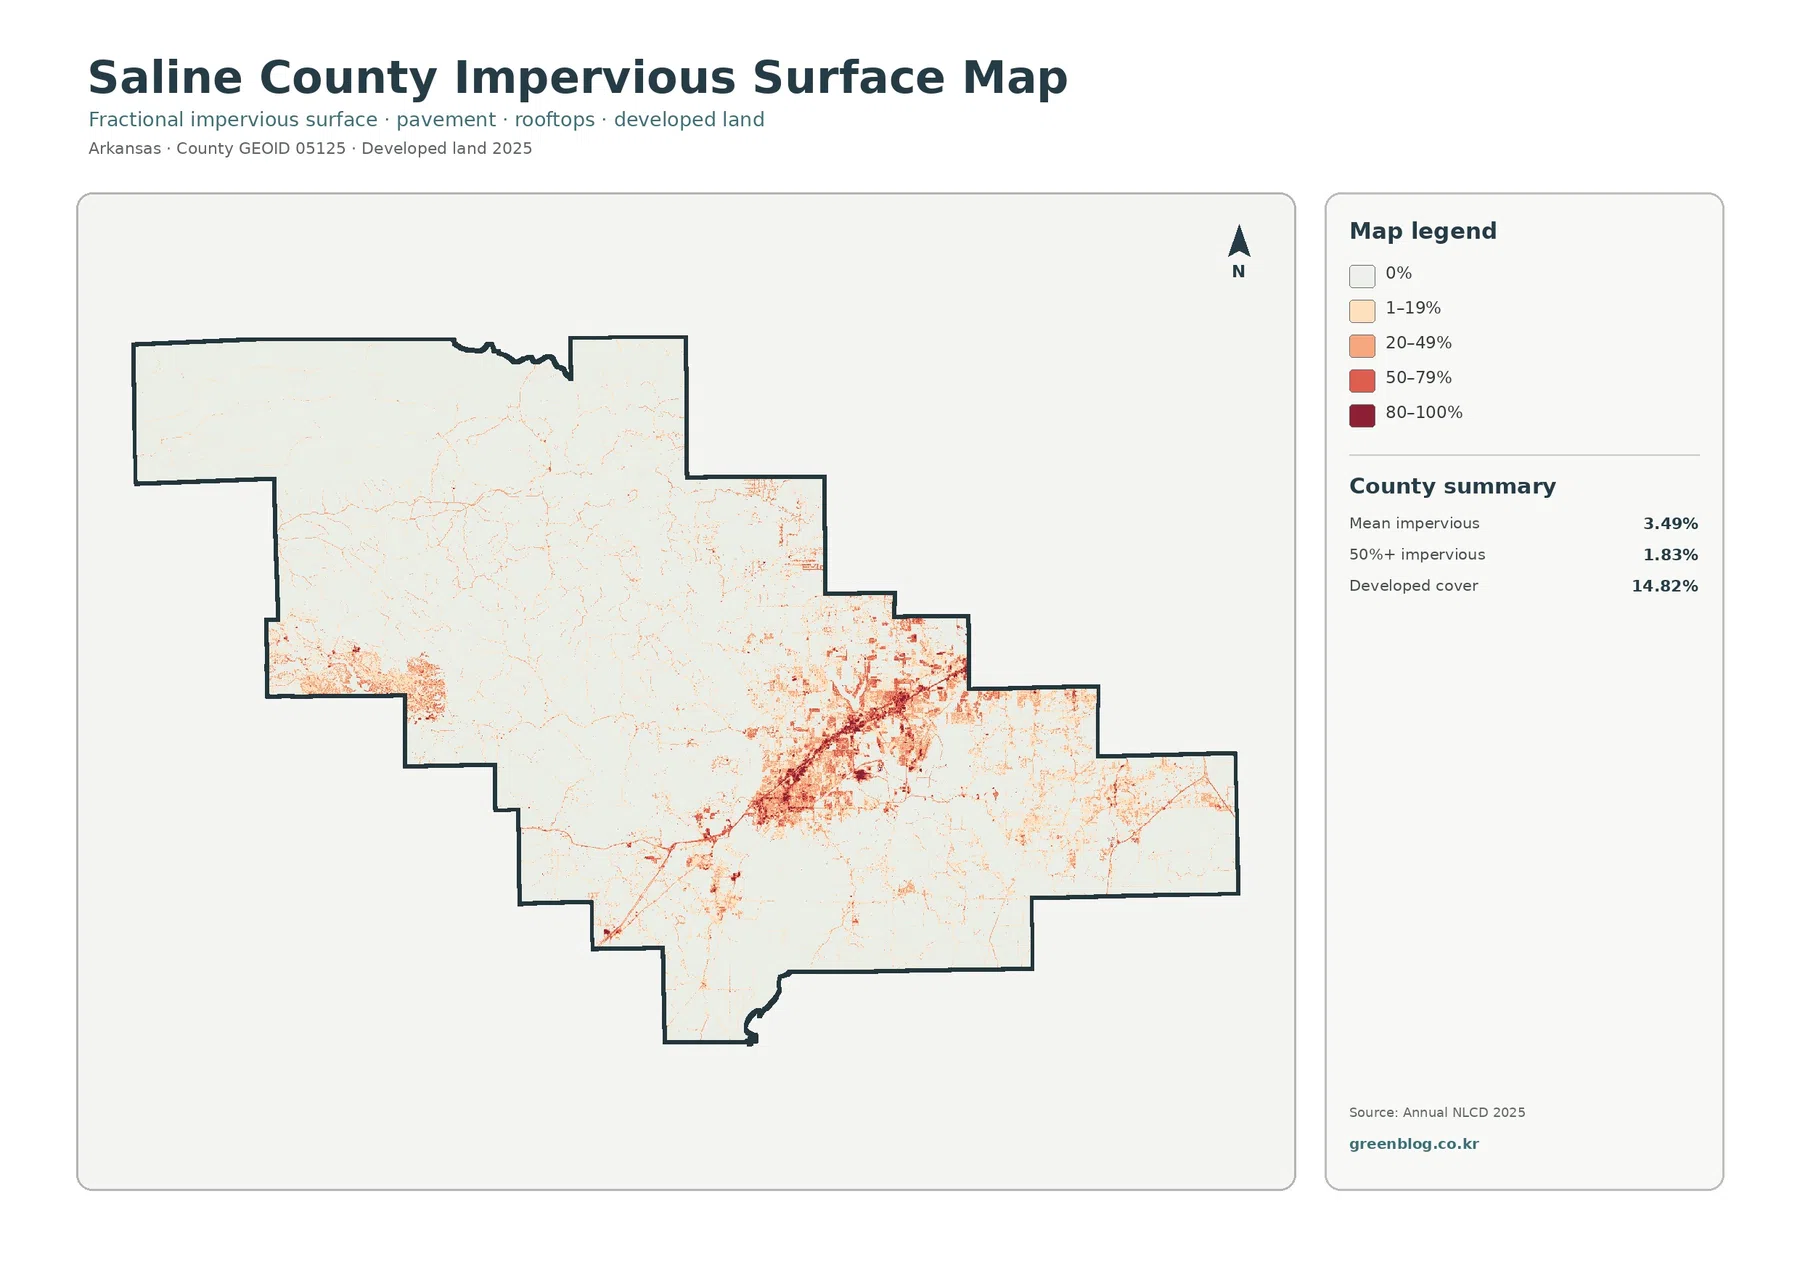
Impervious surface means pavement, rooftops, parking areas, and other hard surfaces that allow little rainwater to soak directly into the ground. Saline County’s mean impervious value is 3.49%, while 1.83% of the county is mapped at 50% impervious or greater. Those numbers are much lower than the 14.82% developed-cover share because developed land can include lawns, trees, landscaped open space, and other permeable surfaces. The two measurements answer different questions: one describes a land-cover class, and the other measures how much of the surface is physically hard.
The highest impervious values form a large cluster in the east-central part of the county around the Benton–Bryant area. Darker red patches mark the most heavily built surfaces, and lighter tones extend outward along smaller settlements and road-like corridors. A separate concentration appears farther west or southwest, while most of the large forest blocks remain near zero. This makes the impervious map one of the clearest ways to compare the county’s urbanized eastern side with the less built western landscape.
The 1985–2025 comparison contains both visible development and broad classification differences
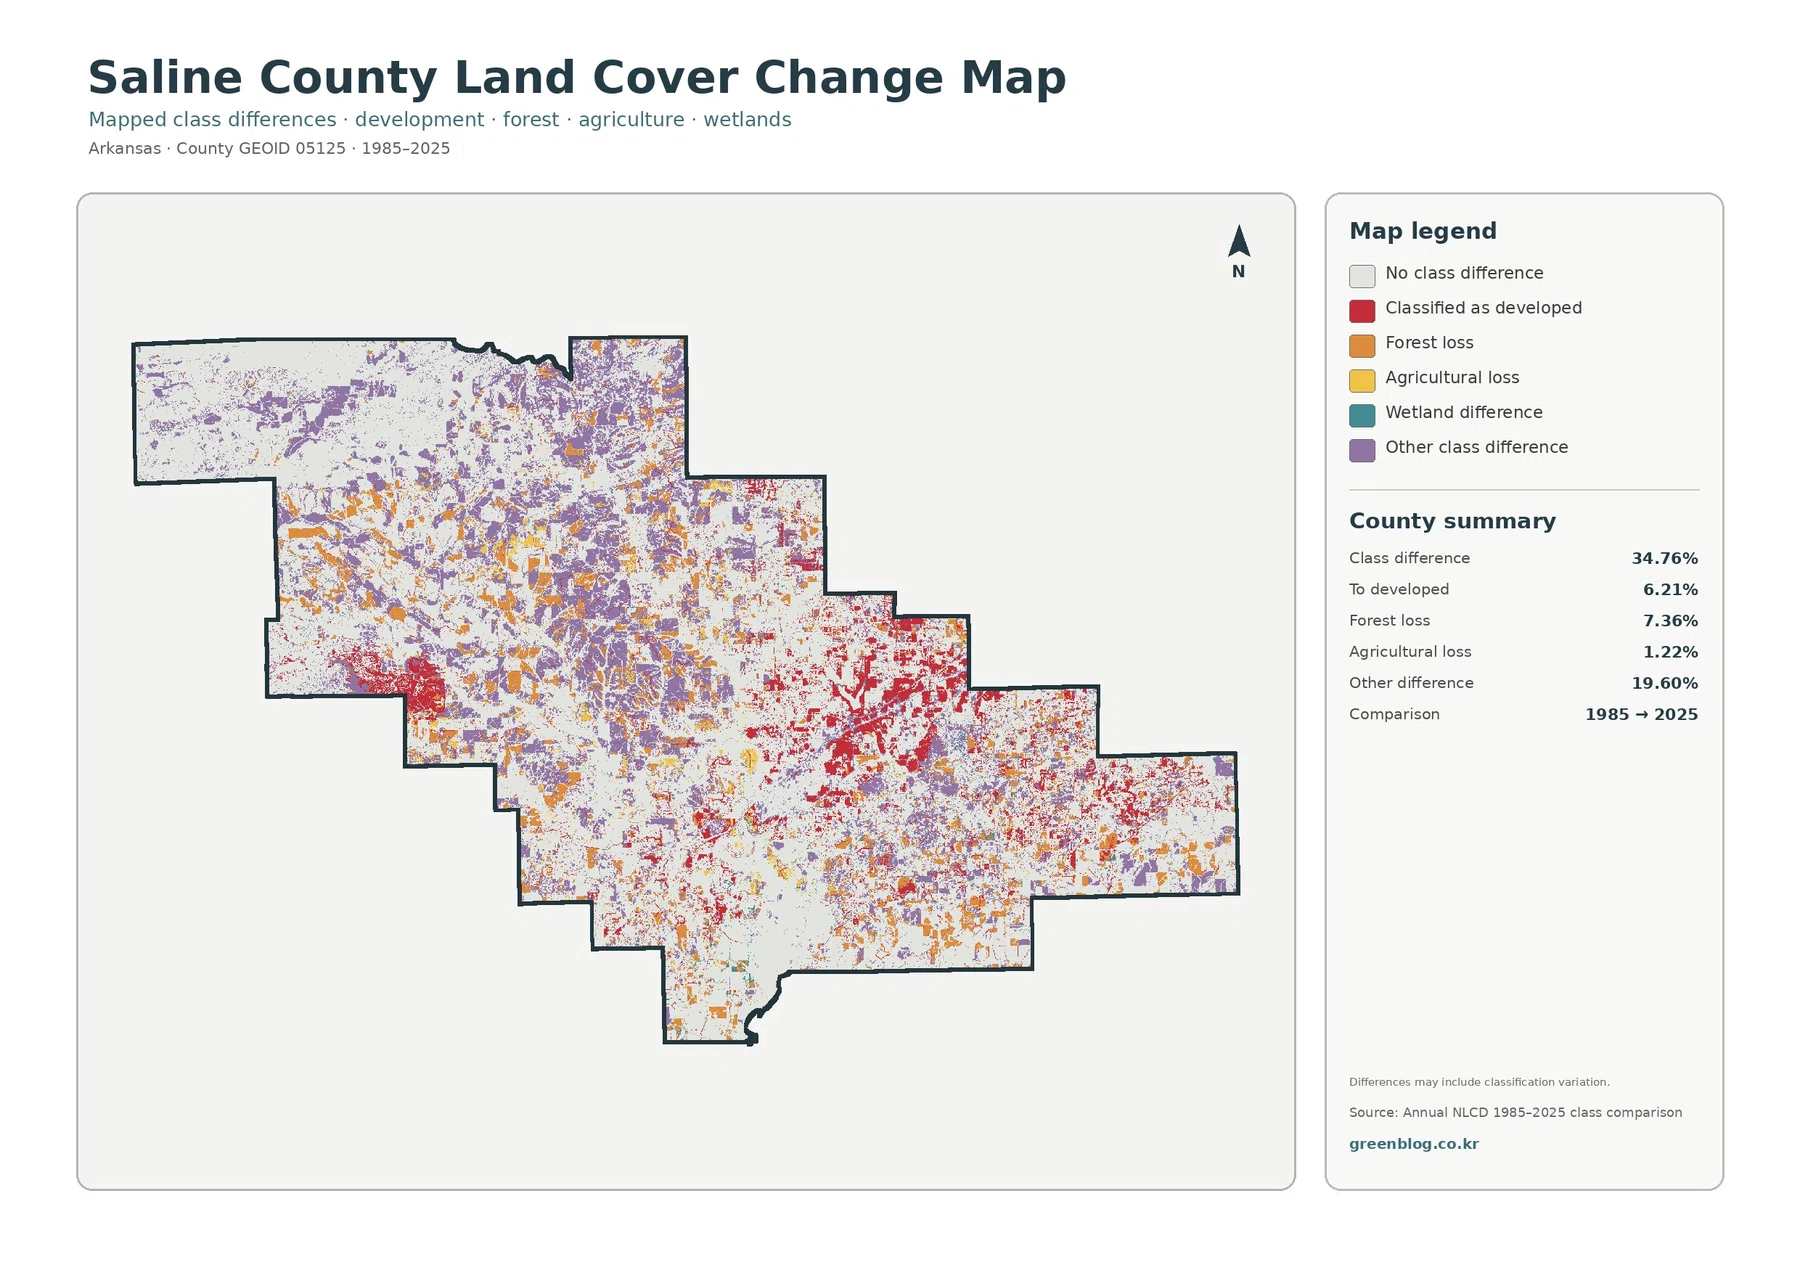
The change map highlights cells whose land-cover class differs between 1985 and 2025. In Saline County, 34.76% of the mapped area is marked as a class difference. The summary identifies 6.21% as change classified to developed, 7.36% as forest loss, 1.22% as agricultural loss, and 19.60% as other class difference. Red change-to-developed cells are especially noticeable around the current eastern built-up area, while orange forest-loss and purple other-difference cells are scattered through much of the central and western landscape.
The 34.76% figure should not be described as a precise rate of land-use conversion. The map itself notes that differences may include classification variation. Seasonal vegetation, moisture, mixed pixels, differences in source imagery, and classification methods can cause a cell to receive a different label even when the real-world change is subtle. The large 19.60% “other class difference” share is another reason to use the map as a screening tool rather than a parcel-by-parcel history. Where the cause of a change matters, aerial imagery, local records, and field information are better follow-up sources.
Choose the map that matches the question instead of treating the set as four copies
For a first look at Saline County, the general land-cover map is the best starting point because it places forest, development, agriculture, wetlands, and water in one frame. The forest-and-farmland version is better when the question is about wooded land, pasture or cropland openings, and wet areas. If the subject is the built environment, the impervious map adds detail that the broad developed class cannot provide. The change map is most useful last, after the reader already understands the current landscape and can compare a highlighted difference with its 2025 setting.
Raster scale and classification date set important limits on interpretation
Annual NLCD is a raster dataset, meaning the landscape is represented by a grid of cells rather than surveyed parcel boundaries. At roughly 30-meter land-cover resolution, a single cell can contain more than one real surface: trees beside a road, a house with a large yard, or a narrow stream running through forest. The classification simplifies that mixture. Small buildings, tiny ponds, thin roads, and precise forest edges may therefore look different from a high-resolution aerial image. Countywide patterns are the strength of these maps, not exact property boundaries.
Frequently Asked Questions
What is the largest land-cover class in Saline County?
Forest is the largest 2025 class at 60.50%. It is most extensive across the western and northwestern parts of the county, while the eastern side contains more developed land and a more varied mix of other classes.
Which map best shows development around Benton and Bryant?
The general land-cover map shows the 14.82% developed share, but the impervious-surface map is better for seeing where pavement and rooftops are concentrated. Mean impervious surface is 3.49% countywide.
Does the 34.76% change figure mean that one-third of the county changed legal land use?
No. The figure is the share of cells with a different land-cover class in the 1985–2025 comparison. It can include real landscape change as well as classification variation and mixed-pixel effects.
Map File Information
The four original Saline County JPG maps shown in this article are packaged in one ZIP file. The larger images are useful for presentations, classroom material, printing, and side-by-side county land-cover comparisons.
- Included Files: Use only the versions confirmed in the article and supplied images
- File Type: Use the confirmed download contents
- Intended Use: Printing, education, presentations, and map-based projects
Related Maps
- A Craighead County Arkansas Land Cover Map
- Arkansas County Arkansas Land Cover Map
- Ashley County Arkansas Land Cover Map
Sources and references
- MRLC Annual NLCD Data – current and annual land-cover data
- USGS Annual NLCD Land Cover Classification – land-cover classes and dataset interpretation
- U.S. Census Bureau TIGER/Line Shapefiles – county boundary reference
- University of Arkansas Cooperative Extension – Saline County Programs – local agriculture, forage, horticulture, and community program context
- U.S. Census Bureau – Saline County Profile – official county profile and geographic context
Green Map creates custom-edited map images using open geographic data sources such as geoBoundaries, Natural Earth, OpenStreetMap, and government open data.
These maps are edited visual materials, not raw data files, and are provided for education, documents, presentations, and graphic reference.