The Cleveland County Arkansas Land Cover Map set shows a south-central Arkansas county where forest and wetlands dominate far more of the landscape than cropland or developed land. In the 2025 summary, forest accounts for 48.52% of the county and wetlands for 32.47%. Grassland follows at 6.04%, with agriculture at 4.62%, developed land at 4.48%, shrubland at 3.48%, and water at 0.32%. The strongest visual impression is therefore not a single continuous forest but a broad forest-and-wetland mosaic broken by smaller open and developed areas.
Four views are included on this page: general land cover, forest and farmland, impervious surface and developed land, and mapped class differences from 1985 to 2025. The display images make it easy to compare patterns on screen, while the four original 2480×1754 JPG maps are available together in one download below. They can be used for classroom comparison, reports, presentations, and county-scale environmental reference without switching between different boundary extents.
Table of Contents
Why Cleveland County Does Not Look Like a Farm-Dominated Delta County
Much of the map is filled by dark green forest and blue-green wetlands. Forest is especially broad across western, northern, and southern sections, while wetlands occupy large areas through the interior and south. Agriculture is visible, but it appears as smaller yellow patches rather than the sweeping field blocks that dominate many counties farther east in Arkansas. The eastern side contains more open land than much of the west, which gives the county a noticeable internal contrast even though forest remains the largest class overall.
The percentages make that contrast easier to put in scale. Forest and wetlands together exceed 80% of the 2025 county summary. Grassland, agriculture, shrubland, developed land, and water divide most of the remaining area. A countywide percentage cannot show where those classes occur, however. That is why the map matters: forest is not distributed as one uninterrupted block, and wetlands do not occupy one simple basin. Open fields, grass, roads, settlements, and wet ground repeatedly interrupt the larger natural-cover classes.
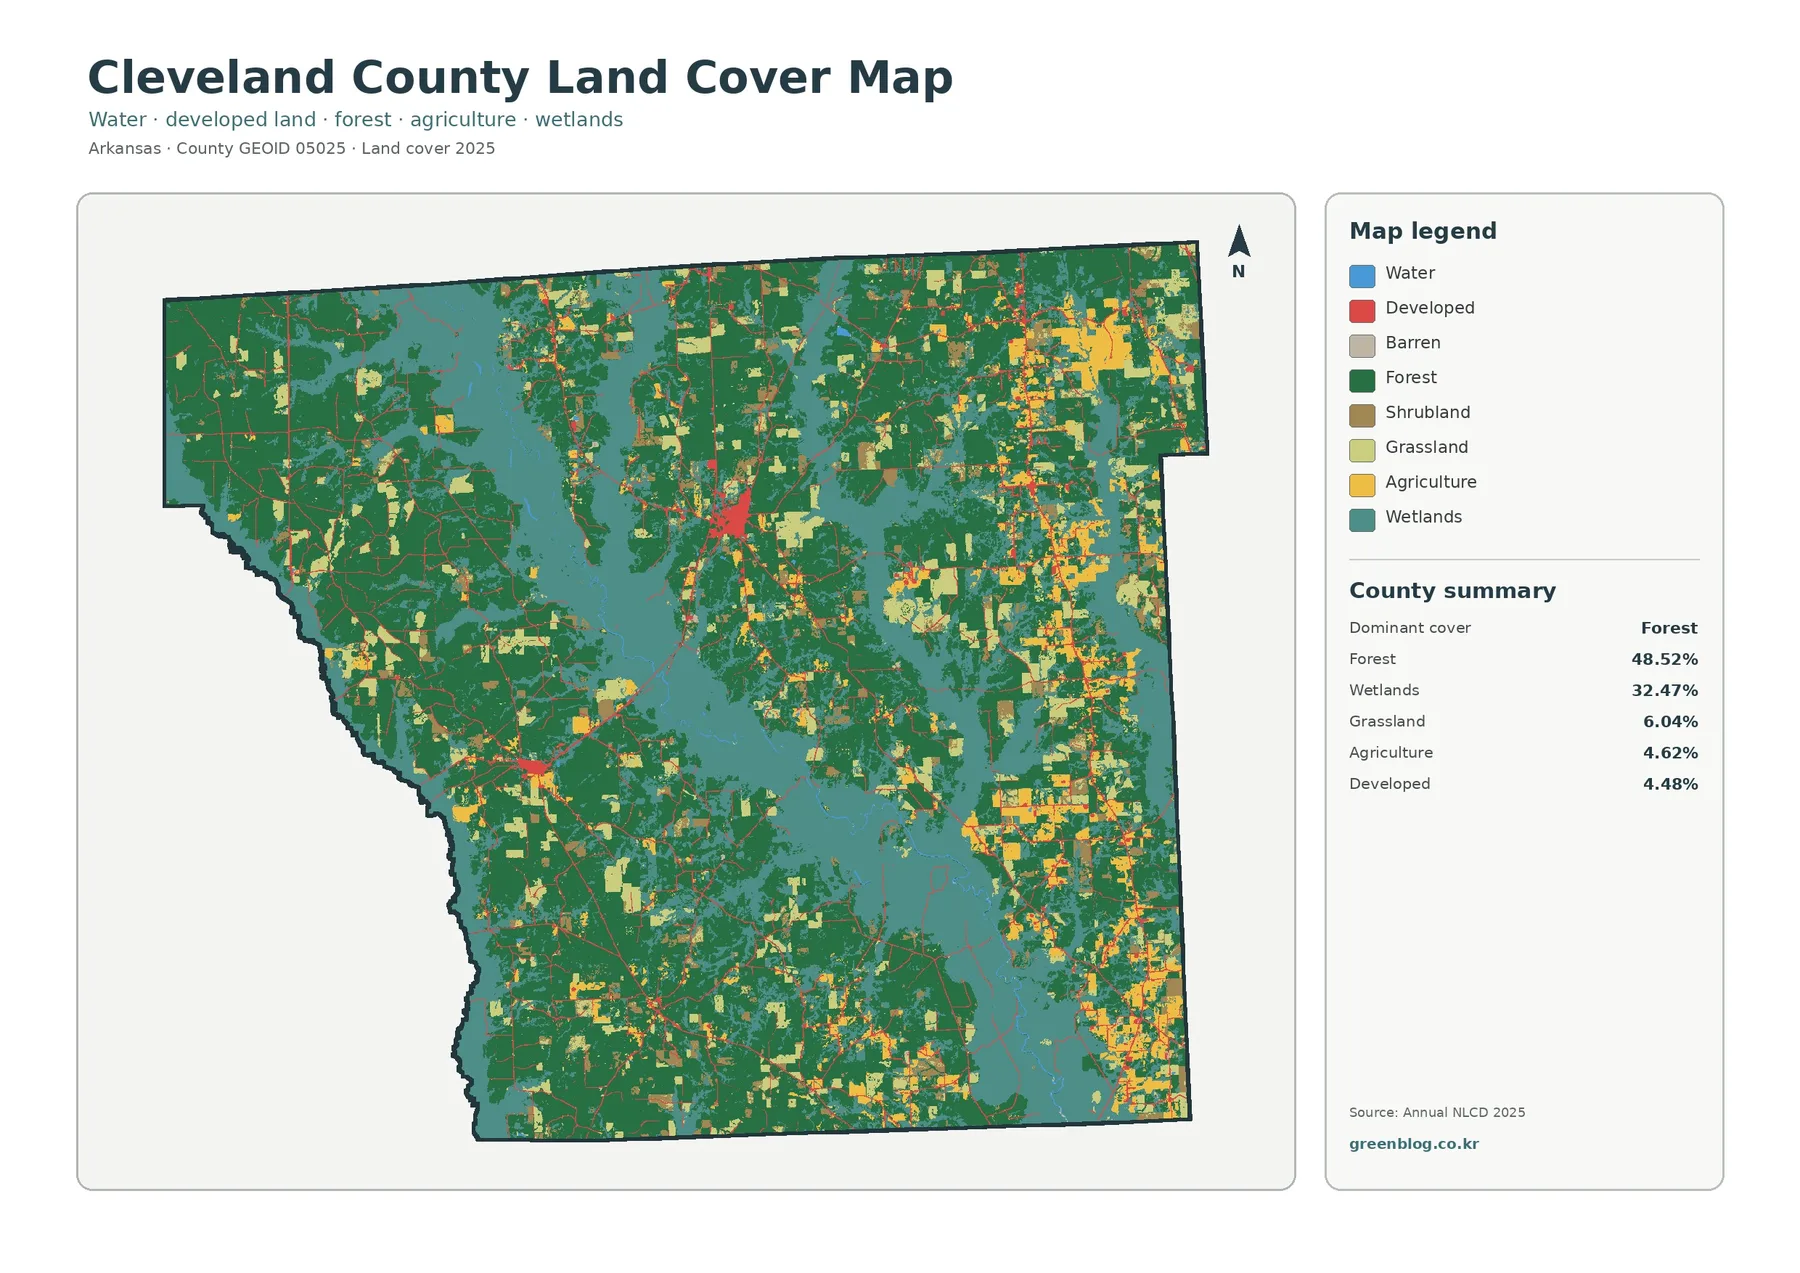
For a first reading, it helps to ignore the smallest colors and locate the two largest classes. Dark green identifies the main forest areas and teal identifies wetlands. Once those broad zones are clear, yellow agricultural patches and red developed areas become easier to place in context. This method is useful in presentations because it keeps the audience focused on the dominant county pattern before moving into the more detailed map views.
Wetlands Are a Major Part of the County Pattern
Wetlands account for 32.47% of the mapped county, making them the second-largest class by a wide margin. On the map they spread through broad interior and southern areas and also appear along drainage corridors. The Association of Arkansas Counties describes the Saline River as an important river running through Cleveland County. The land-cover map is not a hydrologic or legal wetland survey, but it does show how wetland-classified cells occur close to water and low-lying parts of the landscape.
This distinction matters because a land-cover wetland class is not the same thing as a regulatory wetland boundary. Annual NLCD classifies the visible surface using satellite-derived raster cells. A cell mapped as wetland helps describe the countywide surface pattern, but it does not establish jurisdiction, ownership, flood risk, or development restrictions for a parcel. For watershed education or a county overview, the map is valuable; for permitting or property decisions, a more specific official dataset is required.
The Forest and Farmland View Brings Out the Open Eastern Patches
The forest-and-farmland map simplifies the legend so the contrast between wooded land and open cover is easier to see. Forest remains the dominant dark green class at 48.52%, but agriculture and grassland stand out more clearly than they do on the full land-cover map. Agricultural cells, which total 4.62%, are more frequent toward the eastern and northeastern parts of the county, with smaller patches scattered through the center and west. Grassland at 6.04% adds another set of open areas around and between those agricultural patches.
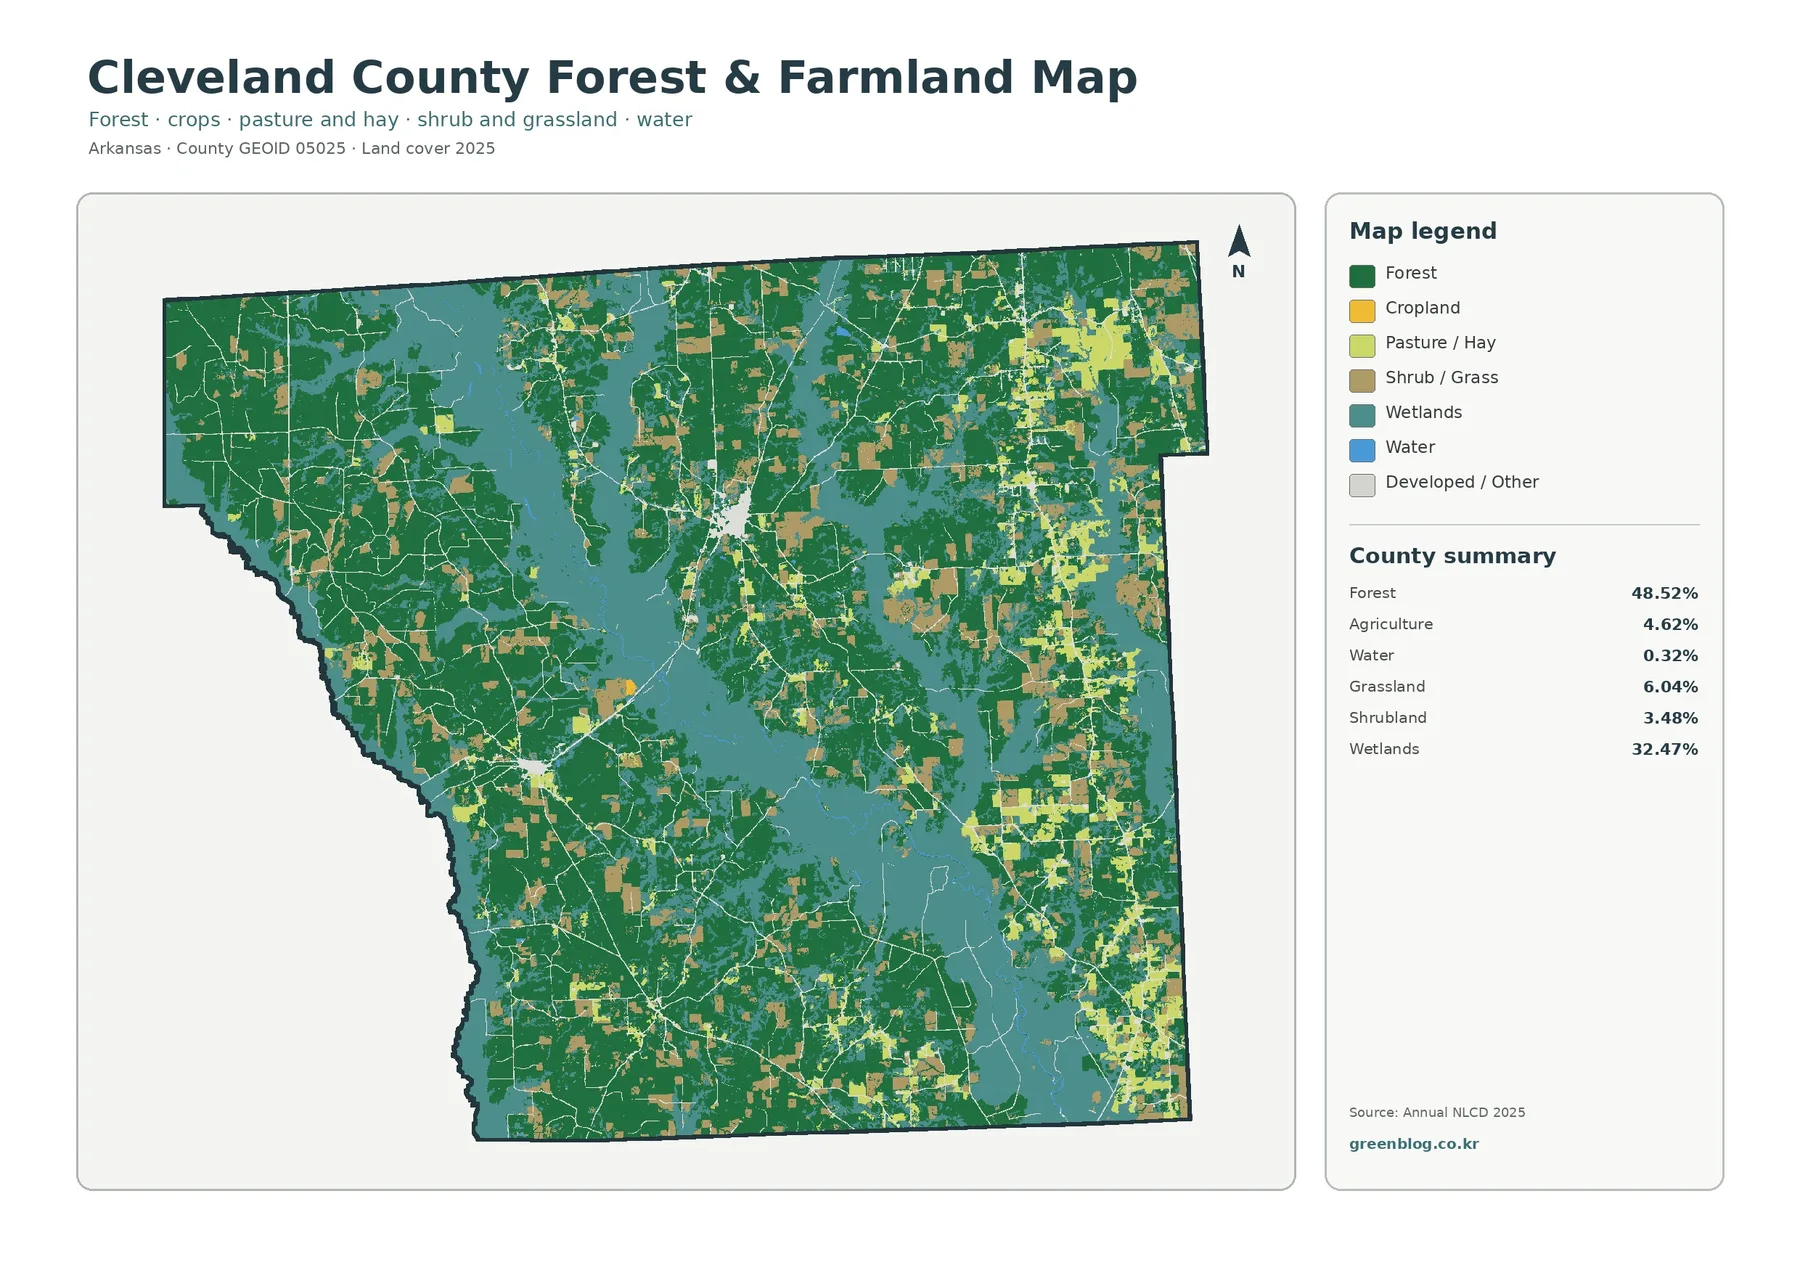
This version is useful when the full legend feels too busy. A small patch that is difficult to interpret on the general map can be compared directly with nearby forest, wetland, pasture or cropland colors. The pattern also helps avoid a common mistake: a low countywide agriculture percentage does not mean agriculture is absent. It means the agricultural class is concentrated in relatively limited areas rather than spread across most of the county.
The map should not be treated as a farm ownership map. It does not identify individual fields, operators, timber ownership, zoning, or legal land use. The University of Arkansas System Cooperative Extension Service maintains a Cleveland County office in Rison and provides agriculture and natural-resource programs for local residents. That local context is useful for understanding why forest, pasture, crops, and other managed lands matter in the county, but the mapped classes remain surface-cover categories rather than property records.
Rison Stands Out in an Otherwise Low-Impervious Landscape
The impervious-surface map strips away most land-cover colors and focuses on pavement, rooftops, and other surfaces that do not readily absorb water. Cleveland County has a mean impervious value of just 0.73%, and only 0.18% of the county is mapped at 50% impervious or higher. Those numbers match the visual impression: most of the county is pale, while stronger orange and red values occur in compact clusters and along thin road-like lines.
The most prominent central cluster corresponds to the Rison area, the county seat and largest local service center. The University of Arkansas county extension page lists Rison along with Kingsland, New Edinburg, Woodlawn, and other communities it serves. Smaller concentrations on the impervious map appear away from the main Rison cluster, while connecting lines trace developed corridors through otherwise forested or wetland-dominated surroundings. The map therefore makes settlement concentration easier to see than the general land-cover view.
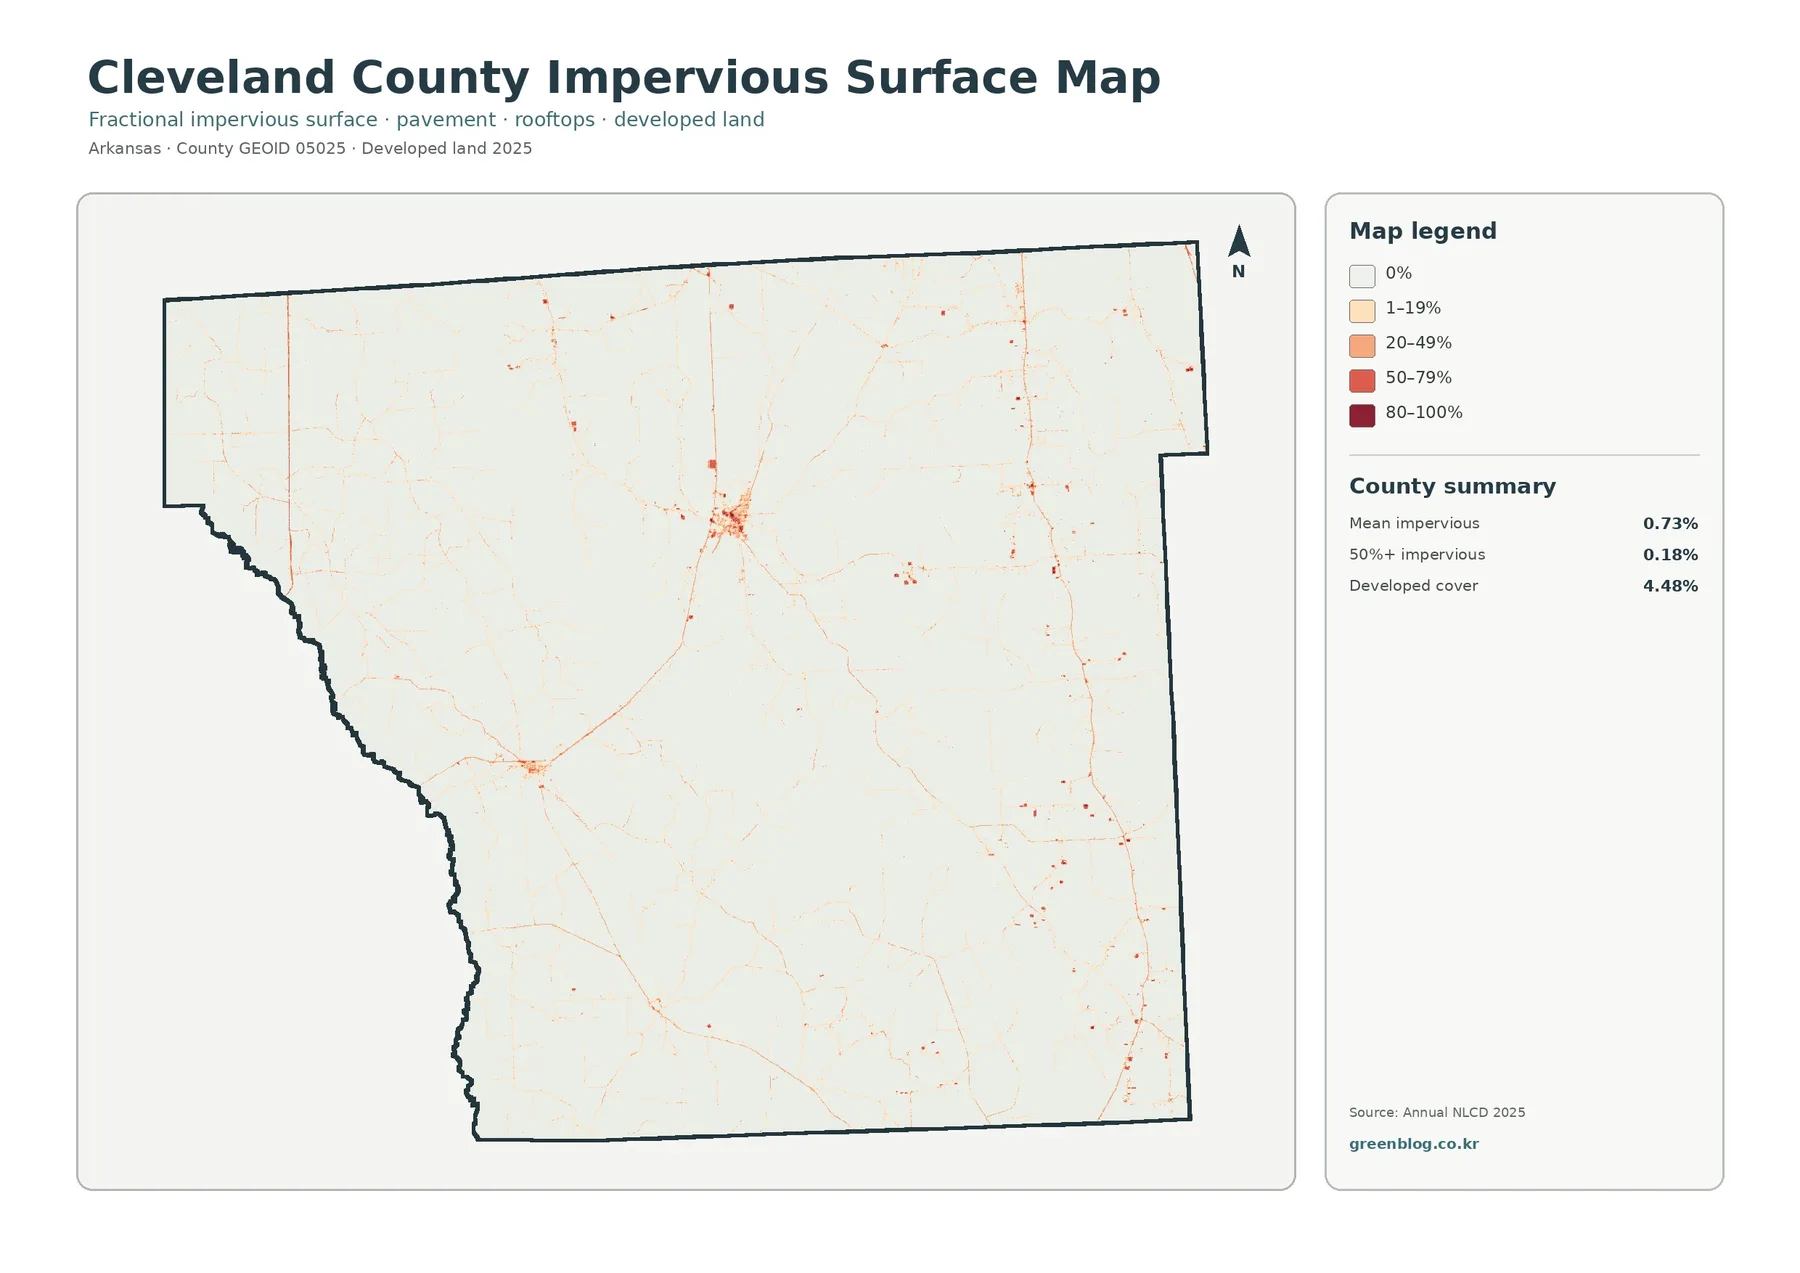
Developed cover is 4.48%, which is substantially larger than the 0.73% mean impervious value. The measures describe different things. Developed land is a land-cover class that can include houses, yards, roads, and other developed settings, while impervious percentage estimates how much of each raster cell is actually covered by hard surfaces. A residential cell can therefore be classified as developed even when lawns, trees, or bare soil occupy much of the same cell.
The 1985–2025 Comparison Shows Many Kinds of Class Difference
The change map compares the 1985 and 2025 classifications rather than simply displaying the present landscape. The summary reports a total class difference of 20.05%. Within the supplied breakdown, 1.05% is mapped as change to developed, 10.53% as forest loss, 1.24% as agricultural loss, and 4.31% as other difference. Wetland difference is also represented in the map legend, but the provided summary does not give a separate percentage for it, so no additional value should be inferred.
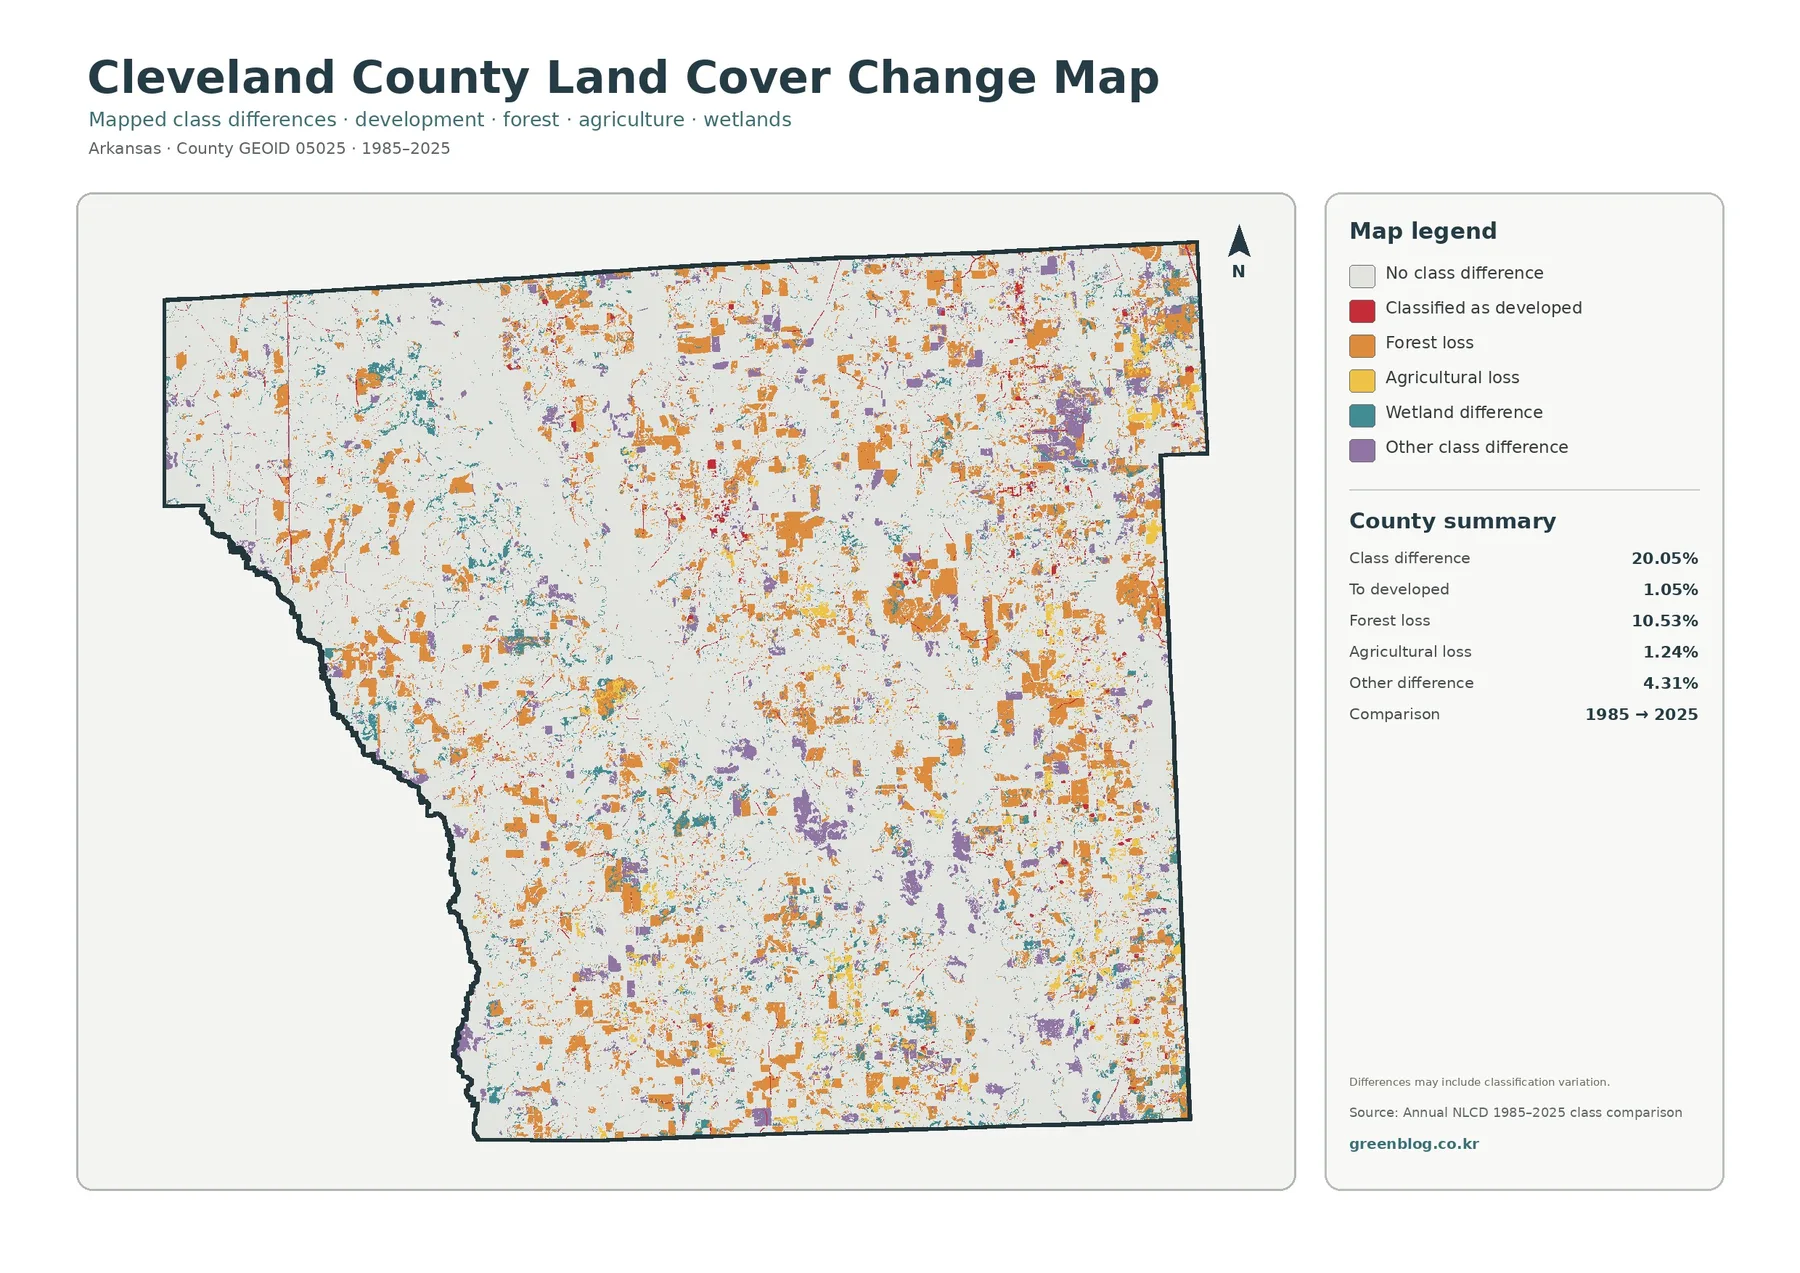
Orange forest-loss patches are distributed across many parts of the county instead of forming one single block around a city. Teal wetland differences and purple other differences also appear in multiple areas. That scattered pattern is a reason to avoid reducing the map to one story about development. Only 1.05% is specifically summarized as change to developed, and many of the remaining changed cells belong to other categories.
Class difference is not automatically the same as permanent ground change. Satellite observation, classification methods, mixed pixels, seasonal conditions, and the exact location of class boundaries can all influence a comparison. Some mapped differences may represent real logging, regrowth, agriculture, wetland change, or construction, but this map alone cannot establish the cause of an individual patch. Historical aerial imagery, local records, field observations, or project-level datasets would be needed for that.
Frequently Asked Questions
What is the dominant land-cover class in Cleveland County?
Forest is the largest 2025 class at 48.52%. Wetlands are second at 32.47%, so the two classes together account for more than four-fifths of the county summary.
Why is developed cover 4.48% when mean impervious surface is only 0.73%?
Developed cover is a land-cover category that can include buildings, roads, lawns, and other developed surroundings. Impervious surface measures only the hard portion of a cell, such as pavement or rooftops. A residential area may therefore be developed while still containing a large amount of vegetation or other permeable surface.
Does the 20.05% class difference mean 20.05% of the county was developed?
No. The 20.05% value includes all mapped class differences between 1985 and 2025. Only 1.05% is specifically summarized as change to developed. Forest loss, agricultural loss, wetland difference, other differences, and classification variation also contribute to the broader comparison.
Download the Four Original Cleveland County JPG Maps
The download archive contains the original JPG version of each map shown on this page: general land cover, forest and farmland, impervious surface and developed land, and 1985–2025 land-cover change. Each file is 2480×1754 pixels and is kept at its original source size. The package does not upscale the images to claim a larger print resolution, so users planning a large-format print should check the desired physical size and output quality before printing.
For digital work, the maps can be placed in presentations, reference sheets, classroom handouts, or county comparison documents. The general map works well as an overview, while the simplified forest-and-farmland view is easier to annotate. The impervious map is useful when the topic is settlement or hard-surface concentration, and the change map can introduce a discussion about how land-cover classifications differ across time. None of these uses changes the need for parcel-level or regulatory data when a decision depends on exact boundaries.
Classification, Scale, and Date Limit What the Maps Can Prove
Annual NLCD is a raster classification, meaning the surface is represented by grid cells rather than surveyed parcel polygons. A cell near a road, forest edge, wetland boundary, or settlement can contain more than one real-world surface. The classification assigns a class or an impervious estimate at that scale, so very narrow roads, tiny ponds, individual buildings, and property lines may be generalized or missed. The map is appropriate for county-scale patterns, not for locating a legal boundary on the ground.
Land cover should also be separated from land use. Forest describes a surface covered by trees; it does not tell you who owns the land or whether the area is managed for timber, recreation, conservation, or another purpose. Agricultural cover indicates a mapped crop or pasture-related surface, not a zoning designation. Developed cover and impervious surface similarly do not establish building rights, infrastructure ownership, drainage responsibility, or permit status.
The date is the final limitation to keep in view. The current maps summarize 2025 conditions, while the comparison spans 1985 to 2025. Any construction, timber harvest, flooding, regrowth, or agricultural shift after the observation year may not appear. If the maps are being used for a current planning question, compare them with recent aerial imagery and the latest county or state information before drawing a site-specific conclusion.
Map File Information
The archive contains four original Cleveland County land-cover JPG maps covering the same county extent.
- File Type: Four JPG files in one ZIP archive
Related Maps
- Arkansas County Arkansas Land Cover Map
- Ashley County Arkansas Land Cover Map
- Baxter County Arkansas Land Cover Map
Sources and Reference Material
- MRLC Annual NLCD Data — official access point for Annual NLCD land-cover data
- USGS Annual NLCD Land Cover Classification — classification and legend reference
- U.S. Census Bureau TIGER/Line Shapefiles — official county boundary reference
- University of Arkansas System Cooperative Extension Service — Cleveland County — local agriculture, natural-resource, and community program information
- Association of Arkansas Counties — Cleveland County — county overview including Rison and the Saline River
Green Map creates custom-edited map images using open geographic data sources such as geoBoundaries, Natural Earth, OpenStreetMap, and government open data.
These maps are edited visual materials, not raw data files, and are provided for education, documents, presentations, and graphic reference.