This page covers Yavapai County, Arizona with four land-cover views and a single ZIP containing the original JPG maps. In the 2025 summary, shrubland accounts for 79.49% of the county and forest for 15.81%. Developed cover is only 2.24%, yet the red developed areas form clear clusters near the middle of the county and in several eastern locations. The combination makes the county look broadly shrub-dominated while still containing substantial forest patches and compact areas of harder, built surfaces.
The four maps separate questions that are easy to confuse when only one image is used. The general map compares current cover classes, the forest-and-farmland view simplifies vegetation and agriculture, the impervious map focuses on pavement and rooftops, and the change map marks class differences between 1985 and 2025. All four original JPGs are available in one download below. They are useful for presentations, classroom work, county-scale environmental comparison, and map reference, but they should not be treated as parcel, ownership, zoning, or development-permission maps.
Table of Contents
A county where shrubland is continuous but forest is visibly clustered
The strongest visual pattern is the broad field of shrubland covering much of the west, southwest, north, and large parts of the east. The 79.49% figure is consistent with what the map shows at a glance. Forest, however, is not a minor trace. Dark-green areas occupy 15.81% of the county and appear in several sizeable groups, especially from the central area toward the northwest, in a large central-southern patch, and in multiple eastern areas. These forest blocks interrupt the shrubland and create the main natural-cover contrast on the map.
Forest and farmland are easier to compare after the legend is simplified
The forest-and-farmland map removes some of the competing classes and groups the landscape around forest, cropland, pasture or hay, shrub and grass, wetlands, and water. That simpler view makes the distribution of forest much easier to follow. Dark green forms a broken but substantial set of patches through the central and northwestern part of the county, with additional forest in the center-south and east. Large tan areas between them remain dominated by shrub and grass cover.
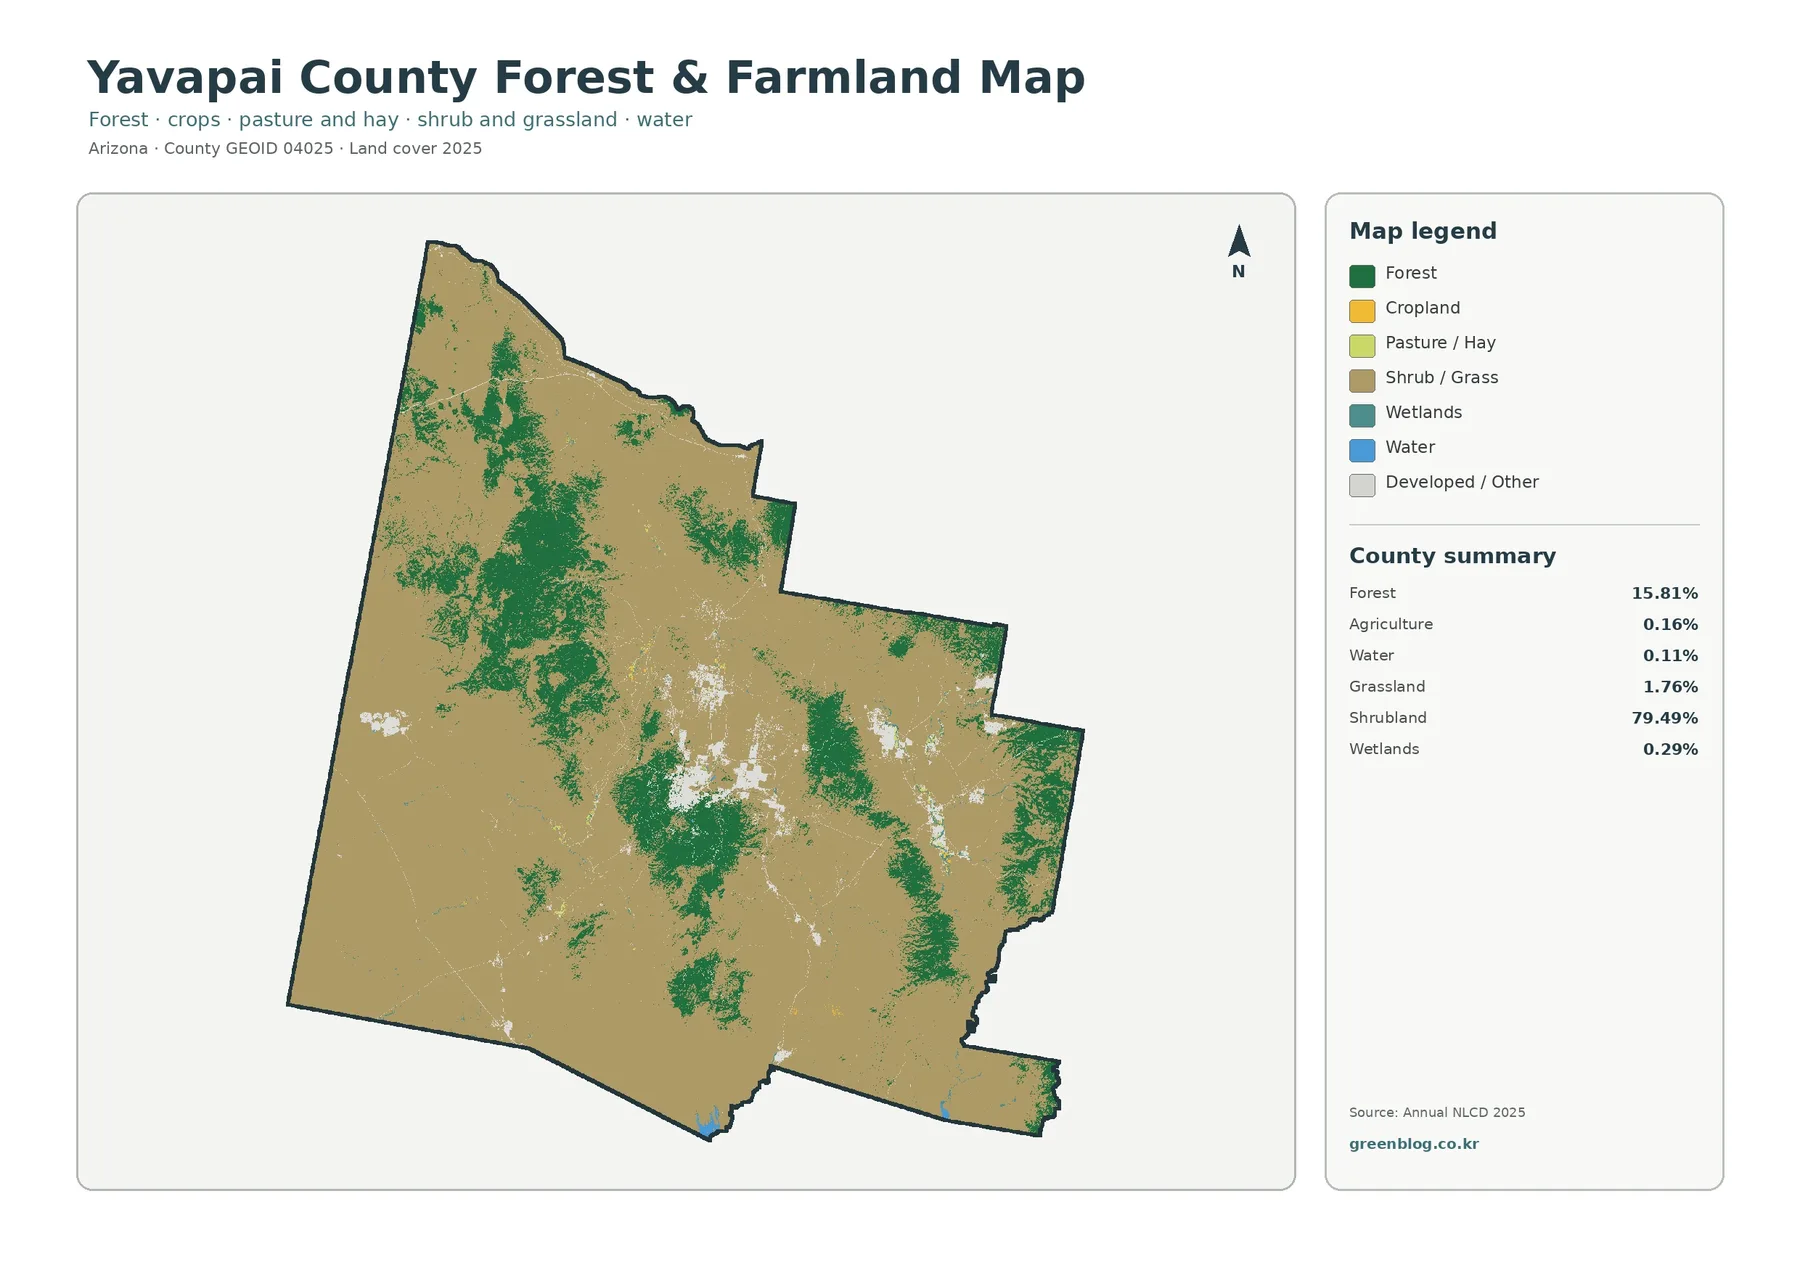
The summary reports 15.81% forest and only 0.16% agriculture. Water is 0.11%, grassland 1.76%, shrubland 79.49%, and wetlands 0.29%. The tiny agricultural percentage matters when interpreting the image: scattered light agricultural marks should not be described as a broad farming belt. The 2025 classification indicates that agriculture occupies only a small share of the county compared with shrubland and forest.
Built surfaces occupy little area but form distinct concentrations
Impervious surface means the hard portion of the ground that water cannot easily soak through, such as pavement, roofs, and large paved lots. It is related to developed land, but the two measures are not identical. Yavapai County has 2.24% developed cover while the mean impervious value is 0.57%. A developed raster cell may include vegetation, bare soil, landscaped ground, and other permeable surfaces, so its impervious percentage can be well below 100%.
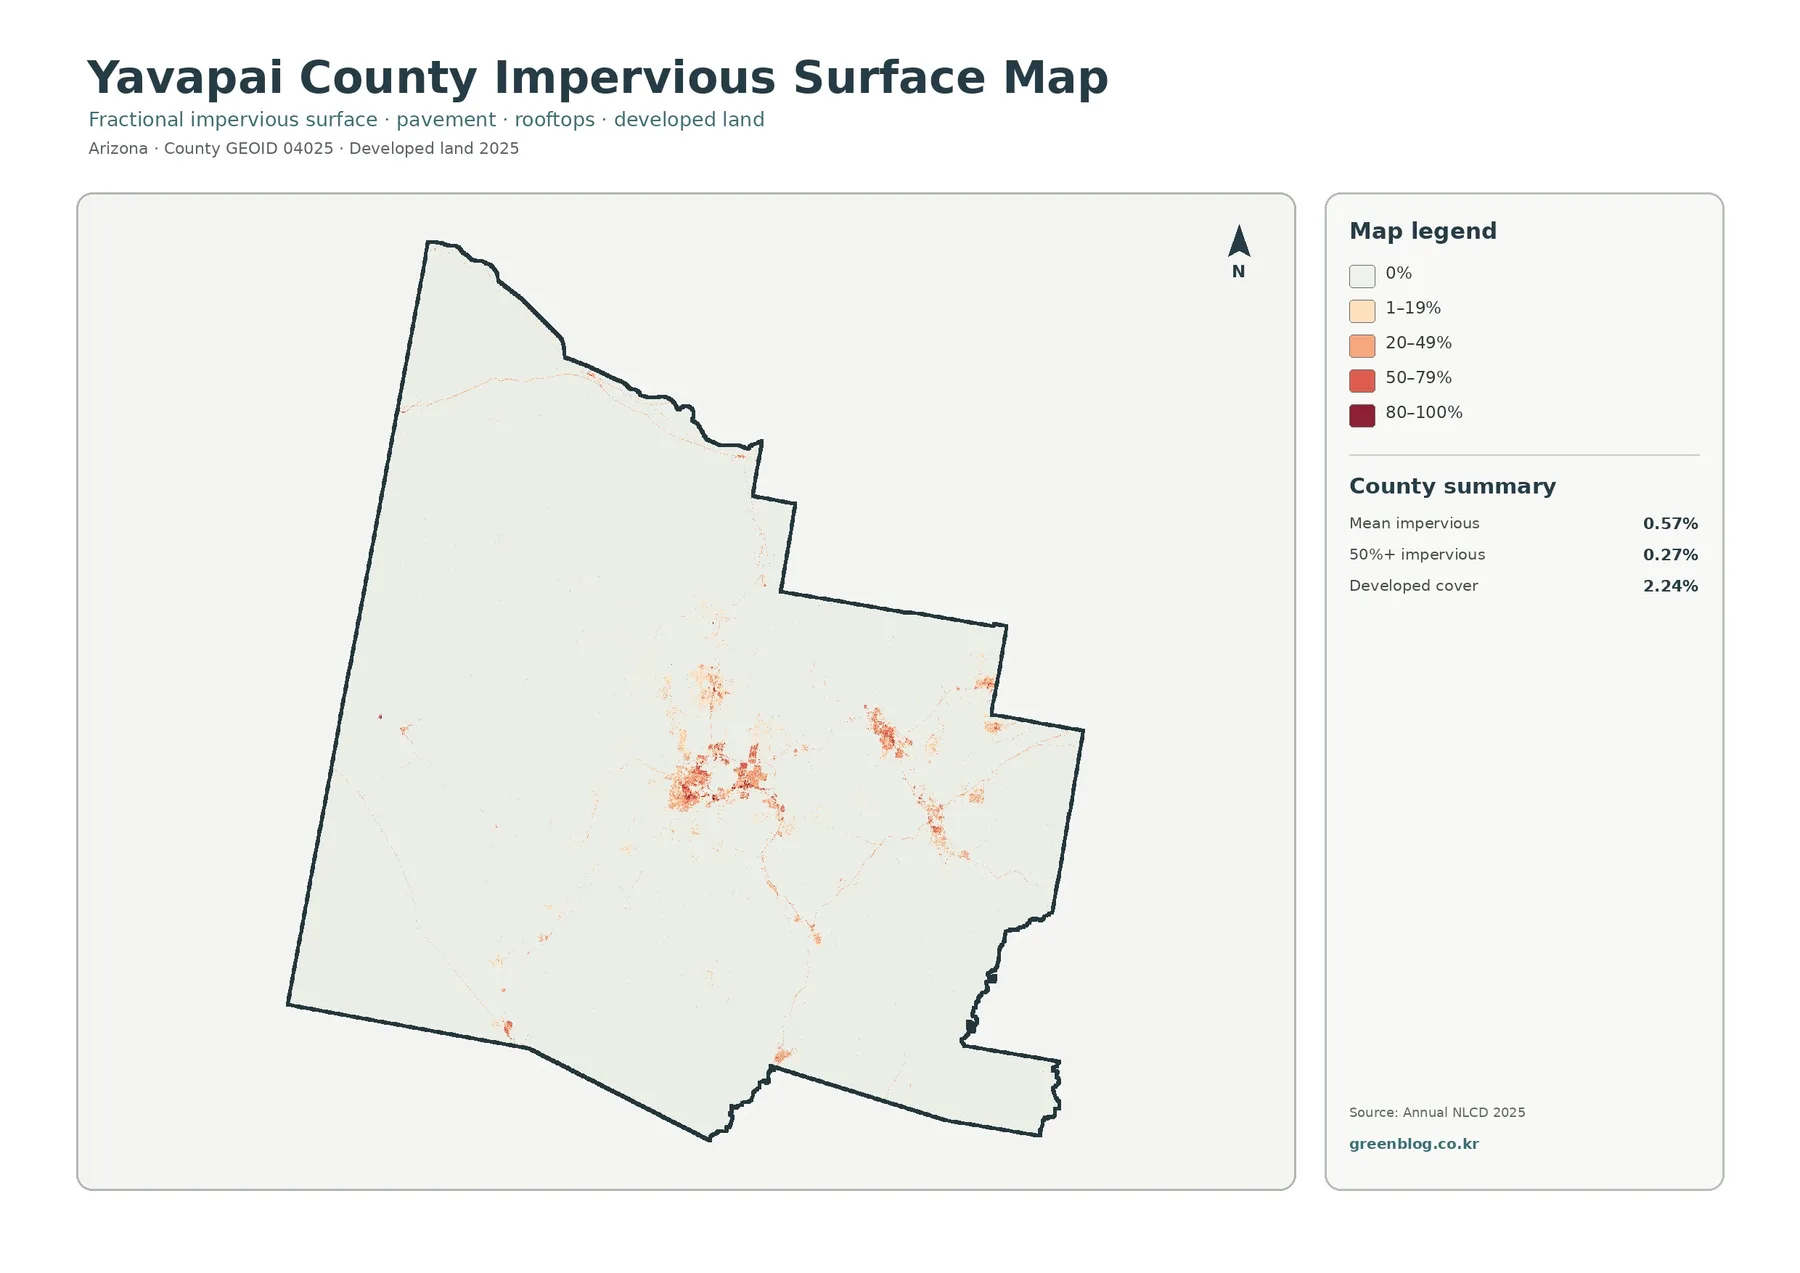
Most of the county is very pale on the impervious map. Stronger orange and red tones are concentrated in the central cluster and a series of smaller eastern and southeastern clusters. Those locations broadly correspond with the developed areas on the general land-cover map. The west and much of the north contain very little high-intensity impervious color, reinforcing the impression that hard surfaces are concentrated rather than widespread.
The general 2025 map keeps all major cover classes in one view
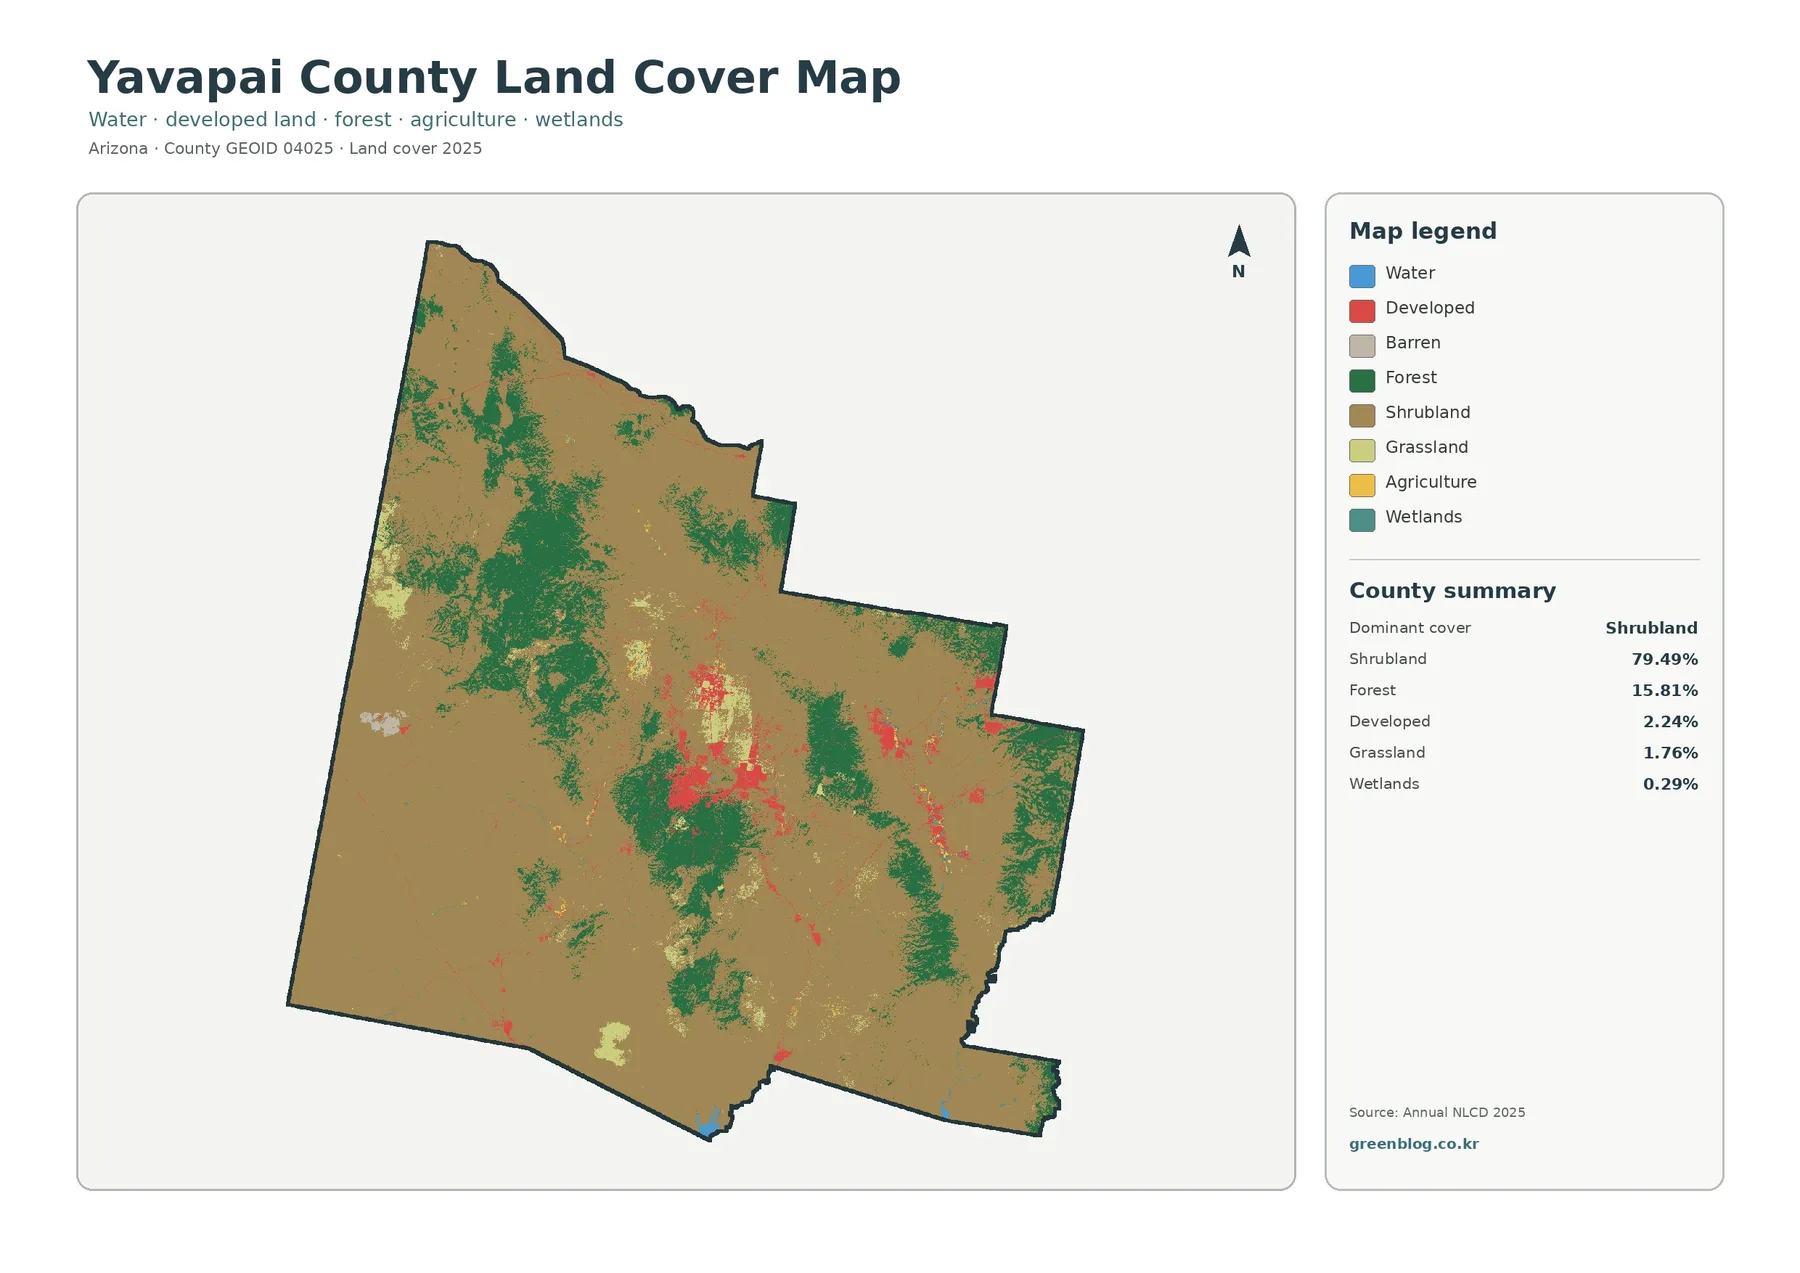
The general map is the best starting point when the goal is to understand the county as a whole. Shrubland creates the dominant background, while dark-green forest forms the largest contrasting natural cover. Red developed land is much less extensive but visually concentrated. Grassland appears in smaller pale-green areas, and the limited water, wetland, and agricultural classes occur as small patches or narrow features rather than broad countywide zones.
The 1985–2025 change map marks class differences, not a complete history
The change map compares classification at two endpoints rather than showing every event that happened during the forty-year interval. It reports 6.80% of the county with a class difference. Within that summary, 1.17% is labeled as change to developed, 2.75% as forest loss, 0.13% as agricultural loss, and 2.73% as other class difference. These categories are useful for locating areas that deserve a closer look, but they do not identify the date or cause of each change.
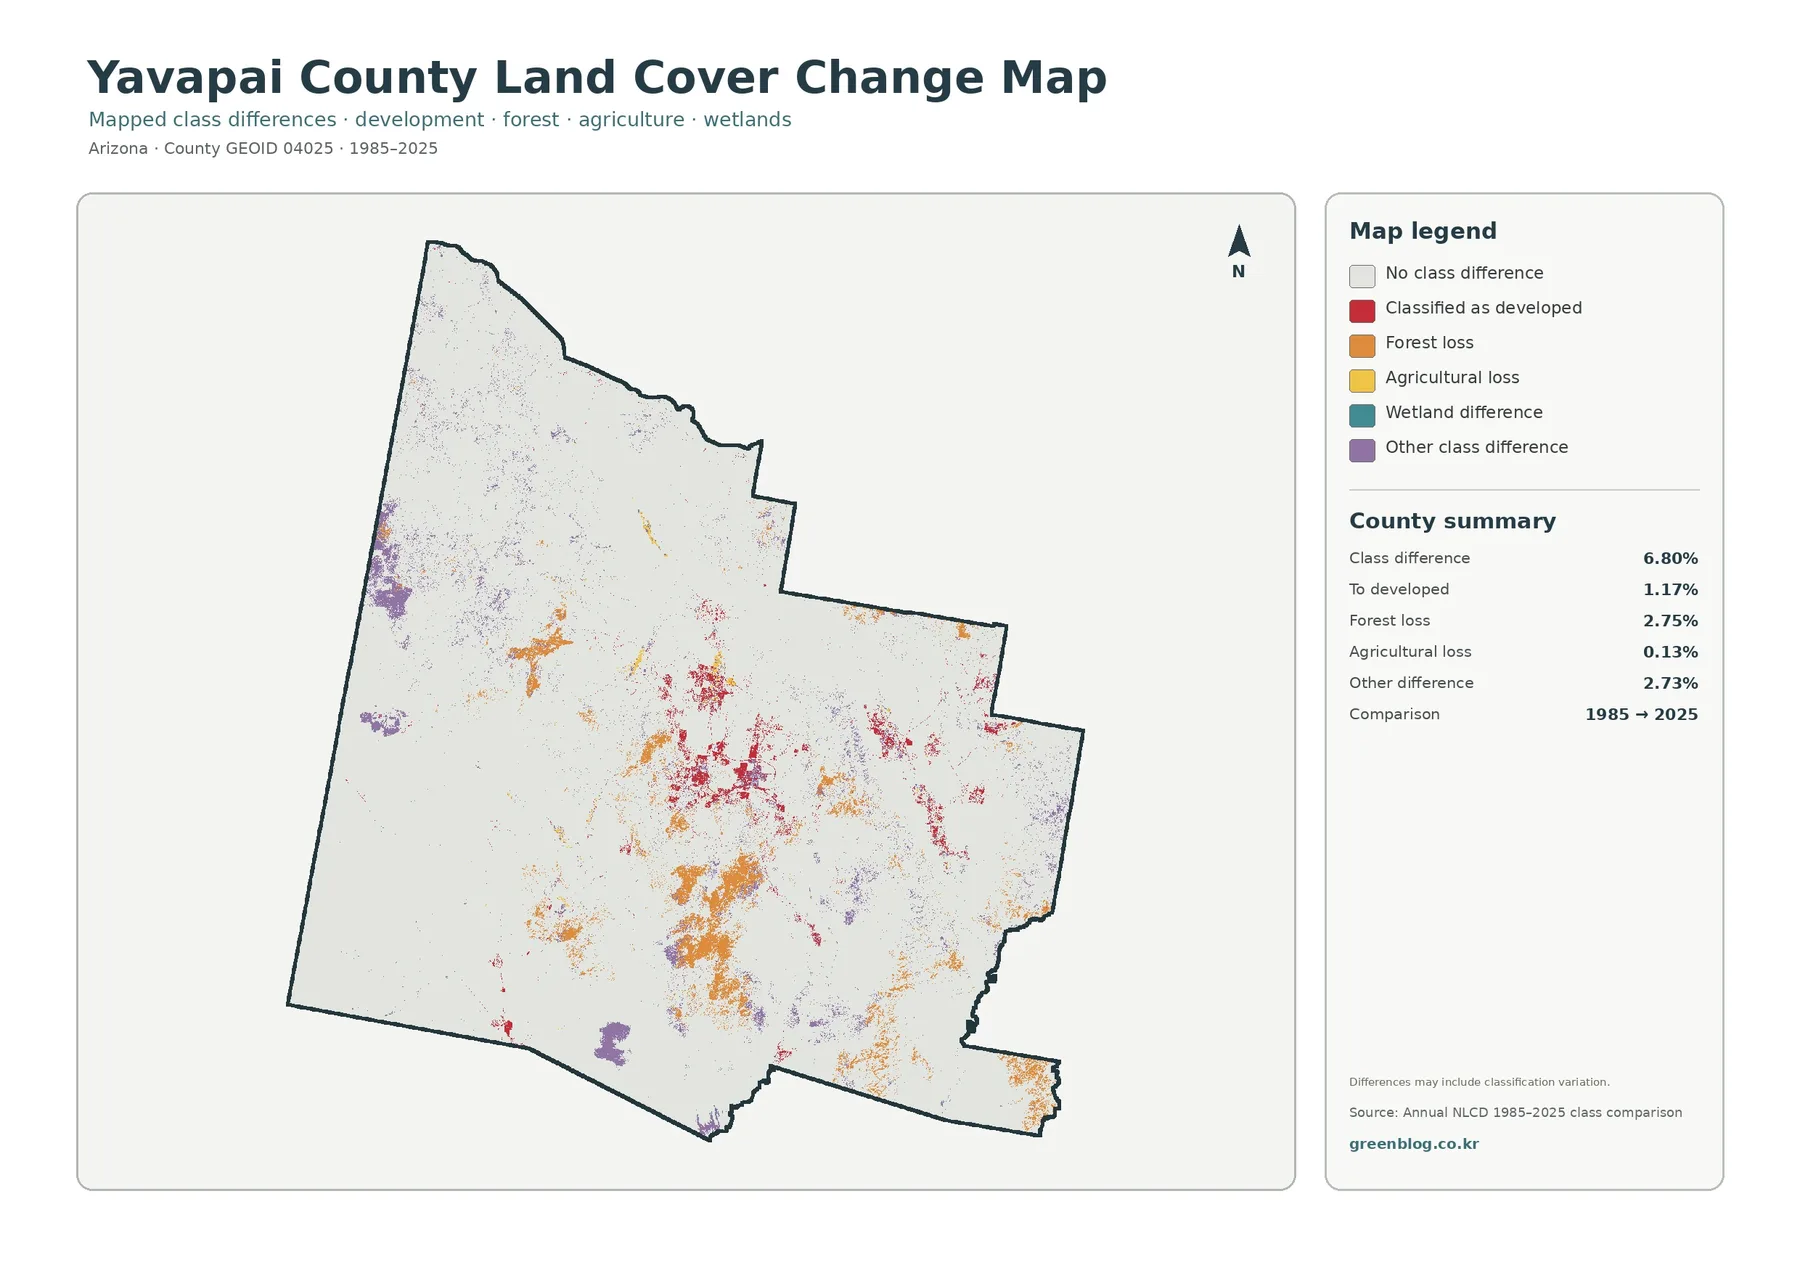
Red change-to-developed areas are most noticeable around the large central concentration and several eastern clusters. Orange forest-loss areas appear in multiple patches, including central-southern and eastern parts of the county and smaller areas farther north. Purple other-difference areas are scattered more widely, including the west and south. Agricultural-loss color is limited, which matches the small 0.13% summary value.
Why the same location can look different on each map
The four views answer related but separate questions. A red developed cell on the general map describes land-cover class, while a dark tone on the impervious map describes the share of hard surface. The two often occur together, but they are not interchangeable. A low-density developed cell may still contain considerable vegetation or soil, and a narrow paved feature may appear on the impervious layer without creating a large developed patch on the general map.
Download the four original JPG maps in one ZIP
The downloadable archive contains one JPG for each map: general land cover, forest and farmland, impervious surface and developed land, and 1985–2025 land-cover change. Use a single file when one topic is enough, or place the four maps together when the purpose is comparison. Keeping the legend and county-summary panel visible makes the maps much easier to interpret correctly in a report, handout, or slide deck.
Each source JPG is 2480 × 1754 pixels. The package keeps that original size rather than enlarging it and claiming a higher resolution. For a large print, check whether the legend text and small patches remain readable at the intended output size. When inserting the map into a document, preserve its aspect ratio so that the county boundary and legend do not become stretched.
Choosing the right view for reference, teaching, or environmental comparison
Raster classification is generalized and should not be used as parcel evidence
Annual NLCD land-cover products use a 30 m raster grid. In practical terms, the landscape is divided into cells and each cell receives a dominant cover class or an impervious percentage. Real ground conditions are more complicated. A single cell can include shrubs, bare soil, a road edge, a roof, and grass at the same time. The resulting map simplifies that mixture, so color boundaries should not be expected to match parcel lines, vegetation edges, or construction footprints exactly.
Frequently Asked Questions
What is the largest land-cover class in Yavapai County?
Shrubland is the largest 2025 class at 79.49%. Forest is second at 15.81%, followed by developed cover at 2.24% and grassland at 1.76%. Wetlands, agriculture, and water are all below one percent in the supplied summary. These are countywide classification percentages, not parcel-level measurements.
Why is developed cover 2.24% while mean impervious surface is only 0.57%?
Developed cover is a land-cover class, whereas impervious surface measures how much of a raster cell is occupied by hard surfaces such as pavement and roofs. Developed cells can still contain vegetation and soil. The map also reports that only 0.27% of the county is in cells with at least 50% impervious surface, so high-intensity hard cover is concentrated in a small part of the county.
Does the 6.80% class difference mean that 6.80% of the county changed legal land use?
No. The 6.80% value describes a difference between the 1985 and 2025 land-cover classifications. It includes change-to-developed, forest loss, agricultural loss, and other class differences, and it may also reflect classification variation. Legal land-use change, zoning, ownership, or a particular development event requires separate records.
Map File Information
Yavapai County Land Cover Four-Map Package
- File Type: Four JPG files in one ZIP archive
Related Maps
- Apache County Arizona Land Cover Map
- Cochise County Arizona Land Cover Map
- Coconino County Arizona Land Cover Map
Sources and Reference Material
- MRLC Annual NLCD Data — official access to Annual NLCD land-cover and related datasets.
- USGS Annual NLCD Land Cover Classification — official reference for land-cover classes and raster interpretation.
- U.S. Census Bureau TIGER/Line Shapefiles — official geographic boundary files for counties, states, and related features.
- Yavapai County Comprehensive Plan — official county planning reference for long-term land-use, growth, and resource context.
- Yavapai County GIS Mapping — official county GIS and mapping resources.
Green Map creates custom-edited map images using open geographic data sources such as geoBoundaries, Natural Earth, OpenStreetMap, and government open data.
These maps are edited visual materials, not raw data files, and are provided for education, documents, presentations, and graphic reference.