This page covers land cover in Santa Cruz County, Arizona through four complementary maps and provides the four original JPG files in one download. The 2025 overview is dominated by shrubland at 82.63%, while forest, grassland, and developed cover form much smaller but distinct patterns. Comparing current land cover with the forest/farmland, impervious-surface, and 1985–2025 change views makes it easier to separate broad natural cover from concentrated development and mapped class differences.
The downloadable set is useful for classroom work, presentations, county-scale environmental comparisons, and general reference. Each map answers a different question, so the most informative approach is to keep the legend with the image and compare the maps rather than treating one view as a complete description of the county. These are land-cover products, not parcel, ownership, zoning, permit, or regulatory wetland maps.
Table of Contents
Start with the 2025 map to locate the main cover classes
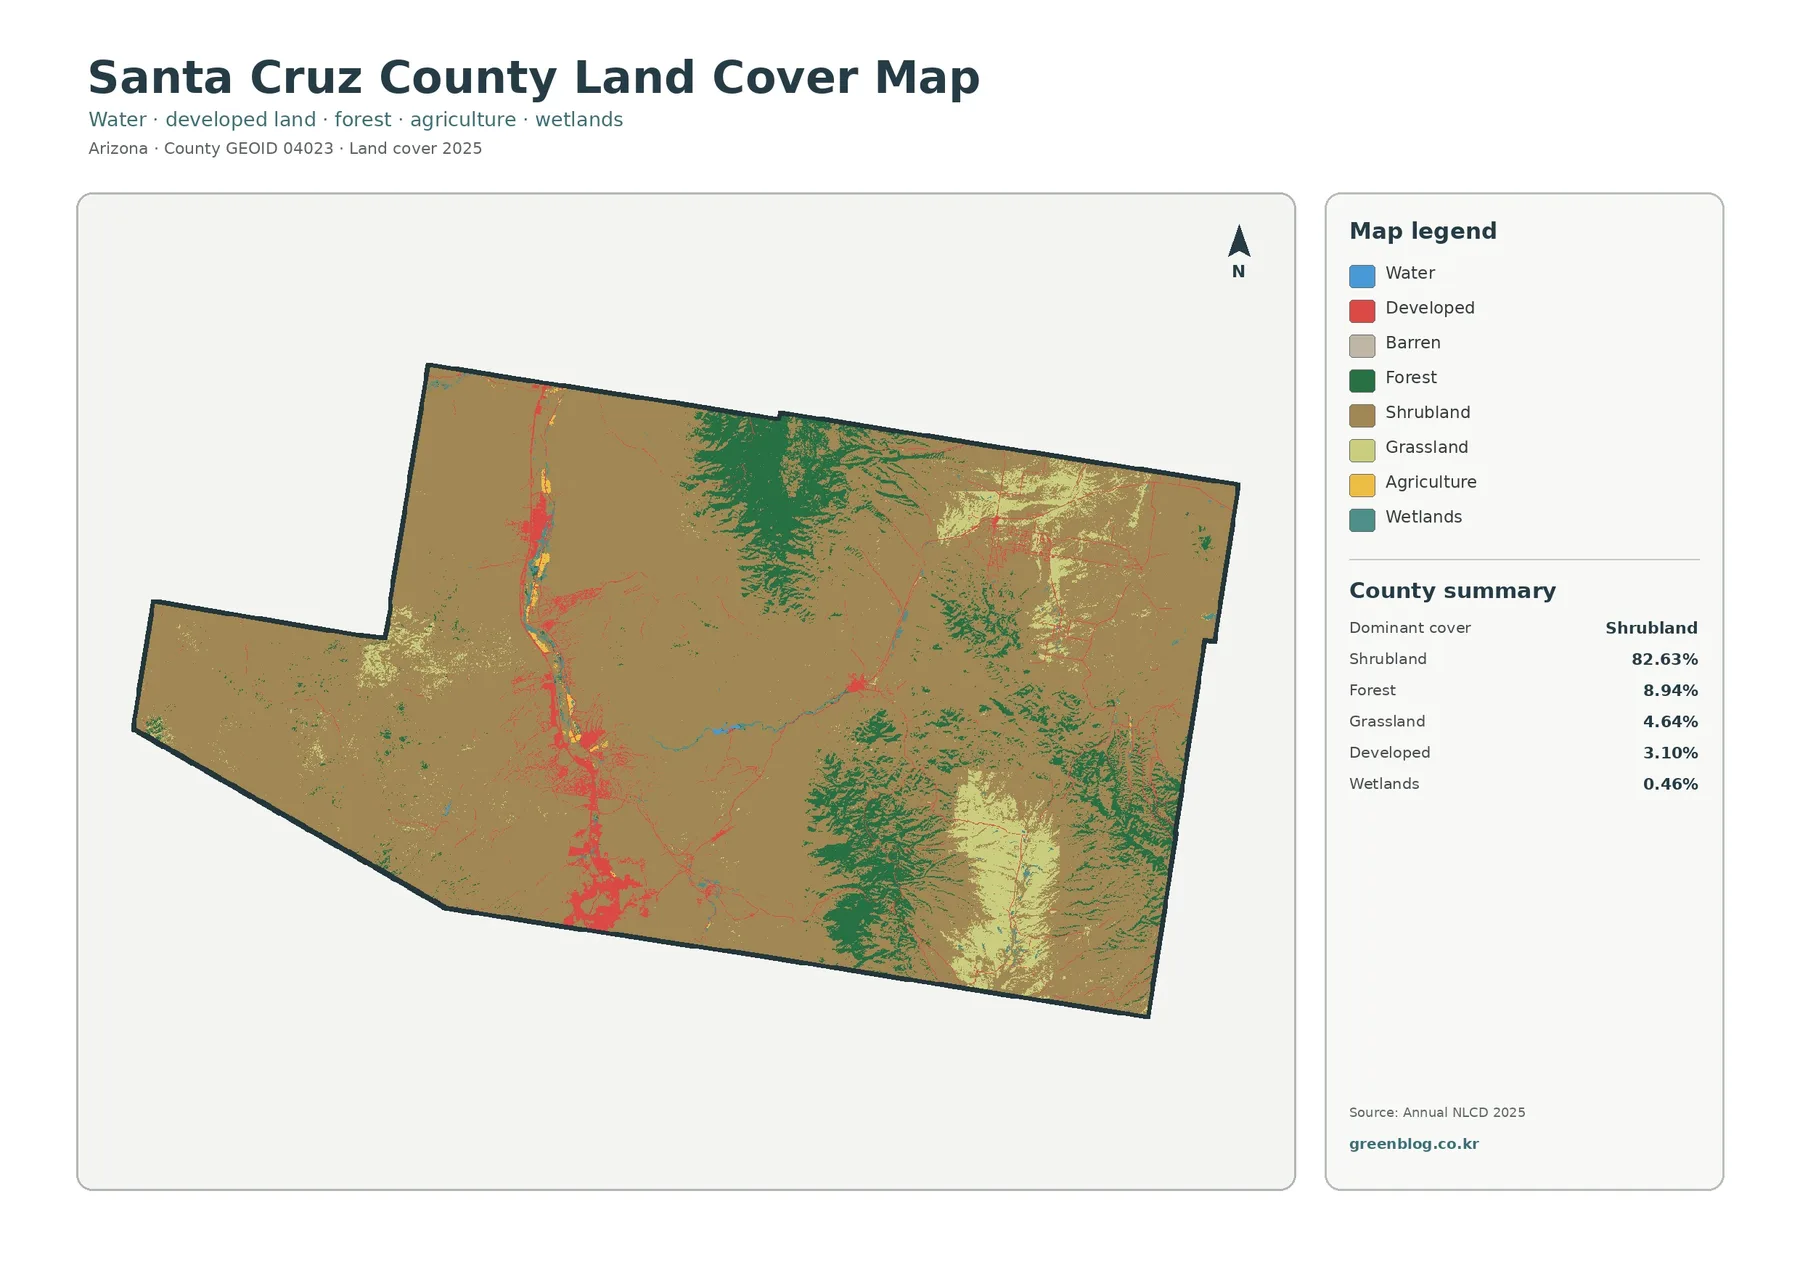
The general land-cover map displays water, developed land, barren cover, forest, shrubland, grassland, agriculture, and wetlands together. Shrubland occupies the largest continuous areas. Dark-green forest is much more concentrated, especially through portions of the central-northern and eastern half. Lighter grassland patches occur near and between some of those forested areas. Seeing all of these classes at once prevents the county from being reduced to a single “desert” category.
Developed land behaves differently. Red cells are concentrated in a long western corridor and become especially strong toward the south, with smaller developed areas appearing elsewhere. The map itself does not label every town or route, so individual red clusters should not be assigned a place name solely from shape. What the supplied image clearly supports is the broader observation that development is clustered in a limited part of Santa Cruz County rather than spread uniformly across the shrubland landscape.
Forest stands out more clearly when agriculture and open cover are simplified
The forest-and-farmland view reduces the number of competing classes and emphasizes forest, cropland, pasture/hay, shrub/grass, wetlands, water, and developed/other areas. This makes the 8.94% forest share much easier to follow than on the general map. Large green patches appear through parts of the central-northern and eastern county, with additional smaller patches elsewhere. They are significant at county scale but remain far less extensive than the dominant shrubland.
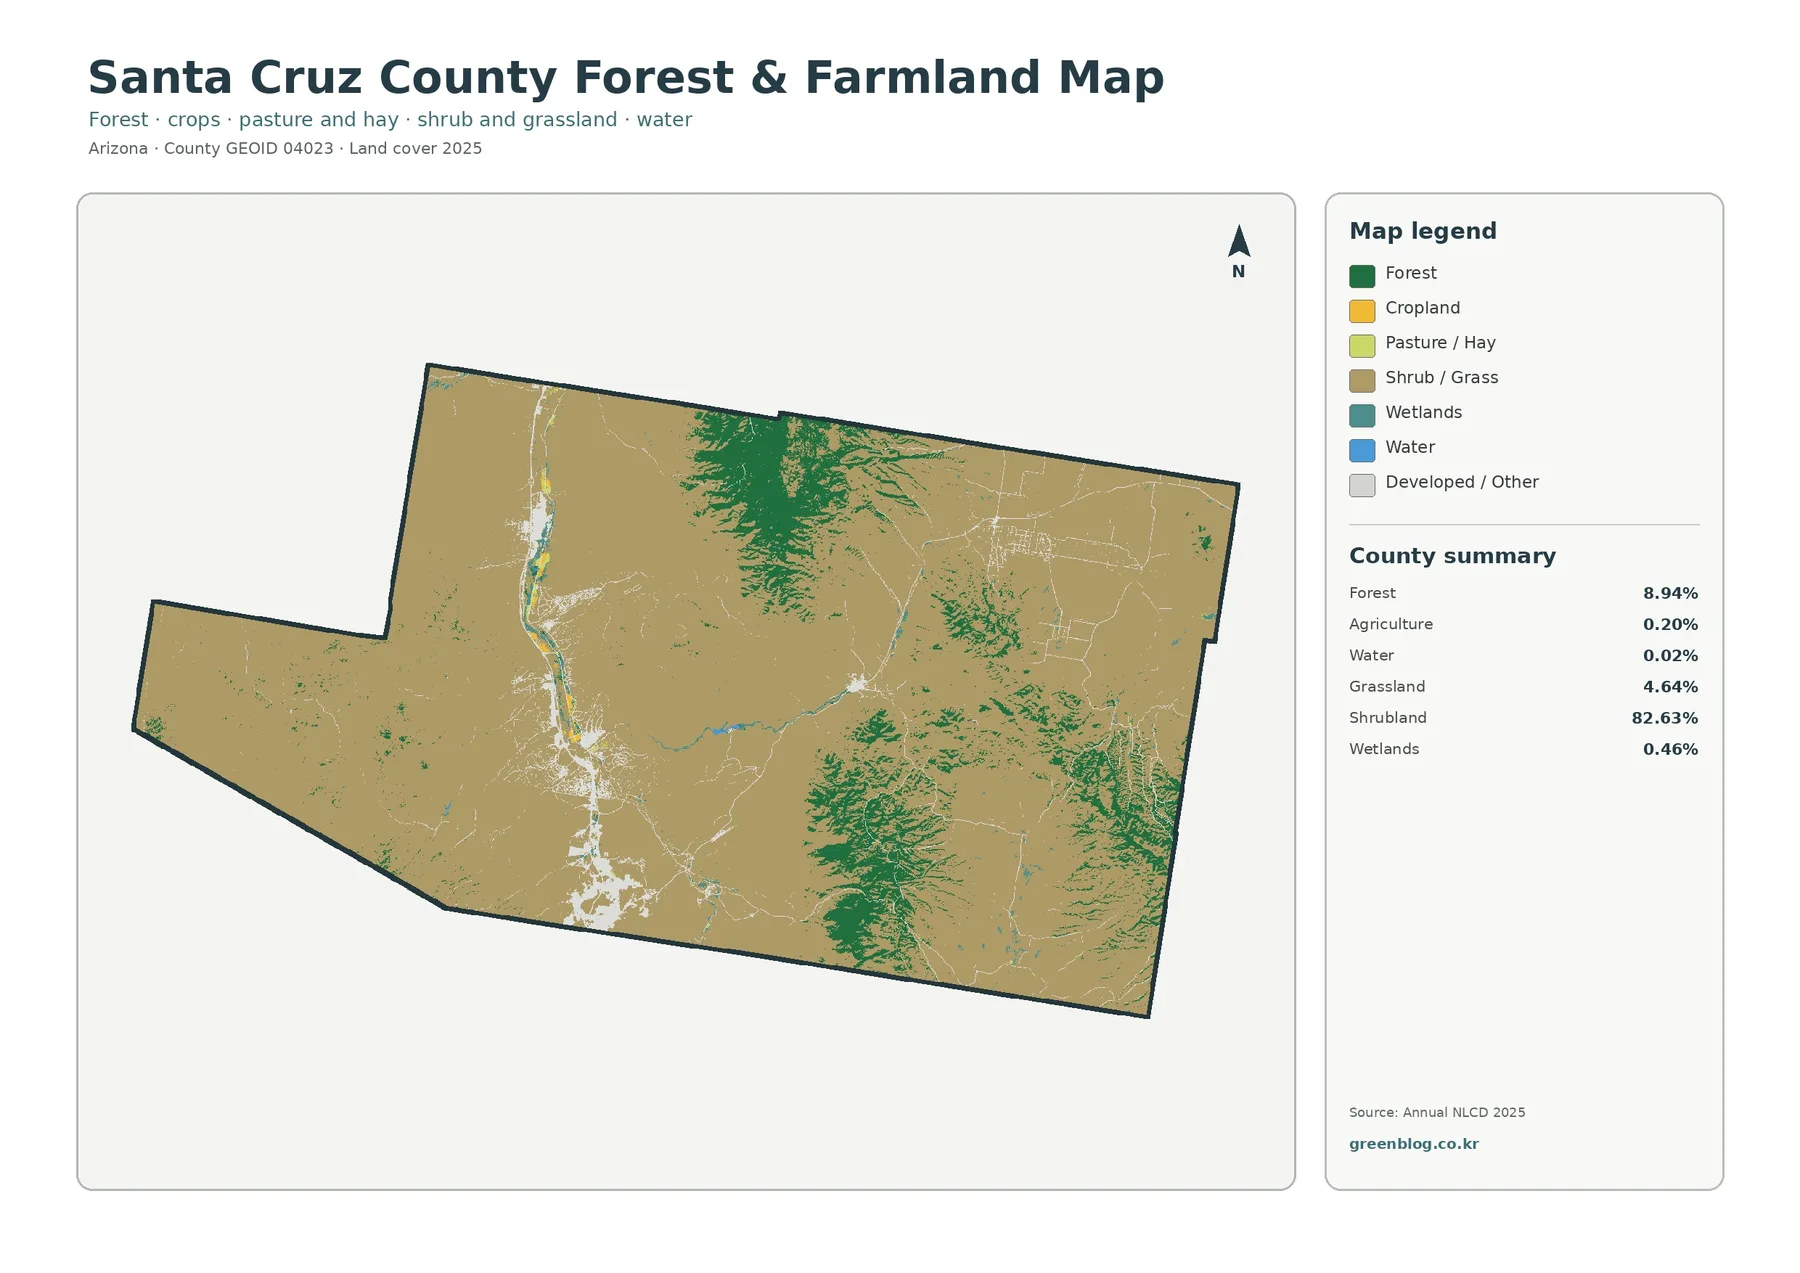
Agriculture tells a very different story. The county summary lists only 0.20% as agricultural cover, and the map shows relatively small yellow or pasture/hay areas compared with the broad shrub/grass background. That figure should not be confused with the importance of ranching or agriculture as economic and cultural activities. Land cover records the physical surface class detected in the imagery; land use describes how land is occupied, managed, or used by people.
That distinction matters in Santa Cruz County because local planning documents explicitly discuss ranching, agricultural heritage, working lands, and the rural character of areas such as Sonoita–Elgin. A working ranch can contain extensive shrub or grass cover rather than appearing as cropland in NLCD. The 0.20% agricultural land-cover value therefore cannot be used as a measure of the county’s agricultural economy, ranch acreage, or cultural importance.
Impervious cover isolates the areas with the strongest hard-surface signal
Impervious surface measures hard materials such as pavement, rooftops, and parking areas that resist water infiltration. It is related to development but is not the same measurement as the developed land-cover class. Santa Cruz County has 3.10% developed cover in the 2025 summary, while the countywide mean impervious value is 0.86%. A developed raster cell can include soil, shrubs, landscaped ground, and other permeable surfaces, so those two percentages are expected to differ.
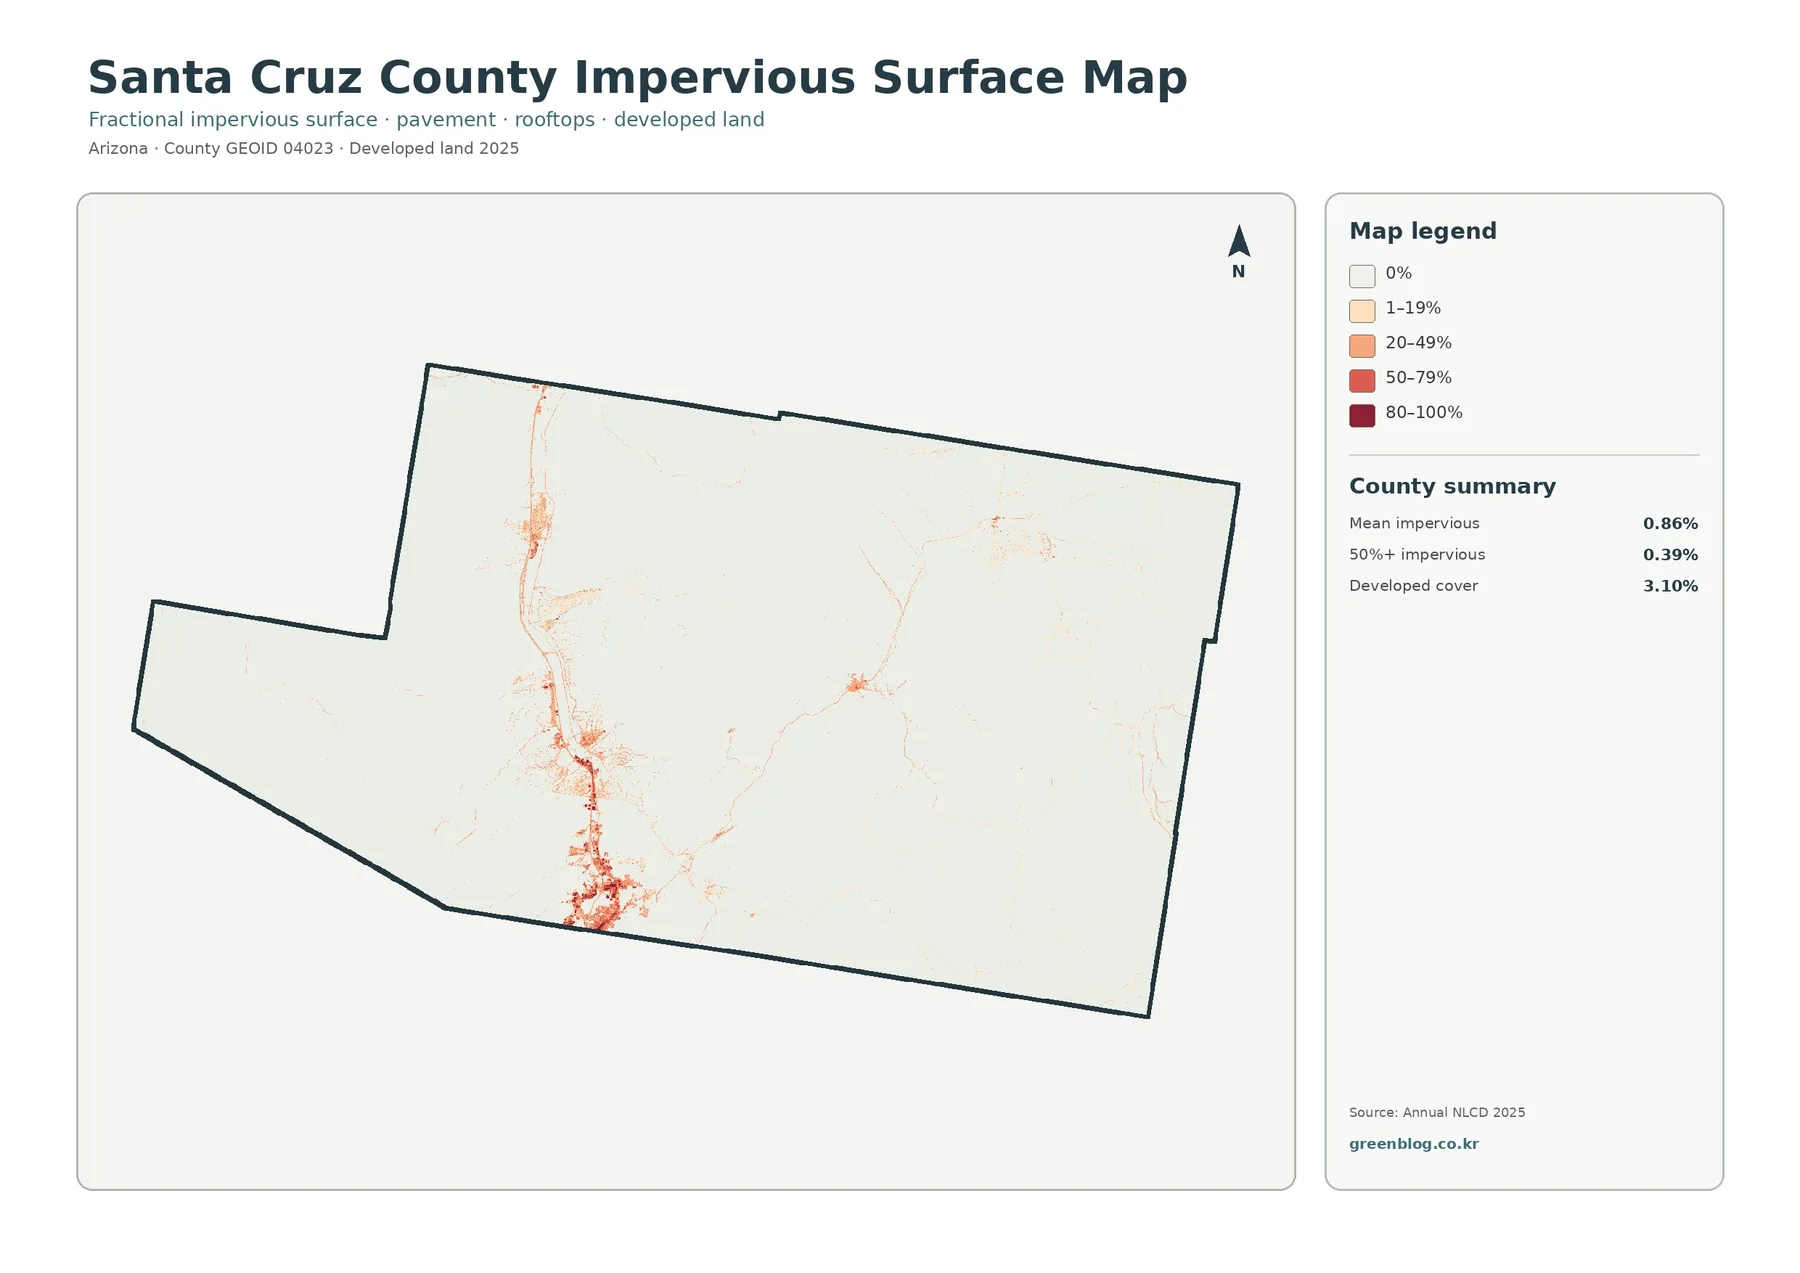
Most of the county is nearly white on the impervious view, indicating zero or low hard-surface fractions across the broad shrub-dominated areas. Orange and red values are far more concentrated along the western north–south corridor and toward the southern end of the county. The summary reports that cells with at least 50% impervious cover account for only 0.39% of the county. That number matches the visual impression that the densest built surfaces occupy a small footprint.
The 1985–2025 view records several kinds of class difference
The change map asks a different question from the 2025 overview. It marks locations where the mapped class in 1985 differs from the mapped class in 2025 and reports an overall class difference of 4.01%. The printed categories include 1.29% classified as changing to developed, 1.09% forest loss, 0.14% agricultural loss, and 1.48% other class difference. Wetland difference is shown in the legend but does not have its own printed percentage, so no additional value should be invented by subtraction.
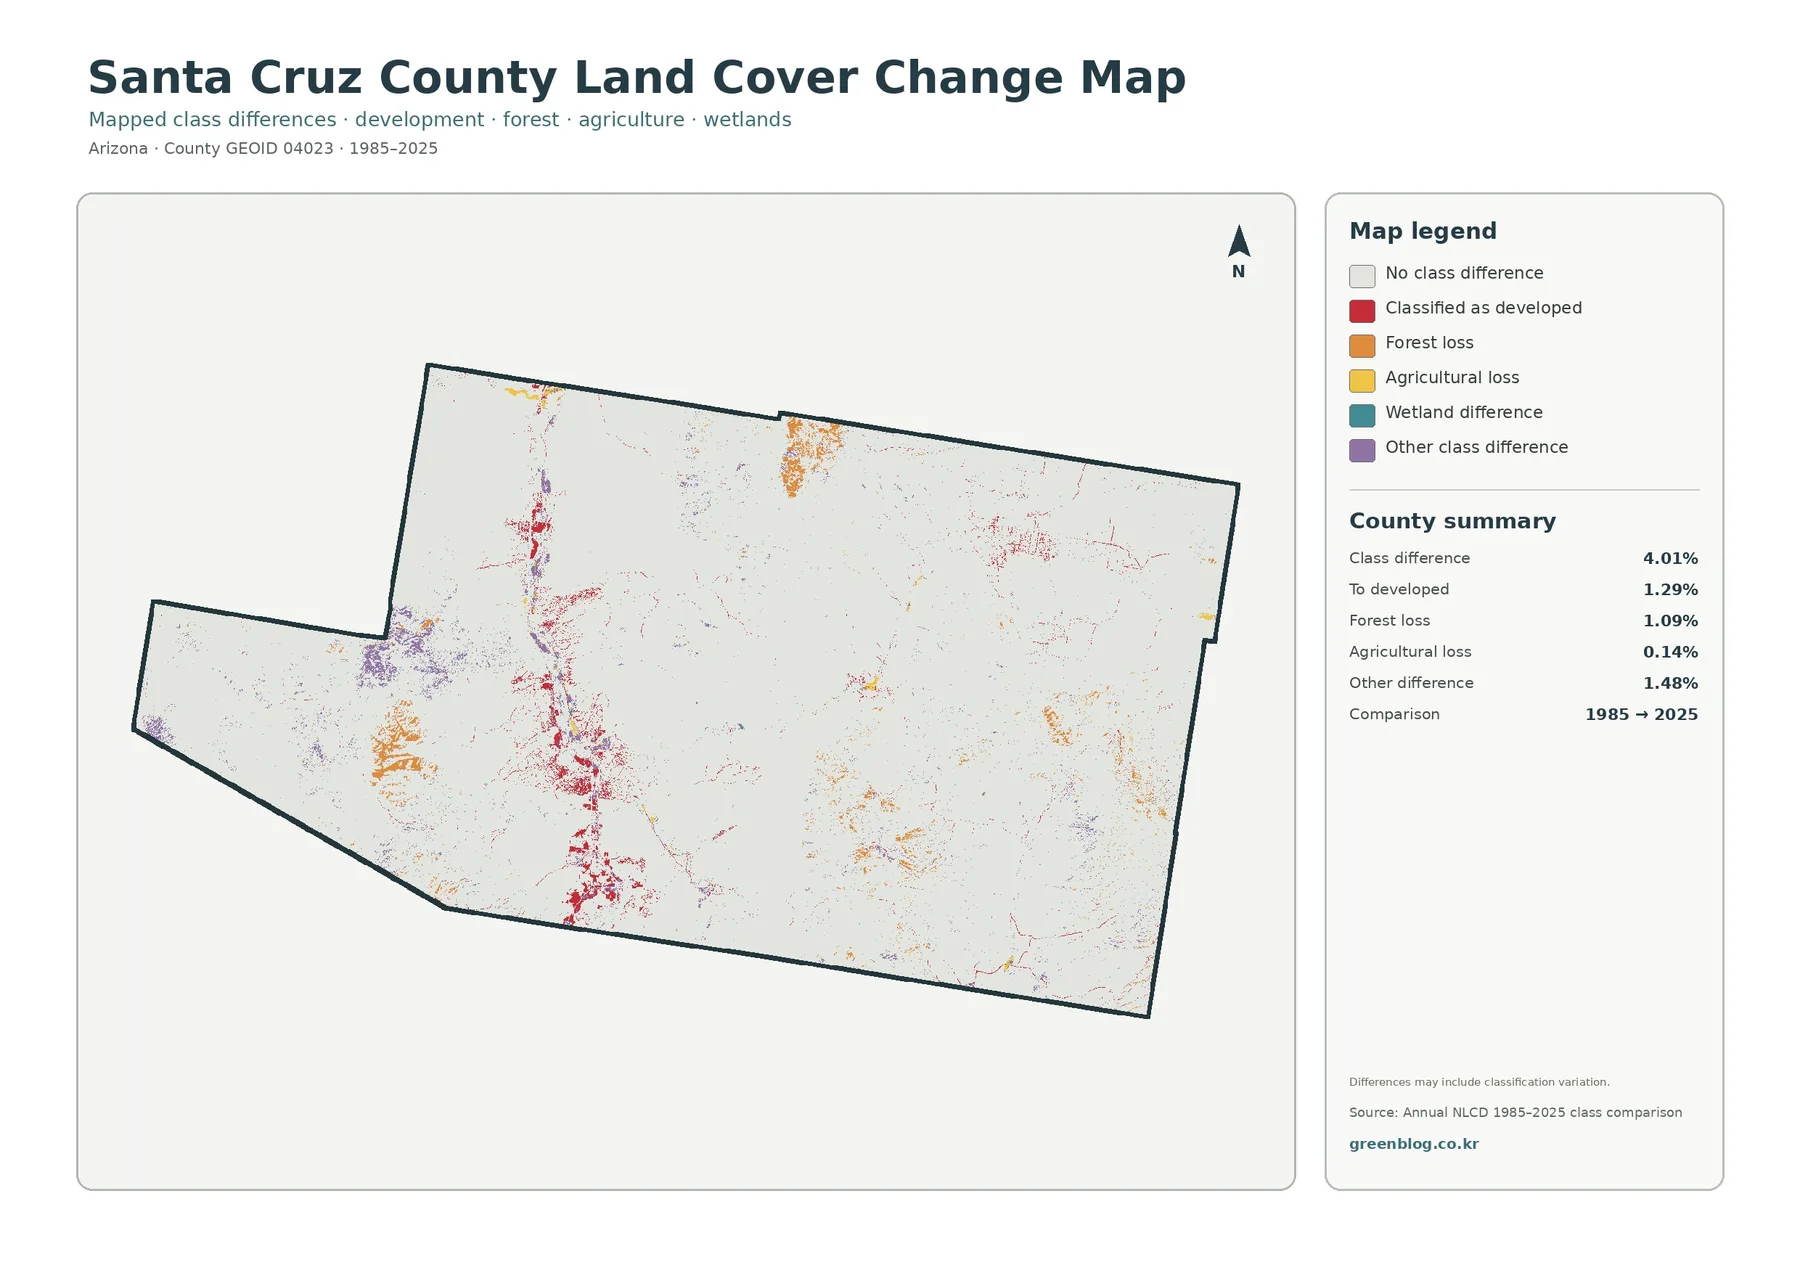
Red change-to-developed cells are most conspicuous through parts of the western corridor and near the south. Orange forest-loss patches occur in several locations, including central-northern and eastern areas, while purple other-class differences are scattered more broadly. Agricultural-loss marks are comparatively limited, consistent with their small 0.14% countywide summary. The pattern is not a single wave of change moving across the county; multiple class differences occur in separate locations.
A mapped class difference is not automatically a documented land-use event. A 30-meter cell can contain more than one surface, and the dominant class assigned to a mixed cell may differ between dates. Small shifts in class edges or classification conditions can also affect the comparison. The map itself notes that differences may include classification variation, so a red cell should not be treated as the surveyed footprint of a specific subdivision and an orange cell should not automatically be assigned a specific cause.
Download the four original JPG maps as one package
The ZIP contains four separate JPG files: current land cover, forest and farmland, impervious/developed land, and the 1985–2025 land-cover change map. A single file can be used when a report needs only one subject, while the complete set works well for side-by-side comparison. Keep the title and legend visible so readers can tell which classification and time frame they are viewing.
Each original image is 2480 × 1754 pixels. The package retains that source size rather than enlarging the files and presenting the result as higher resolution. For a large print, test the legend and the smaller patches at the intended output size before final production. In slides or documents, preserve the original aspect ratio so the county outline and legend do not stretch.
A 30-meter raster is designed for patterns, not parcel decisions
Annual NLCD is a raster product based on 30-meter cells. In practical terms, the surface is divided into square units and each unit receives a representative class or related value. One cell can contain shrubs, bare ground, a narrow road, part of a rooftop, grass, or water at the same time. The classification simplifies that mixture, so the colored edge between two classes should not be read as a surveyed property, field, or habitat boundary.
Land cover must also stay separate from land use. Cover describes the physical surface mapped as shrubland, forest, grassland, crops, water, wetlands, developed material, or another class. Land use concerns how people occupy, manage, regulate, or plan a place. A shrubland cell is not proof of protected status, and a developed cell does not establish ownership, zoning, a building right, or a permit.
Frequently Asked Questions
What is the dominant land cover in Santa Cruz County?
Shrubland is the dominant 2025 class at 82.63%. Forest accounts for 8.94%, grassland 4.64%, and developed cover 3.10%, with much smaller shares for wetlands, agriculture, and open water. These are countywide land-cover percentages, not parcel-level determinations.
Why is developed cover 3.10% while mean impervious cover is only 0.86%?
They measure different things. Developed cover is a land-cover class, while impervious percentage estimates the share of a cell occupied by hard surfaces such as pavement and rooftops. A developed cell can contain vegetation and soil, so its entire area is not necessarily impervious. Cells with at least 50% impervious cover account for 0.39% of the county.
Map File Information
Santa Cruz County Land Cover Four-Map Package
- File Type: Four JPG files in one ZIP archive
Related Maps
- Apache County Arizona Land Cover Map
- Cochise County Arizona Land Cover Map
- Coconino County Arizona Land Cover Map
Sources and further reading
- MRLC Annual NLCD Data — official access point for Annual NLCD land-cover products and related datasets.
- USGS Annual NLCD Land Cover Classification — explains the classes and 30-meter land-cover framework used by Annual NLCD.
- U.S. Census Bureau TIGER/Line Shapefiles — official reference for county and state geographic boundaries.
- Santa Cruz County 2026 Comprehensive Plan — current county planning update covering natural resources, land use, water, growth, and community goals.
- Santa Cruz County 2016 Comprehensive Plan — county-specific planning context for Rio Rico, the I-19 corridor, Tubac, Sonoita–Elgin, and resource protection.
Green Map creates custom-edited map images using open geographic data sources such as geoBoundaries, Natural Earth, OpenStreetMap, and government open data.
These maps are edited visual materials, not raw data files, and are provided for education, documents, presentations, and graphic reference.