The Graham County Arizona Land Cover Map set is useful for comparing a county that is overwhelmingly shrub-covered with much smaller but highly visible forest, farm, river, and developed areas. The 2025 summary lists shrubland at 79.44%, forest at 14.99%, grassland at 2.14%, agriculture at 1.56%, and developed land at 0.91%. The maps become especially informative around the Gila River corridor, where agriculture and settlement stand out against the broad shrubland background.
This page includes four views: general land cover, forest and farmland, impervious surface/developed land, and a 1985–2025 class-change comparison. The four original 2480 × 1754 JPG maps are available together from the download section after the map explanations. They are suitable for classroom reference, presentation graphics, and county-scale environmental comparison, but they are not parcel, zoning, ownership, flood, or construction maps.
Table of Contents
The built footprint is small, but it is easy to find along the central Gila Valley
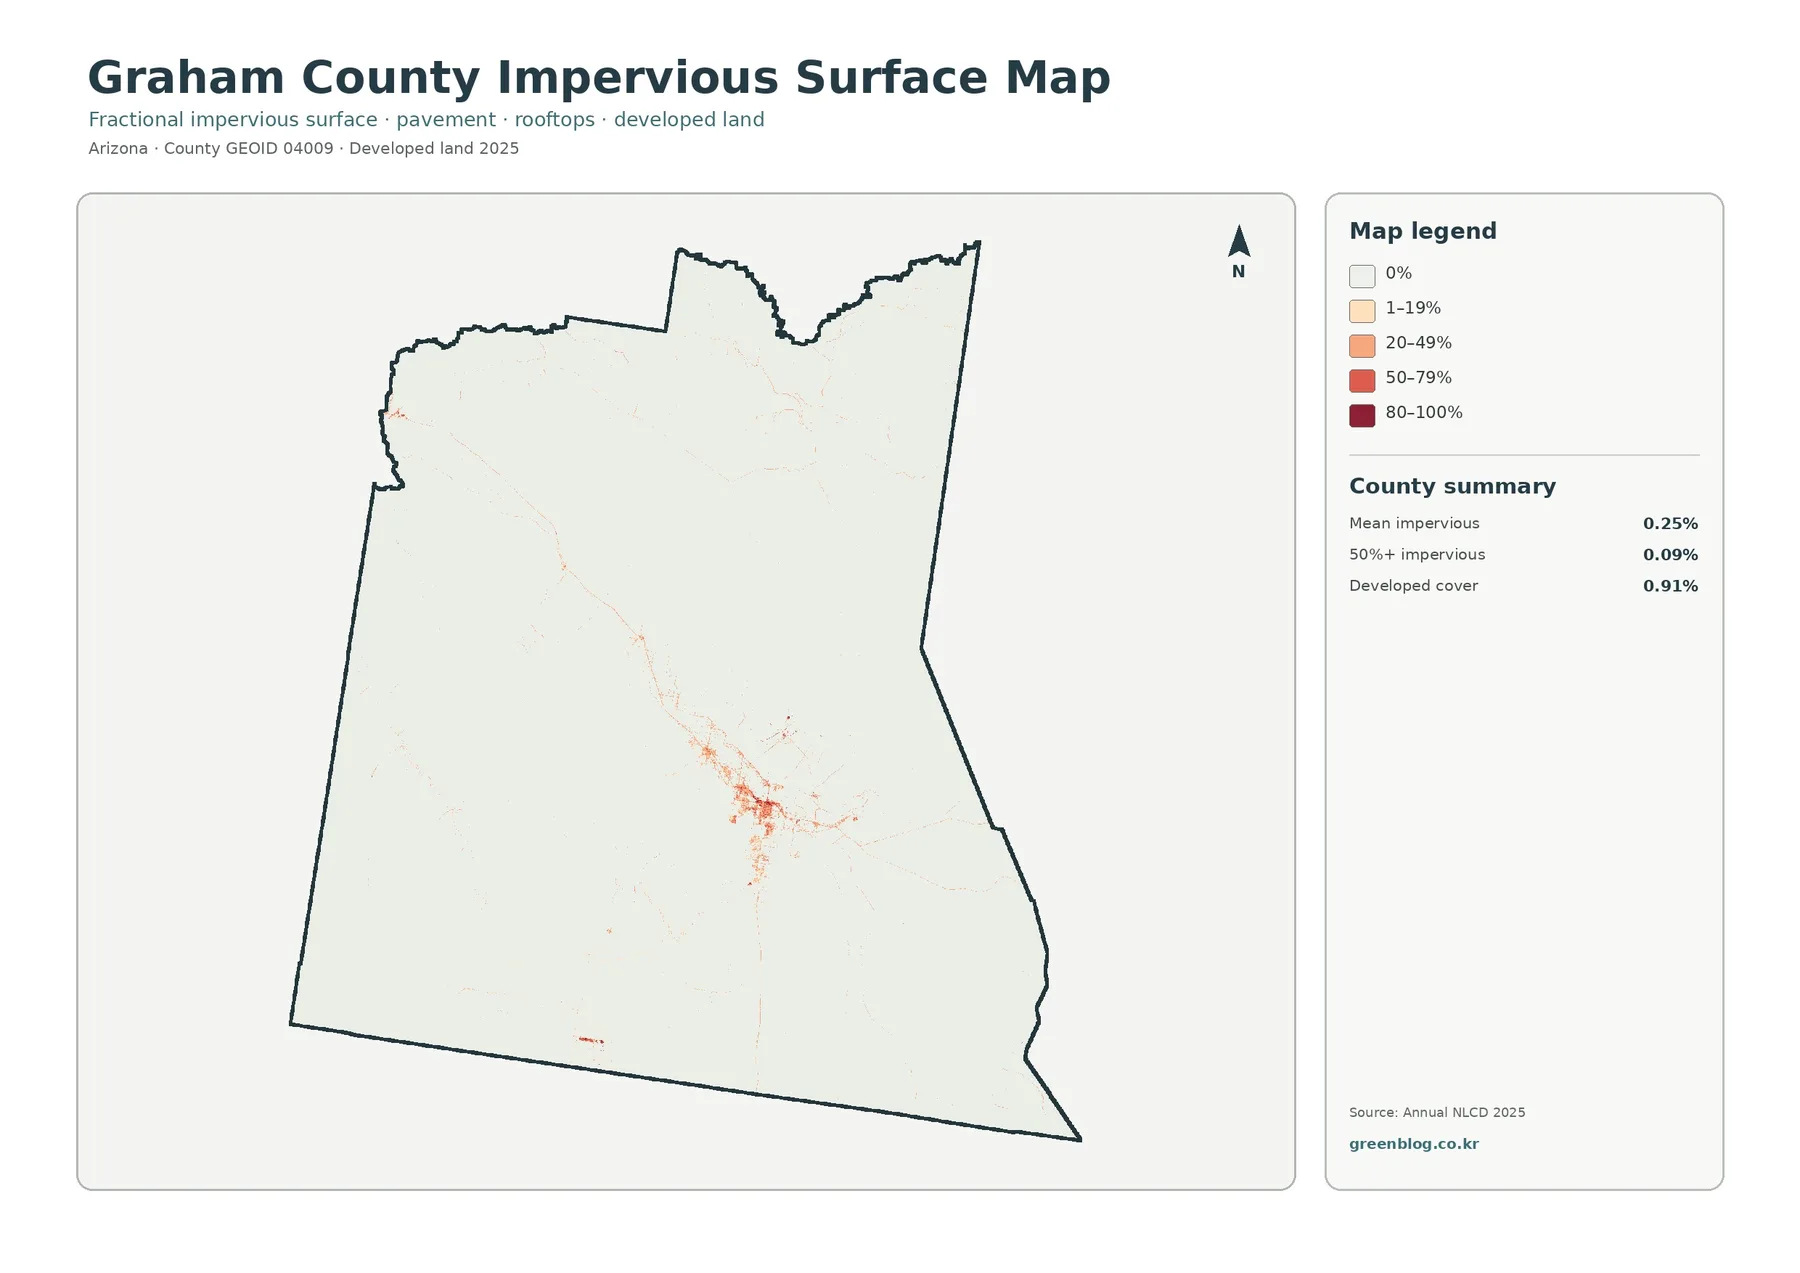
Most of the impervious-surface map is almost white. That visual result matches a countywide mean imperviousness of just 0.25%. The clearest cluster of orange and red cells appears in the central part of Graham County, where Safford and Thatcher sit in the Gila Valley. Smaller linear marks extend away from that concentration, while the large northern, western, and southern areas remain lightly colored.
Impervious surface means hard material such as pavement and rooftops that prevents or limits water from soaking into the ground. It should not be confused with the 0.91% developed land-cover share. A cell classified as developed can still contain soil, trees, yards, or other permeable ground. The 0.09% figure for cells that are at least 50% impervious is narrower again, so all three values describe different aspects of the built landscape.
Graham County’s official visitor page identifies Safford as the county seat and Pima and Thatcher as towns, with U.S. Route 70 and U.S. Route 191 among the major highways. The map is not detailed enough to identify individual roads reliably, but the concentration of hard surfaces around the central communities is clear. For street-level work, the impervious map should be paired with a current road or parcel map rather than treated as a transportation map.
Shrubland covers nearly four-fifths of the county, with forest concentrated in mountain areas
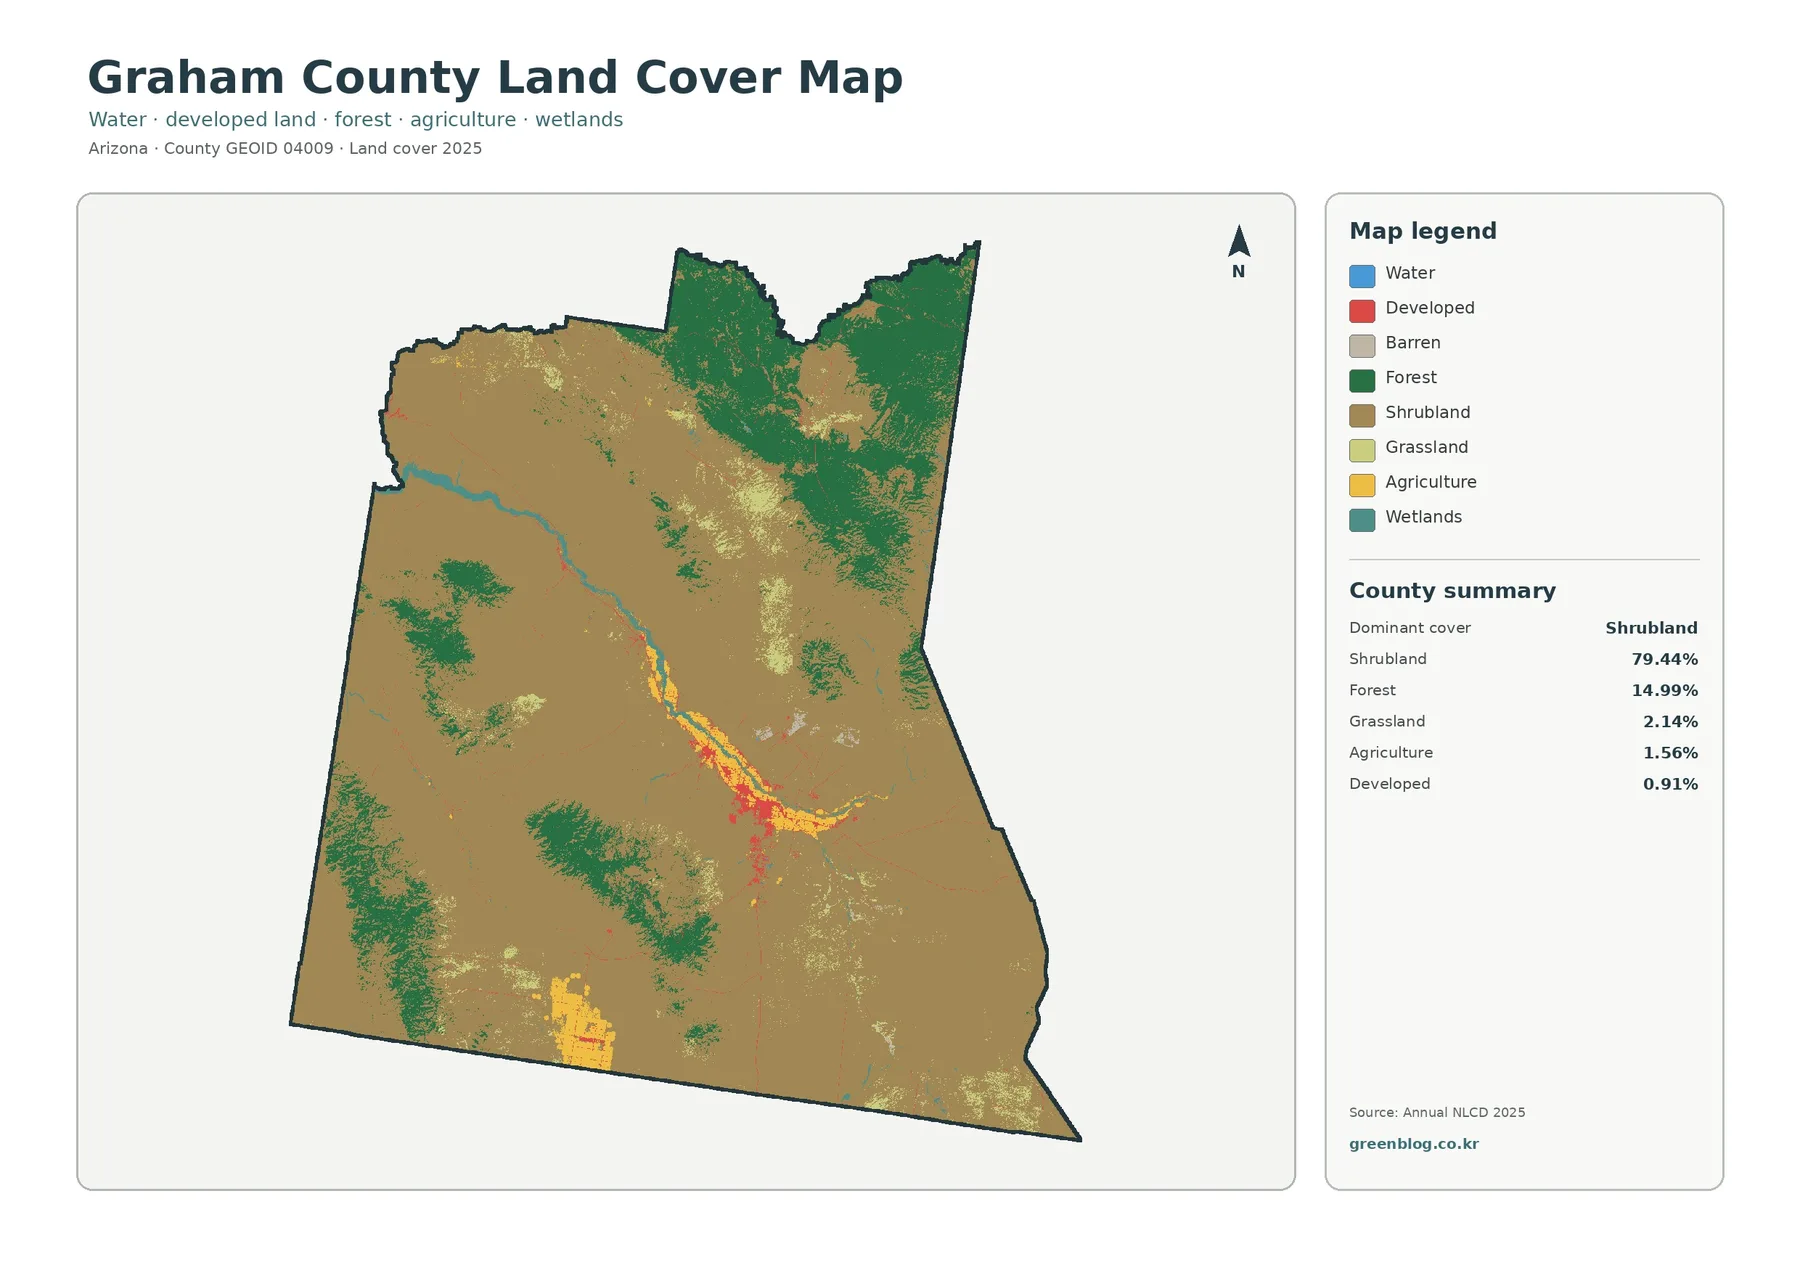
Brown shrubland is the dominant surface across the western, central, and southeastern parts of the county. Forest occupies a much smaller share overall, yet its geography is easy to recognize because the darkest green areas form broad patches in the northeast and in several mountain areas south and southwest of the Gila Valley. The contrast makes Graham County a good example of why countywide percentages and map location should be read together.
Grassland at 2.14%, agriculture at 1.56%, and developed land at 0.91% are modest countywide shares. Agriculture and development, however, are not spread evenly. Yellow and red cells are more noticeable near the central river valley than across the broad shrub-covered areas. A small percentage can therefore be highly important for understanding where people live, travel, and farm even when it occupies little of the county’s total area.
Land cover is a classification of the surface, not a legal description of land use. A shrubland pixel does not tell the reader whether the land is federal, tribal, state, or private. Likewise, a forest-colored area is not automatically inside a national forest boundary. The maps are best used to compare surface types; jurisdiction, ownership, zoning, and permitted use require separate official records.
Agriculture follows the Gila River corridor instead of spreading across the county
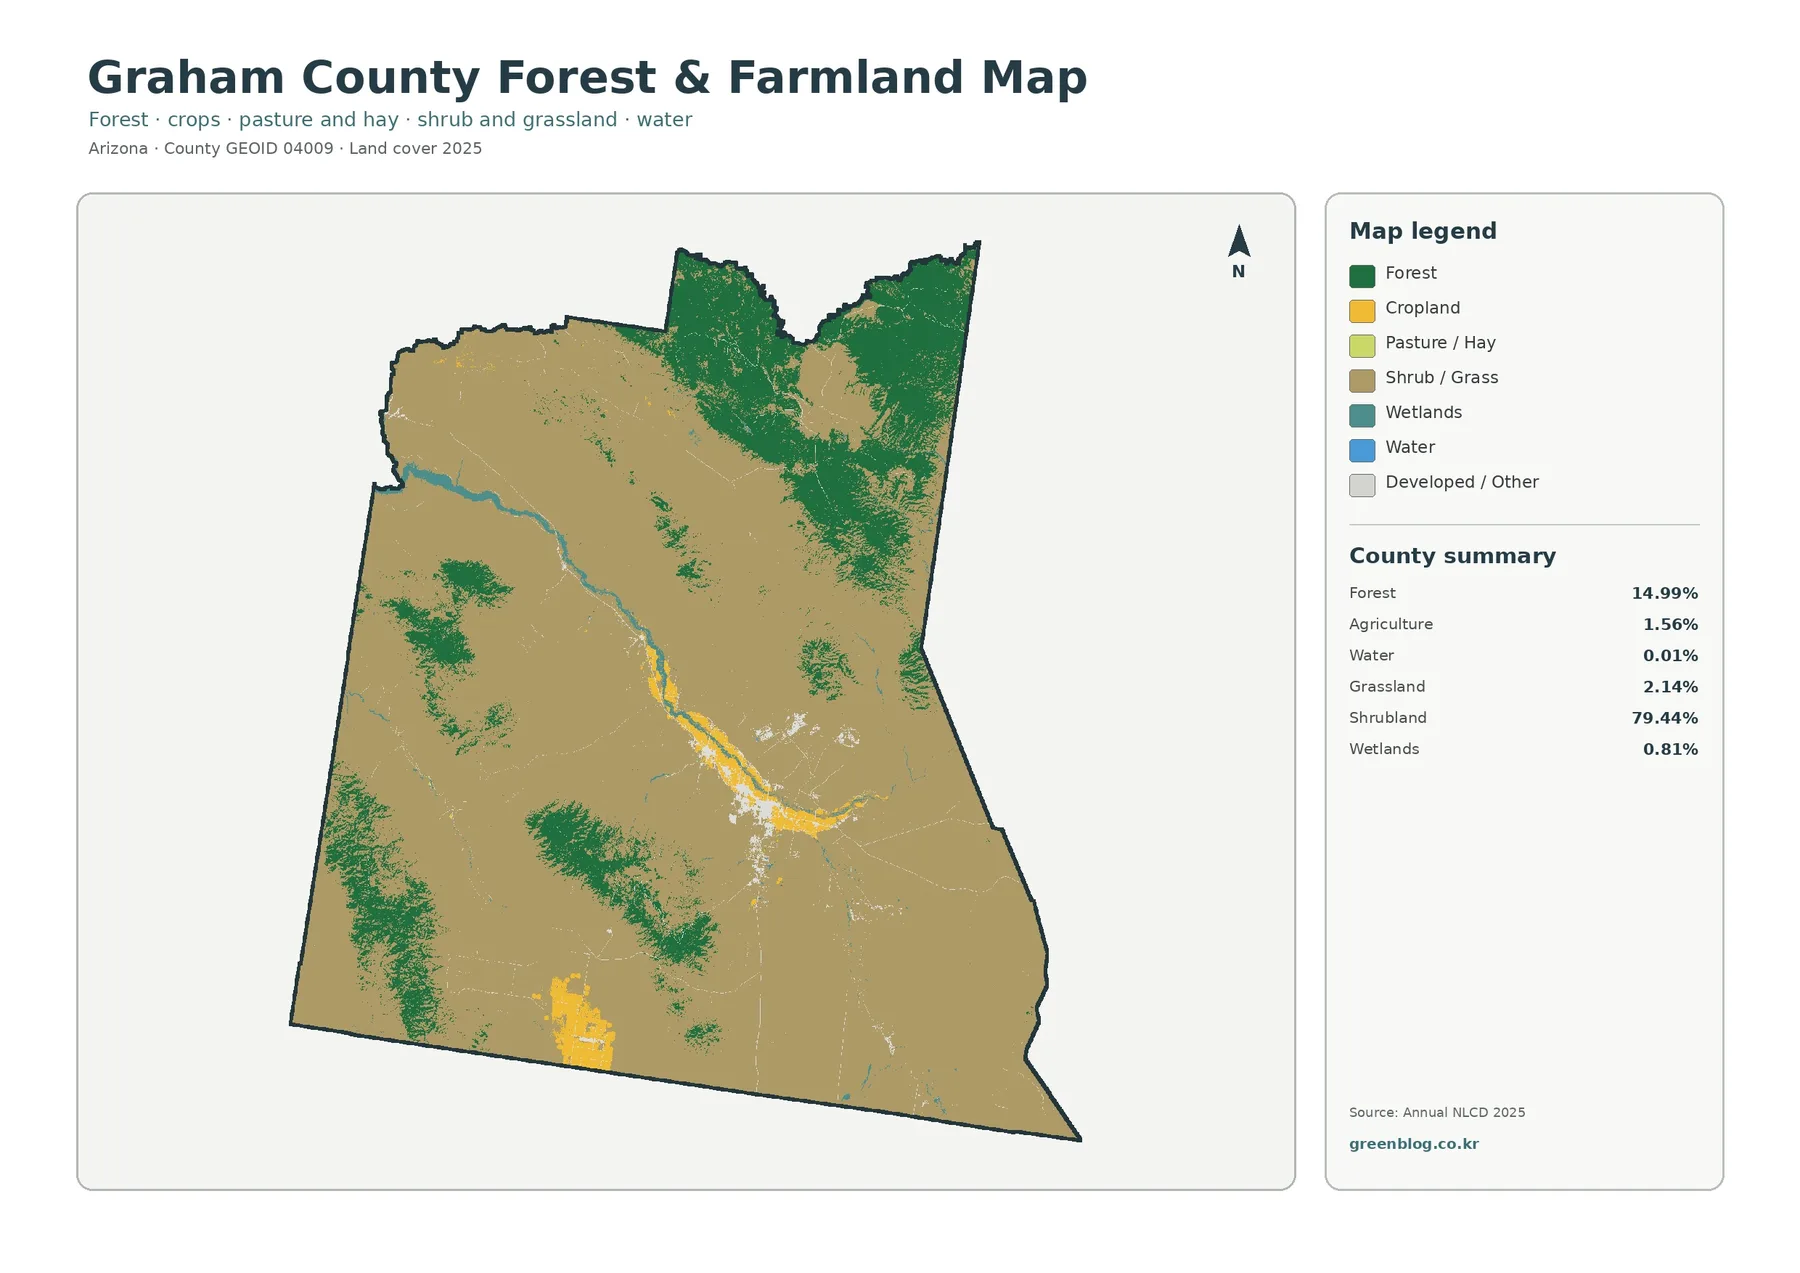
The simplified forest-and-farmland view makes the Gila Valley easier to follow. Yellow agricultural cells form a visible strip through the central county near the river and the Safford–Thatcher–Pima area rather than appearing evenly across the map. Graham County’s own visitor material describes the county as lying along the Gila River, and a county news feature highlights both the river and the area’s agricultural heritage. Those sources provide useful local context for the mapped concentration without turning the land-cover map into a farm-boundary map.
Agriculture accounts for 1.56% of the county in the 2025 summary. That number is small because Graham County is large and mostly shrub-covered, not because farming is invisible in the valley. The map shows why spatial concentration matters: the yellow cells are easy to see where they line portions of the Gila corridor. Exact crop type, farm ownership, irrigation source, or cultivated acreage cannot be determined from these colors and should come from agricultural or water-management records.
Wetlands account for 0.81%, while mapped water is only 0.01%. Even with that tiny water percentage, the Gila River remains recognizable as a narrow feature crossing the western and central county. Wetland cells occur near portions of the river and other drainage areas. These classes are useful for regional habitat or watershed discussion, but they are not regulatory wetland boundaries and do not show flood depth, flood probability, or current streamflow.
The map also includes agricultural patches near the southern edge. The visible classification is enough to note their presence, but it does not identify what is grown there or whether the fields are currently active. Keeping that distinction matters on a map-download page: the raster product provides a countywide surface classification, while local agricultural questions need more specific records.
Only 0.31% is mapped as transition to developed in the 1985–2025 comparison
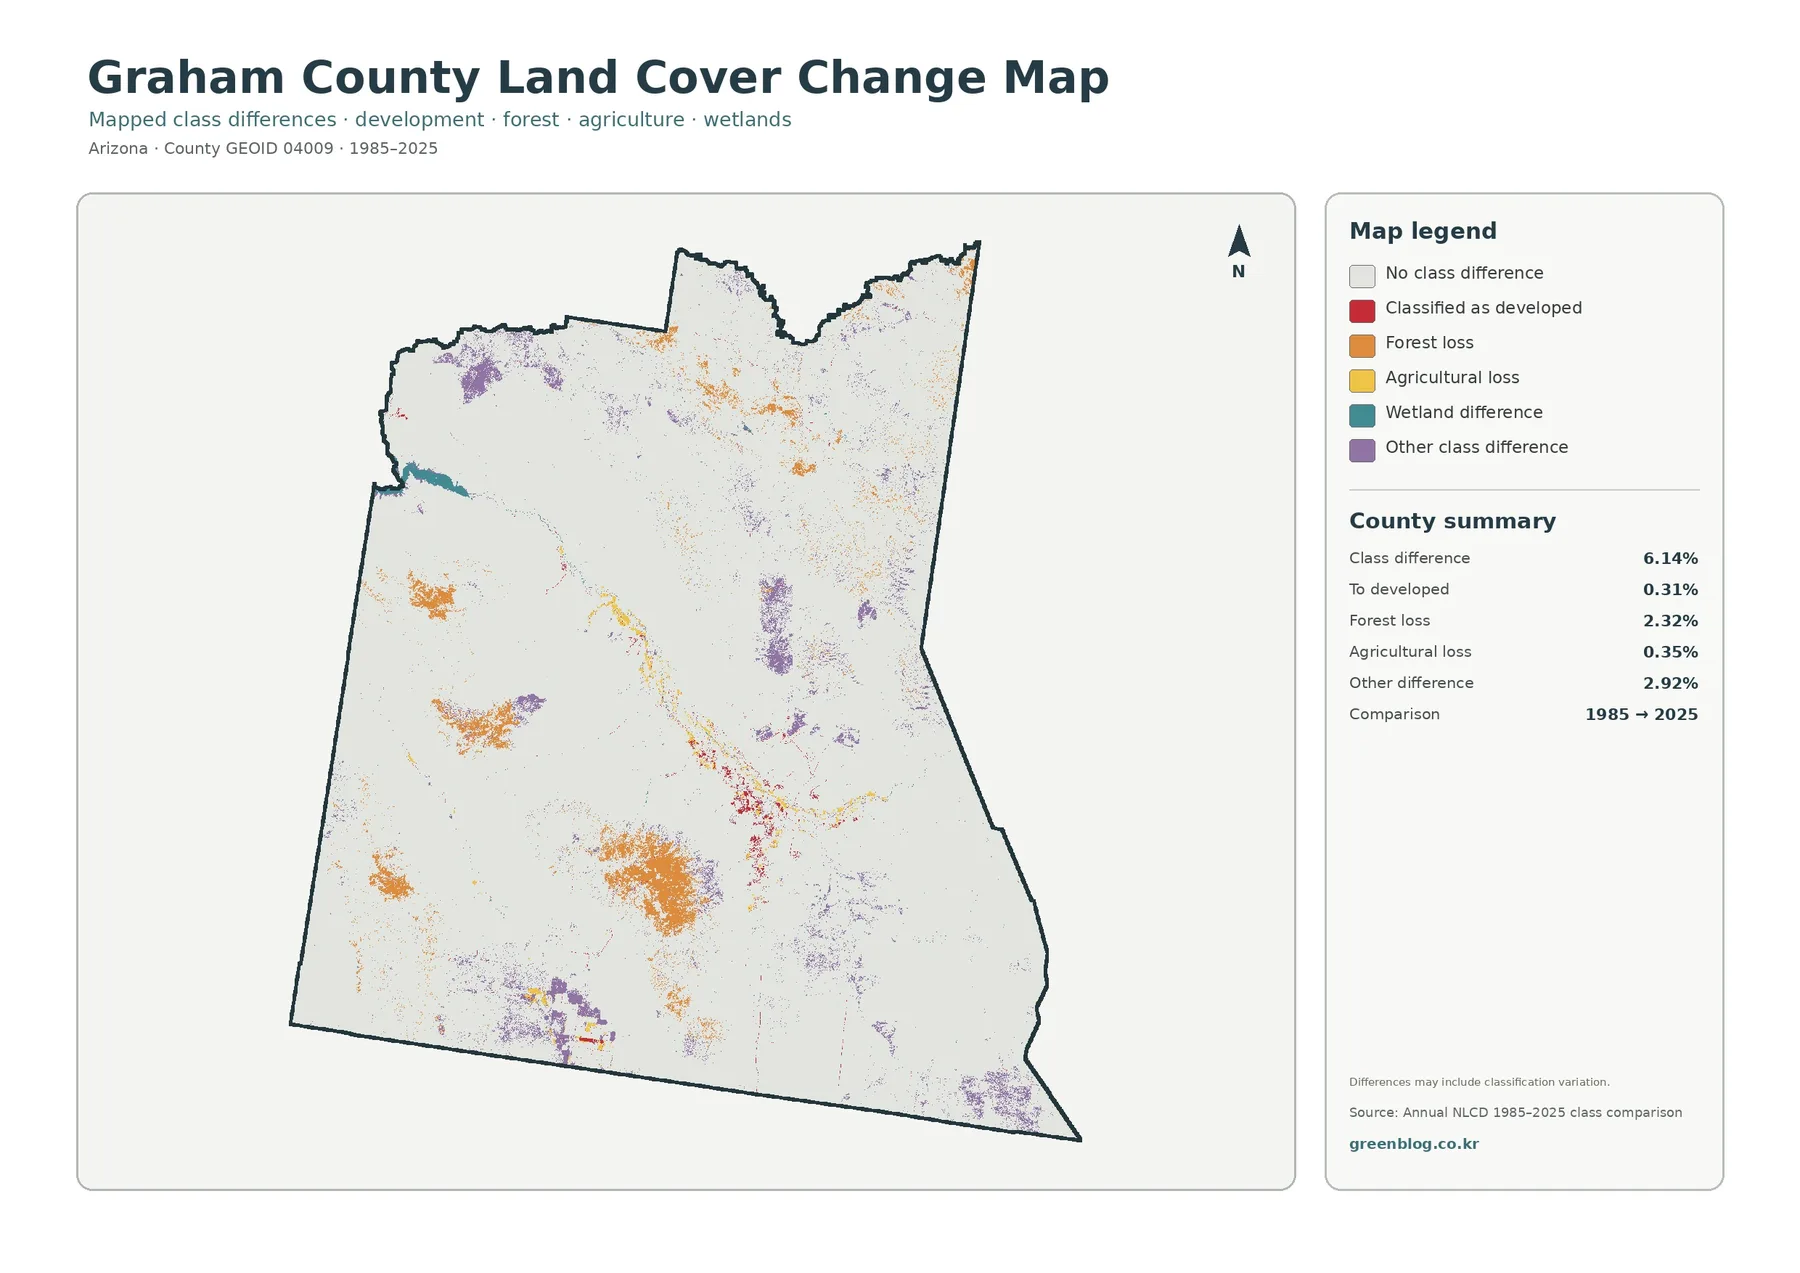
The change map reports a 6.14% total class difference between the 1985 and 2025 classifications. That figure is not a development rate. Only 0.31% is specifically labeled as transition to developed. Forest loss is listed at 2.32%, agricultural loss at 0.35%, and other class difference at 2.92%. Reading these categories separately is necessary because the total combines several kinds of change.
Orange forest-loss marks are visible in several southern mountain areas and parts of the northeast. Purple other-class differences appear in multiple western, central, and southern locations. Red developed-transition cells are more limited and tend to occur around the established central valley communities. The scattered distribution is a reminder that no single process explains every cell that changed class.
A forest-loss color does not reveal the cause of the change. Fire, vegetation recovery, timber activity, drought, management, mapping uncertainty, or another factor would need evidence from other records. The map is most useful for finding locations where the classifications differ and deciding where a more detailed historical image or resource-management record should be consulted.
Mount Graham provides a useful local reference for the county’s forested high country
Graham County’s official visitor page notes that the county was named for Mount Graham and describes the county as being located along the Gila River. A county feature also lists Mount Graham, the Gila River, and the Gila Box Riparian Conservation Area among important local natural features. Those place names help readers connect the abstract land-cover classes to familiar geography without changing what the raster colors mean.
The darker forest areas south of the central valley and in other mountain zones make a sharp visual contrast with the much larger shrubland areas. The Arizona Natural Resource Conservation Board’s Gila Valley NRCD page describes the Graham–Greenlee area as a landscape of high mountain ranges and low desert plains along the Gila River. That broad description is consistent with the map’s alternating shrub and forest areas, although the land-cover image itself does not provide elevation contours or ecological-zone boundaries.
Management boundaries should still be kept separate from the surface classification. National forests, conservation areas, tribal lands, and private land can contain more than one land-cover class. If the question is who manages a particular mountain or river parcel, the correct source is an official land-status map. If the question is whether the surface is mostly shrubland, forest, developed land, or agriculture at county scale, these maps are appropriate.
Use each map for a different question
- Countywide pattern: use the general map to compare the 79.44% shrubland majority with the main forest zones.
- River and farming: use the forest-and-farmland map to follow agriculture, wetlands, and vegetation along the Gila Valley.
- Built concentration: use the impervious map to locate the strongest pavement and rooftop concentration around Safford and nearby communities.
- Historical comparison: use the change map to locate 1985–2025 class differences while keeping development, forest loss, agriculture loss, and other changes separate.
For a classroom lesson, a useful sequence is to begin with the general map, then move to the forest-and-farmland view to discuss the Gila Valley, and use imperviousness to show how compact the built footprint is. The change map works best at the end because students already understand the current pattern before looking at where the classification differs from 1985.
A presentation does not need all four maps on one slide. If the topic is agriculture and water, the forest-and-farmland view communicates the main idea more clearly. If the topic is development, the impervious map is much more direct. For environmental comparison, pairing the current land-cover map with the change view helps distinguish what is present now from what has been classified differently over time.
The 30-meter grid simplifies small features
Annual NLCD land-cover products divide the landscape into raster cells, which can be understood as a grid of small squares. At roughly 30 meters, a single cell may contain road surface, buildings, soil, shrubs, and a narrow field but still receive one representative class. Small roads, thin riparian strips, field edges, and scattered structures can therefore look simpler than they do on high-resolution aerial imagery.
The current maps use the 2025 classification, so changes after that observation year are not included. The 1985–2025 comparison also reflects differences between two mapped classifications rather than a complete record of every event during the forty-year period. Boundary cells, mixed surfaces, and classification uncertainty can contribute to small differences. Parcel decisions, engineering, legal questions, flood safety, and current development review require newer and more detailed sources.
Download the four Graham County land-cover JPG maps
Frequently Asked Questions
Why is developed land 0.91% when mean imperviousness is only 0.25%?
The two measures describe different things. Developed land is a land-cover class that can include vegetation and soil within a built setting. Imperviousness estimates the share covered by hard surfaces such as pavement and rooftops, so the countywide mean can be lower than the developed land-cover share.
Does the 1.56% agriculture value represent only farms beside the Gila River?
No. Agriculture is visibly concentrated along parts of the Gila Valley, but agricultural cells also appear elsewhere. The 1.56% figure is a countywide land-cover summary and does not define individual farms, irrigation districts, crop types, or property boundaries.
Is the 6.14% class difference a development rate?
No. It is the total share assigned to different land-cover classes in the 1985 and 2025 comparison. The transition to developed class is a separate 0.31%, while forest loss, agricultural loss, and other differences are listed separately.
Map File Information
Graham County Land-Cover Map Files
- Included Files: Use only the versions confirmed in the article and supplied images
- File Type: Use the confirmed download contents
- Intended Use: Printing, education, presentations, and map-based projects
Related Maps
- Apache County Arizona Land Cover Map
- Cochise County Arizona Land Cover Map
- Coconino County Arizona Land Cover Map
Sources and reference links
- MRLC Annual NLCD Data — land-cover and impervious-surface data access
- USGS Annual NLCD Land Cover Classification — land-cover class definitions and methodology context
- U.S. Census Bureau TIGER/Line Shapefiles — county boundary reference
- Graham County Visitors — Gila River, Mount Graham, Safford, Pima, Thatcher, and major highways
- Graham County: A thriving community with natural wonders — county agriculture, Gila River, Mount Graham, and natural areas
- Arizona Natural Resource Conservation Board: Gila Valley NRCD — regional Gila River, mountain, and desert-plain context
Green Map creates custom-edited map images using open geographic data sources such as geoBoundaries, Natural Earth, OpenStreetMap, and government open data.
These maps are edited visual materials, not raw data files, and are provided for education, documents, presentations, and graphic reference.