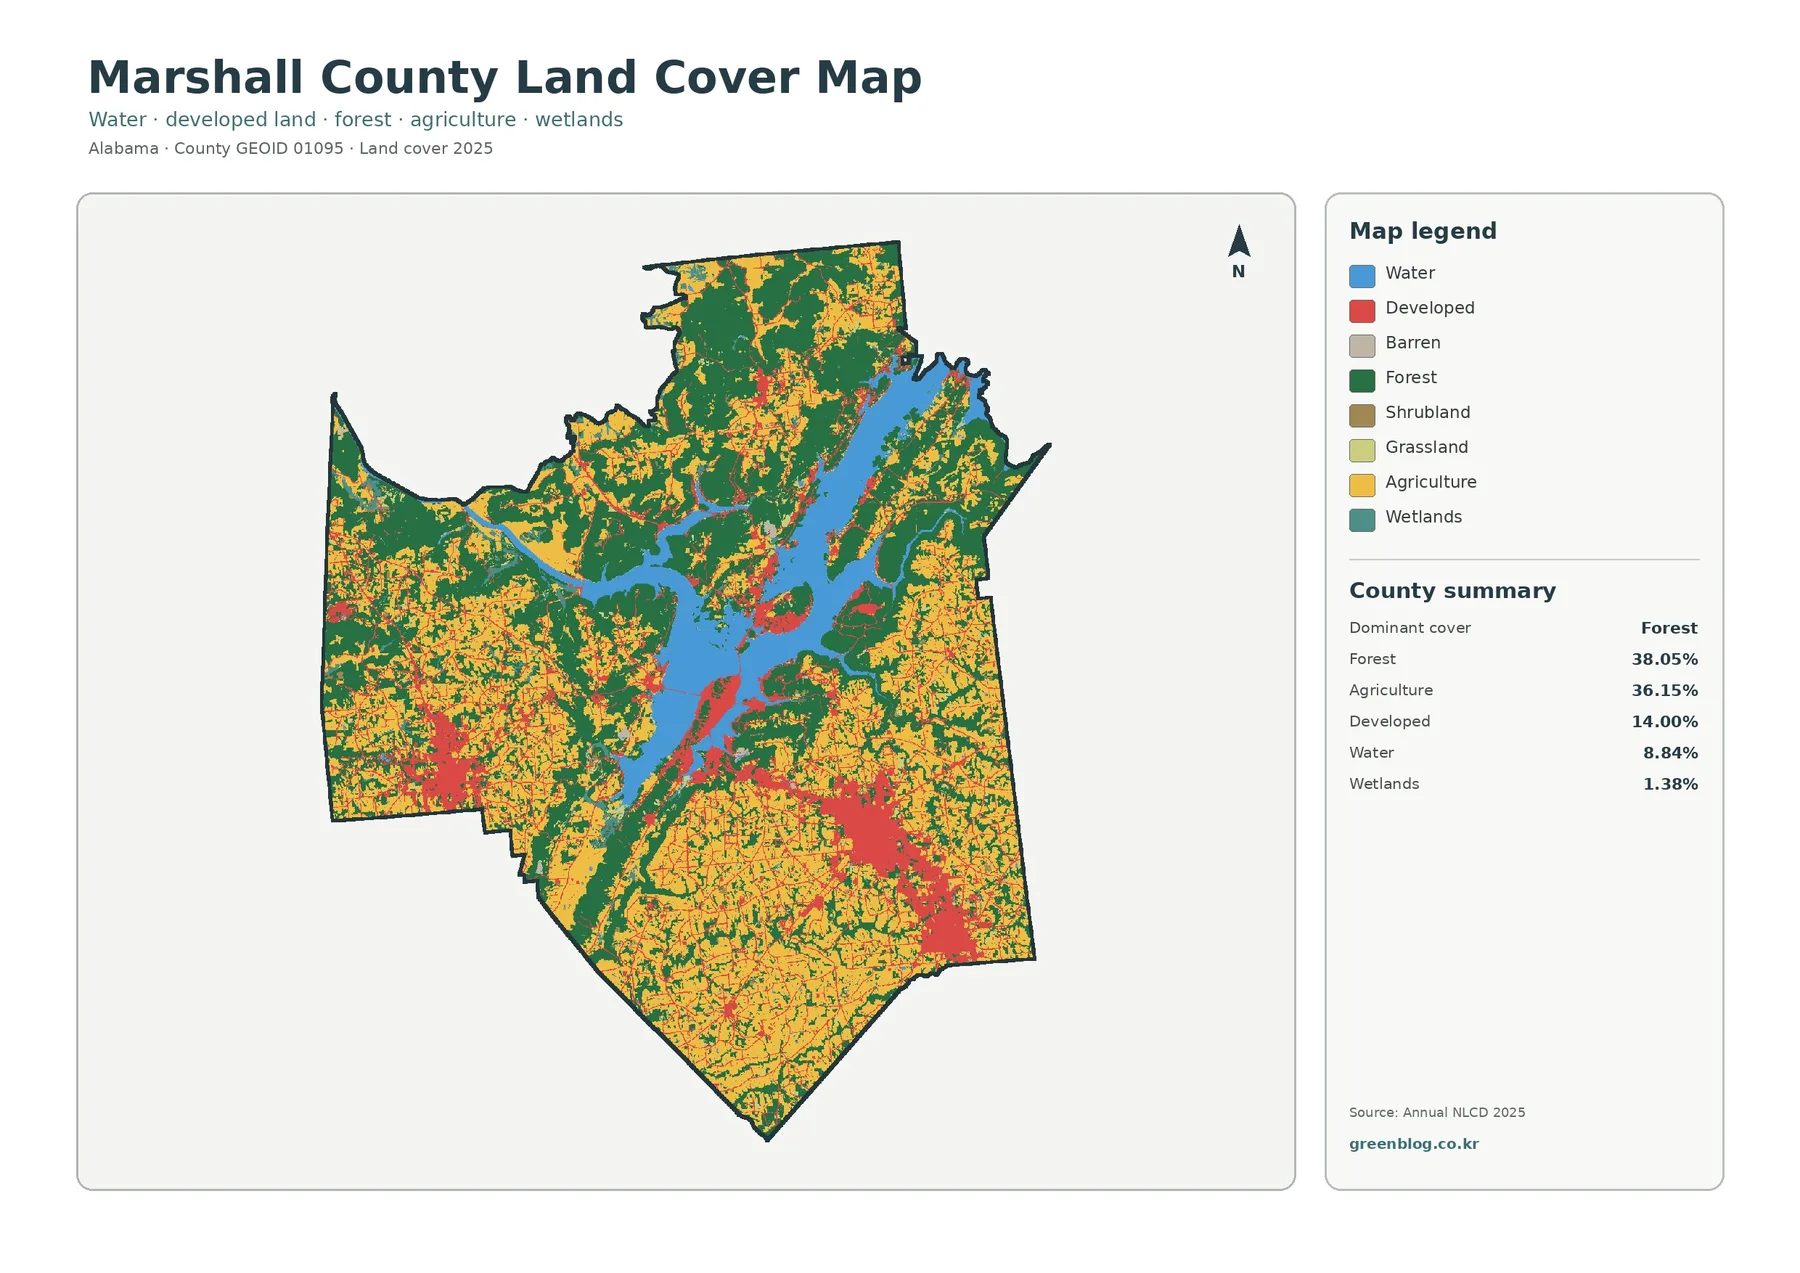
The Marshall County Alabama Land Cover Map is shaped by an unusual balance of forest, agriculture, developed land, and a large water footprint. Forest covers 38.05 percent in the supplied 2025 summary and agriculture follows closely at 36.15 percent. Lake Guntersville cuts through the county as a broad blue feature, while developed areas are concentrated in several separate centers rather than one continuous urban mass.
Four views are included on this page: general land cover, forest and farmland, fractional impervious surface, and a 1985–2025 class comparison. The WebP images are designed for reading on the page. The four original 2480 × 1754 JPG maps are available together in one download later in the article for presentations, lessons, county profiles, and other work that needs a clear countywide reference.
Table of Contents
A county where farms and forest occupy almost equal shares
Marshall County does not have a single overwhelmingly dominant 2025 land-cover class. Forest is the largest at 38.05 percent, but agriculture is only 1.90 percentage points lower at 36.15 percent. Developed cover accounts for 14.00 percent, water 8.84 percent, and wetlands 1.38 percent. That combination creates a map where green forest and yellow agricultural areas repeatedly alternate, while the blue reservoir and red developed centers interrupt both.
The near tie between forest and agriculture matters more than a simple ranking. A county described only as “forested” would miss the extensive farm pattern, while a description focused only on farming would ignore large wooded blocks around the reservoir and in the northern part of the county. The general view is most useful when the reader first looks for broad areas of continuous color and then notices where those areas break into smaller patches near water and developed places.
The term land cover refers to what is mapped on the surface, not to zoning or legal land use. A green cell does not prove that a tract is protected forest, and a yellow agricultural cell does not define a farm boundary or identify a crop. Developed land likewise does not say whether a place is residential, commercial, industrial, or publicly owned. Those questions require parcel, zoning, or other local records.
Lake Guntersville is a major part of the countywide picture
Water covers 8.84 percent of the mapped county, which makes it much more than a minor legend category. The Tennessee Valley Authority describes Guntersville Reservoir as an impoundment of the Tennessee River that lies in Marshall and Jackson Counties in Alabama and extends into Tennessee. On the county map, the broad water body occupies a central-to-northeastern position and creates long, irregular shorelines that separate wooded land, farmland, and developed areas.
The reservoir also changes how the surrounding colors should be read. Forest reaches the shoreline in many places, agricultural land approaches the water in others, and developed cover appears around several waterfront or near-water areas. The map alone cannot identify marina property, public land, shoreline permits, or flood limits. It can, however, show why a discussion of Marshall County land cover should treat water as one of the main organizing features rather than as an afterthought.
Wetlands account for 1.38 percent in the supplied summary. A land-cover wetland classification is useful for broad environmental context, but it is not a regulatory wetland determination. Narrow shore zones and small wet areas can also be difficult to represent precisely at county scale. Any property-level question about wetland boundaries, shoreline development, or permits needs current information from the responsible agency and, when appropriate, field verification.
The farm pattern becomes clearer when forest is simplified
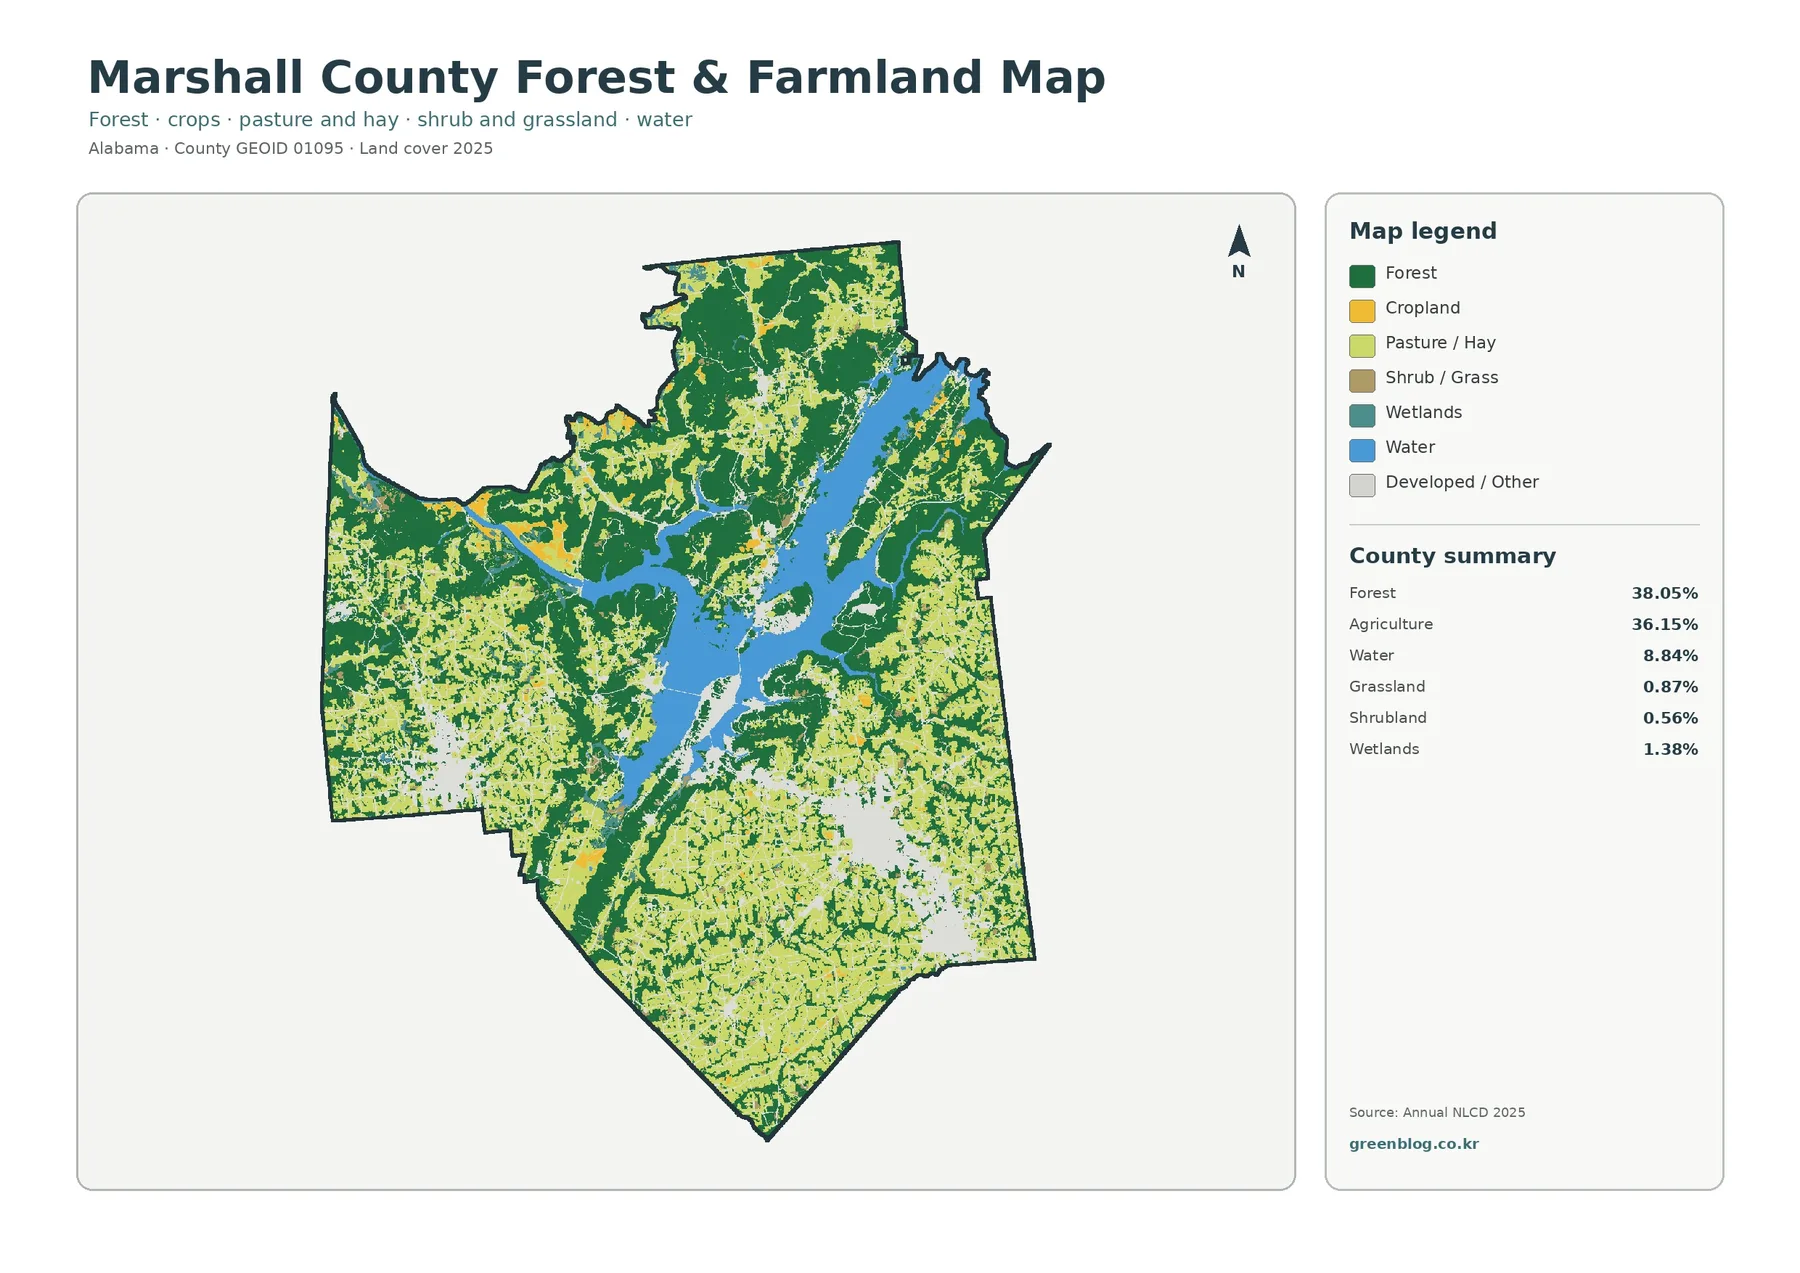
The forest-and-farmland view removes much of the visual competition from the general map and makes the rural pattern easier to follow. Forest still appears as large dark-green areas, but cropland and pasture or hay stand out more clearly across the southern, eastern, and western portions of the county. Smaller shrub or grass classes fill some of the transitions between larger wooded and agricultural areas instead of forming a single large zone of their own.
The companion summary lists grassland at 0.87 percent and shrubland at 0.56 percent, with water at 8.84 percent and wetlands at 1.38 percent. Those small shares are useful because they explain some of the lighter colors that break up the larger forest and agricultural fields. The map should be read as a mosaic rather than as two perfectly separated categories: wooded strips, farmed areas, settlements, and water edges occur close together in many parts of the county.
USDA’s 2022 Census of Agriculture adds a different, complementary measure. It reports 1,324 farms and 156,900 acres of land in farms in Marshall County. Within that farm land, the profile lists 53,220 acres of cropland, 53,741 acres of pastureland, and 36,473 acres of woodland. These figures describe land associated with agricultural operations, while Annual NLCD classifies surface cover. The two systems should not be converted into each other or expected to produce matching percentages.
That distinction is especially helpful in Marshall County because woodland can be part of a farm operation. A parcel counted as land in farms may contain substantial woods, pasture, buildings, and other cover. Conversely, an NLCD agricultural pixel says nothing about the farm operator or ownership. Using the datasets side by side is valuable when each retains its original definition.
Hard surfaces reveal several built centers and connecting routes
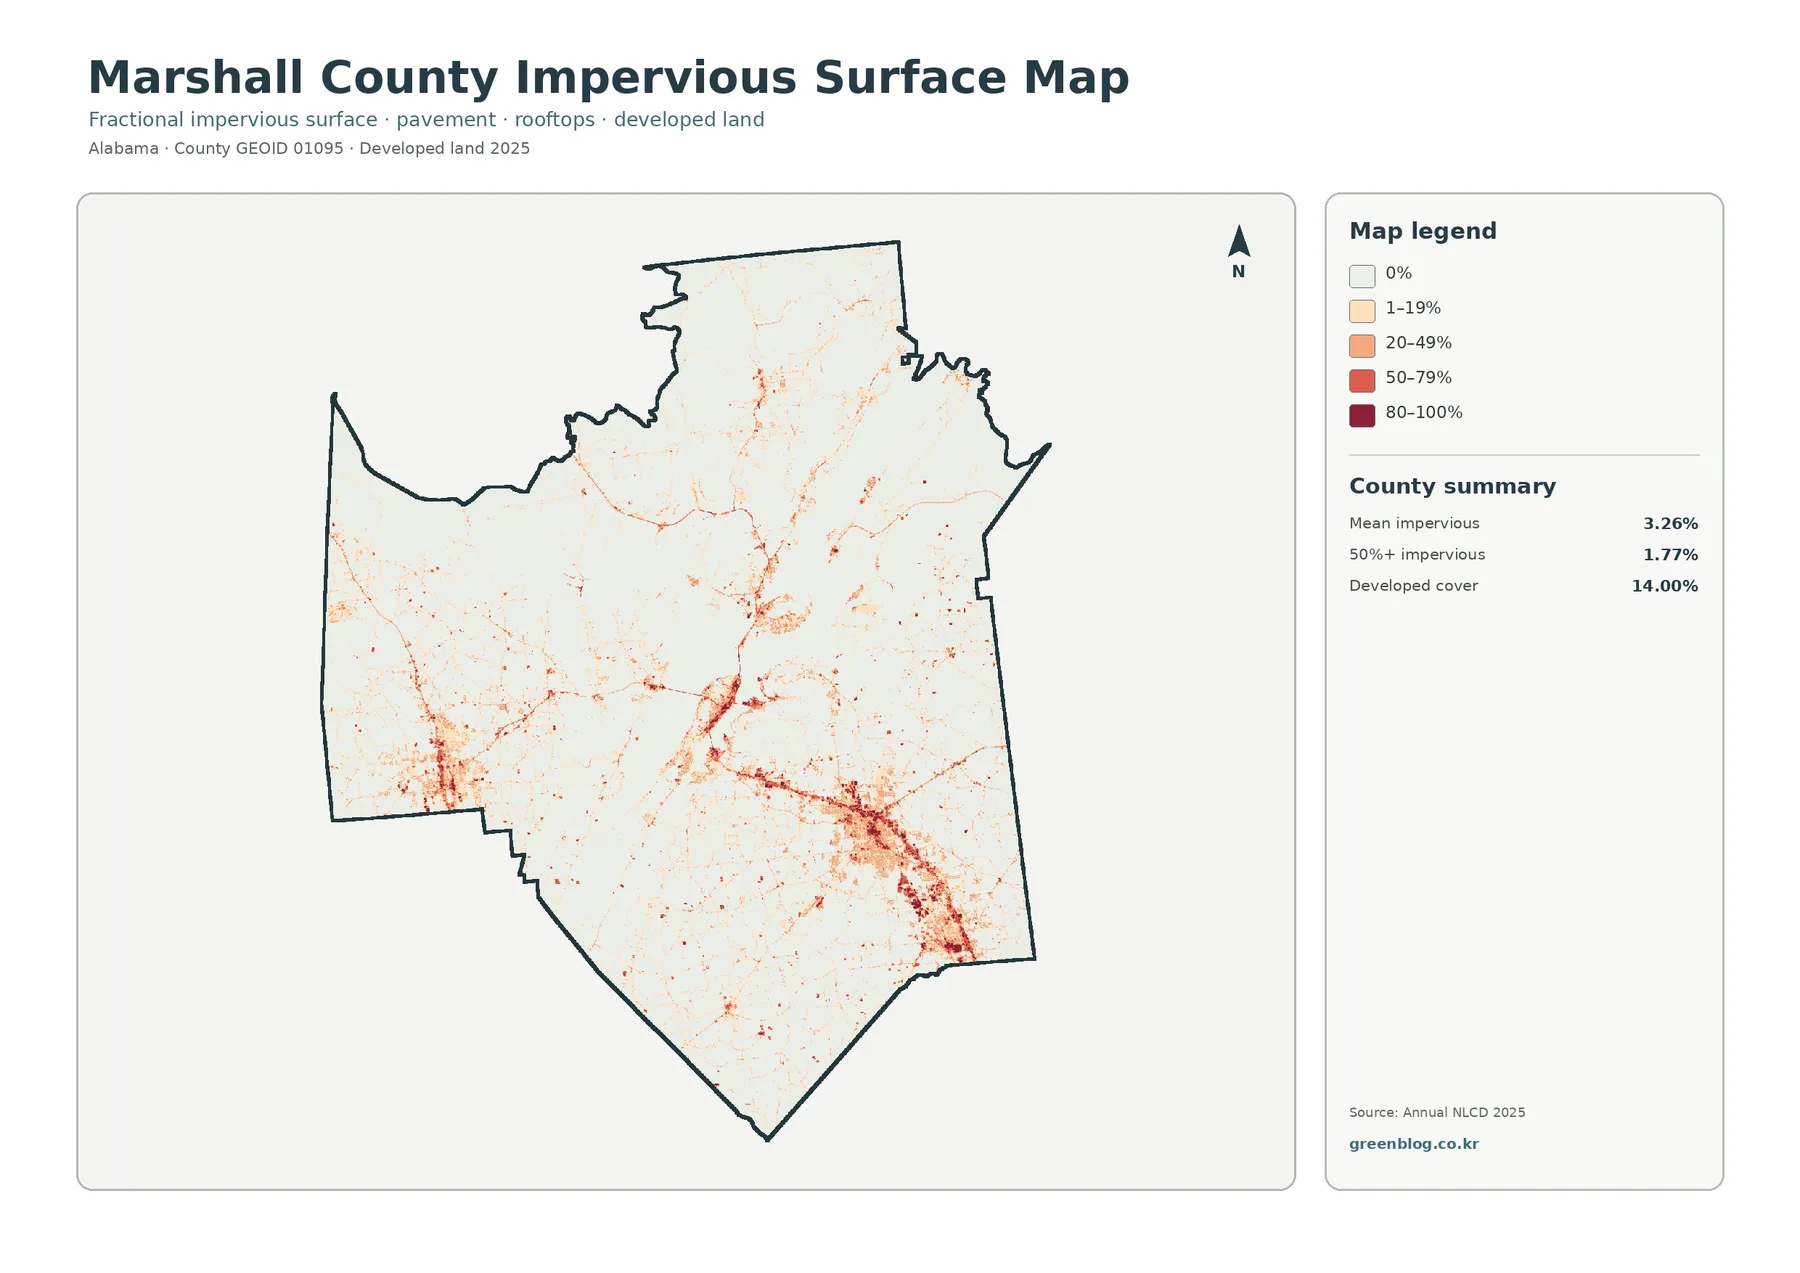
The impervious-surface map answers a different question from the general developed-land class. Impervious surfaces are roofs, pavement, parking areas, and similar surfaces that shed rather than readily absorb water. Mean imperviousness across the county is 3.26 percent, and 1.77 percent of the county is mapped at 50 percent impervious or greater. The developed land-cover class is much larger at 14.00 percent because developed cells can still include grass, trees, soil, and other permeable surfaces.
Once most other land-cover colors are removed, several concentrated built areas become obvious. The strongest hard-surface pattern appears through parts of the south and southeast, with another substantial cluster in the southwest and smaller concentrations closer to the reservoir. Thin lines extend between and away from those clusters. The visual pattern is a set of connected population centers inside a largely low-impervious county rather than one solid urban footprint.
Marshall County’s official website identifies Guntersville as the county seat and maintains county service information for Albertville, Arab, and Boaz as well. Those named places provide useful orientation for a county with multiple municipal centers. The impervious map itself does not label city limits or highways, so a red line should not be assigned to a particular road solely from this image. A labeled transportation or municipal map is the correct companion when exact names matter.
For planning context or environmental education, this map is useful because it separates the intensity of hard surfaces from the broader developed classification. It can support a general discussion of where runoff-generating surfaces are more concentrated, but it cannot calculate drainage design, parcel runoff, building area, or flood risk. Those tasks require detailed engineering, elevation, parcel, and stormwater data.
The 1985–2025 comparison is not simply a map of urban growth
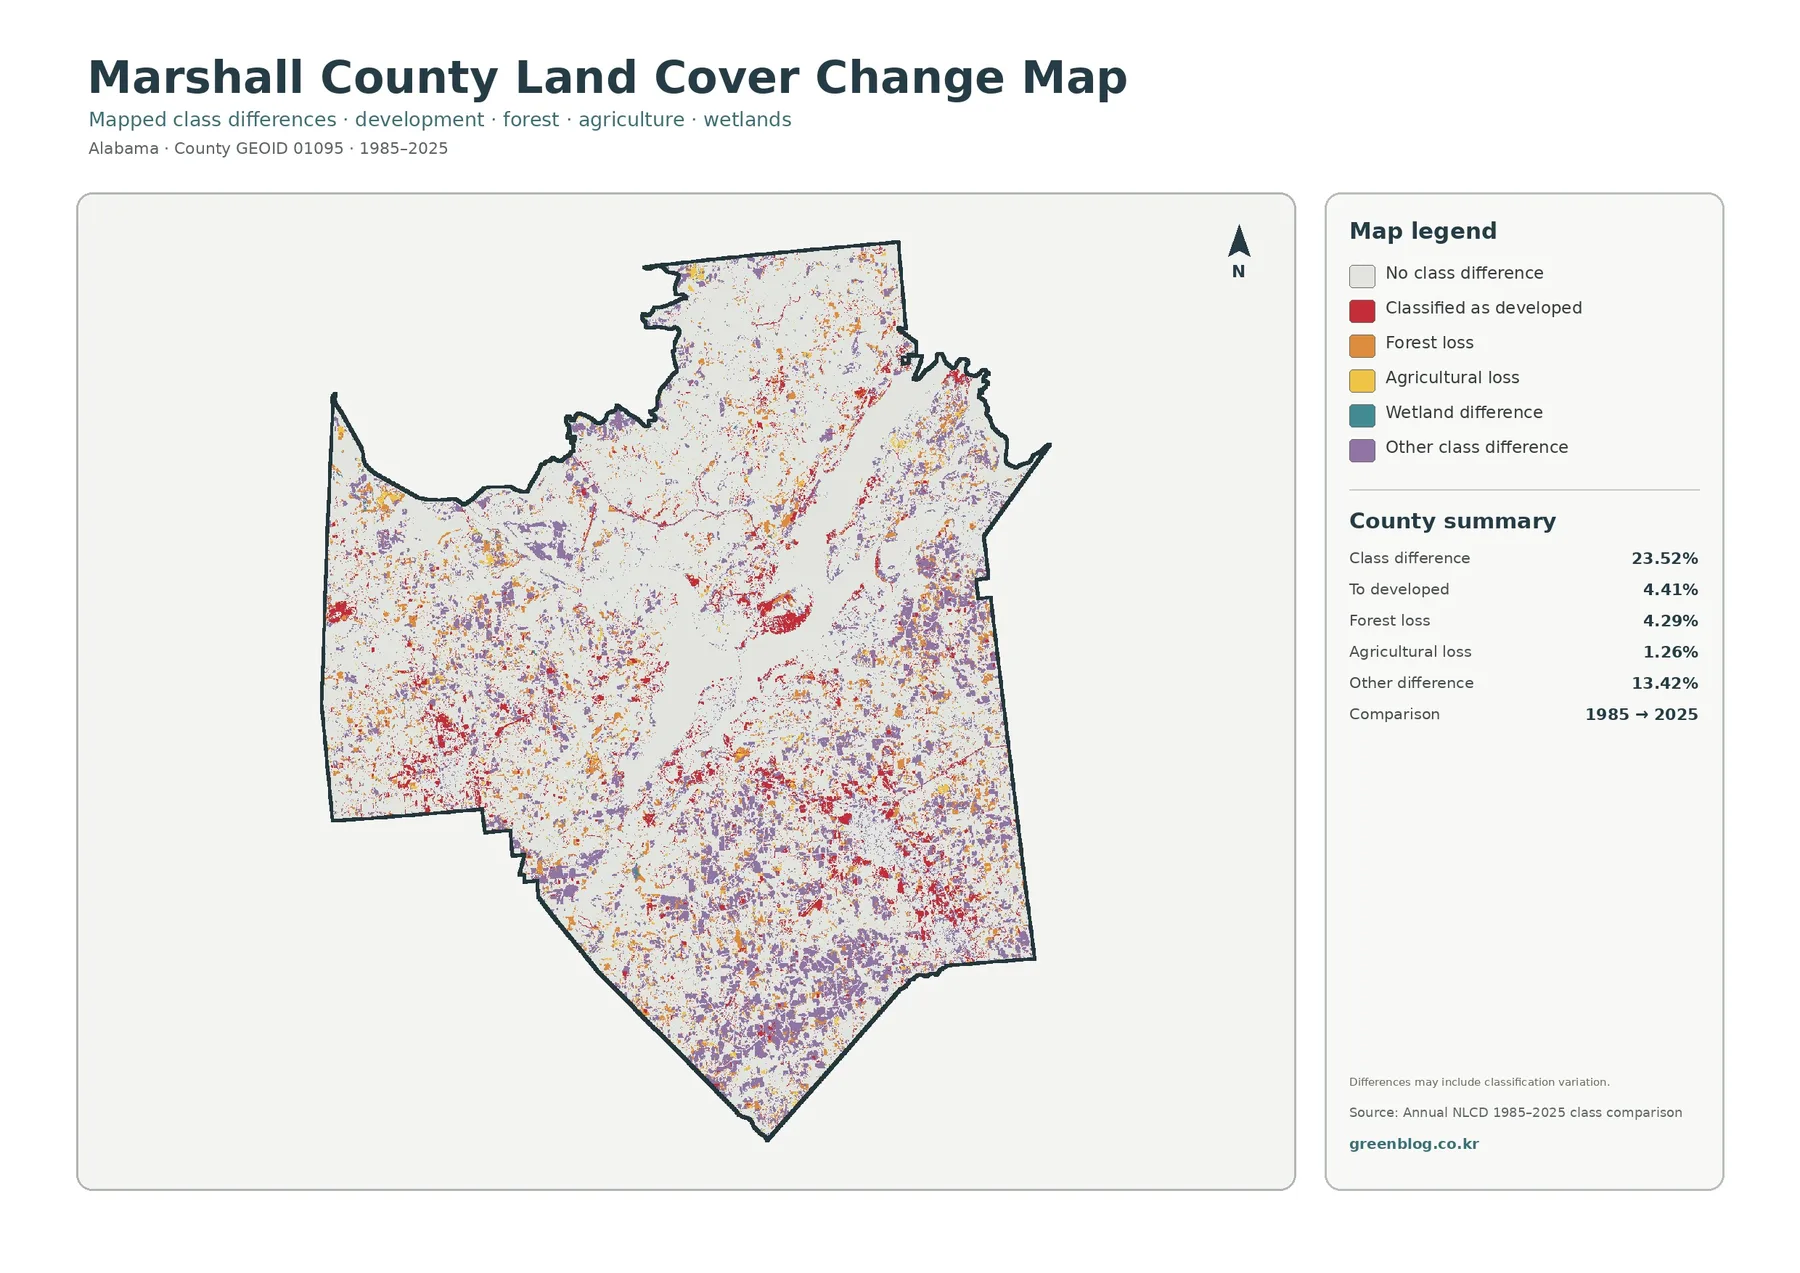
The change map compares classifications at two endpoints, 1985 and 2025. A total class difference is reported across 23.52 percent of the county. The summary breaks out 4.41 percent as classified to developed, 4.29 percent as forest loss, 1.26 percent as agricultural loss, and 13.42 percent as other class difference. A wetland-difference class also appears in the legend, although no separate countywide percentage is supplied for it.
Red areas classified to developed are visible in several of the same southern and waterfront contexts where current built cover is concentrated. Orange forest-loss cells and purple other differences are more broadly scattered. Yellow agricultural-loss areas are less extensive. The important point is that most of the colored area is not labeled “to developed.” A reader who treats every colored pixel as urban expansion would misread the map.
The map itself warns that differences may include classification variation. Satellite observation conditions, mixed pixels, class rules, and changes in the way a surface is represented can produce differences that are not identical to a documented physical land-use conversion. The 23.52 percent figure therefore describes endpoint class difference, not a verified percentage of parcels that changed legal use or ownership.
Two endpoints also hide the timing of intermediate events. A wooded area might have been harvested and regrown, a field might have changed cover more than once, or development could have occurred at any point between 1985 and 2025. Use this map to locate areas worth a closer look, then consult annual source layers, aerial imagery, or local records when the timing and cause of change matter.
Choose the map according to the question
For a county profile or a first slide in a presentation, start with the general land-cover map. It gives the reader the essential proportions and the reservoir shape in one image. The near balance between forest and agriculture is immediately visible, while developed areas and water provide strong reference points. This is the best overview when the audience needs to understand the whole county before looking at a specialized theme.
Use the forest-and-farmland map when the subject is rural landscape, agriculture, or habitat context. Its reduced set of classes makes farmed and wooded areas easier to compare without losing water, wetlands, and smaller open-land categories. If USDA agriculture statistics are added, label them clearly as farm-operation statistics rather than treating them as the same thing as the satellite-based land-cover percentages.
The impervious map is the better choice for discussing built intensity. It distinguishes places with modest development from areas where hard surfaces occupy a larger share of each cell. This matters in Marshall County because the general map’s 14 percent developed class is spread among several centers. The impervious view shows that the highest hard-surface values occupy a much smaller footprint than the developed class as a whole.
Use the change map last when possible. Once the audience understands the 2025 pattern, it is easier to interpret why colored differences appear around farms, forest, reservoir edges, and developed places. The change map should lead to questions rather than unsupported conclusions: where did a class differ, what was the endpoint label, and what additional evidence would be needed to explain why?
Scale, date, and boundary cautions for practical use
Annual NLCD is a raster product made for consistent landscape mapping over large areas. Raster data divide the surface into grid cells and assign each cell a representative value or class. Real properties are more complicated. A small local area can contain trees, a house, pavement, lawn, a ditch, and a garden, but a generalized raster may represent that mixture with only one or a few class values.
Mixed pixels are especially relevant along Lake Guntersville’s irregular shoreline and around narrow roads or streams. Water, vegetation, buildings, and open ground can occur within a short distance. Enlarging the map does not create new source detail, so the crisp edge of a colored cell should not be interpreted as a surveyed shoreline, property boundary, or legal wetland line.
The 2025 map is also a dated classification, not a live inventory. New buildings, changes in farming, tree harvest, regrowth, or shoreline work after the observation period may not appear. For a current property decision, combine recent local GIS or aerial photography with the appropriate official records. For countywide comparison, the strength of the dataset is that the same broad classification system can be applied consistently across large areas.
Area percentage and local importance are not the same measure. Water occupies 8.84 percent and strongly shapes the county map because of Lake Guntersville. Developed land occupies 14.00 percent but contains many homes, businesses, roads, and public services. Forest and agriculture dominate by area, yet the smaller classes can still matter greatly for settlement, access, recreation, or environmental work. Use the percentages as measures of mapped area, not as rankings of economic or ecological value.
Download the four original Marshall County land-cover JPG maps
The archive below contains the four map themes shown on this page as original JPG files: general land cover, forest and farmland, impervious/developed land, and the 1985–2025 land-cover comparison. Each image is 2480 × 1754 pixels. The files remain at the supplied original size rather than being enlarged to claim a different print resolution. For large-format printing, make a proof first and check whether the legend and small symbols are readable at the intended size.
Frequently Asked Questions
What are the largest 2025 land-cover classes in Marshall County?
Forest is the largest at 38.05 percent, followed very closely by agriculture at 36.15 percent. Developed land covers 14.00 percent, water 8.84 percent, and wetlands 1.38 percent. These are mapped surface-cover shares, not ownership or zoning percentages.
Why does water occupy such a large share of the county map?
Guntersville Reservoir forms a broad water body through the county. TVA identifies the reservoir as part of the Tennessee River system and confirms that it lies in Marshall County as well as neighboring areas. The county summary maps water at 8.84 percent.
Why is mean imperviousness 3.26 percent when developed cover is 14.00 percent?
Developed land can contain lawns, trees, bare soil, and other permeable surfaces in addition to roofs and pavement. The impervious product measures the hard-surface fraction, so its countywide average is expected to be lower than the broader developed land-cover percentage.
Does a 23.52 percent class difference mean that 23.52 percent of the county definitely changed on the ground?
No. The map compares 1985 and 2025 endpoint classifications and notes that some differences may reflect classification variation. Confirm site-specific change with annual layers, aerial imagery, local records, or field evidence before assigning a cause.
What files are included in the download?
The ZIP contains four original 2480 × 1754 JPG images: general land cover, forest and farmland, impervious/developed land, and the 1985–2025 change map. GIS layers, parcel lines, and editable source datasets are not included.
Map File Information
The ZIP contains the four original JPG maps described on this Marshall County land-cover page.
- Included Files: general land cover, forest & farmland, impervious/developed land, and 1985–2025 land-cover change
- Printable Size: 2480 × 1754 pixels each
Related Maps
- Autauga County Alabama Land Cover Map
- Baldwin County Alabama Land Cover Map
- Barbour County Alabama Land Cover Map
Sources and reference material
The percentages and change categories in this article come from the four supplied Annual NLCD-based Marshall County maps. Reservoir, municipal, and agricultural context was checked against the public sources below. Values from different datasets are kept in their original definitions rather than being merged into a single statistic.
- MRLC Annual NLCD Data — Annual NLCD products and access to the 1985–2025 series
- USGS Annual NLCD Land Cover Classification — class definitions and interpretation guidance
- Tennessee Valley Authority: Guntersville Reservoir Land Management Plan — reservoir location and public-land management context
- Marshall County Alabama official website — county seat and municipal service information
- USDA 2022 Census of Agriculture: Marshall County — farms, land in farms, cropland, pastureland, and woodland statistics
- U.S. Census Bureau TIGER/Line Shapefiles — county boundary documentation
Green Map creates custom-edited map images using open geographic data sources such as geoBoundaries, Natural Earth, OpenStreetMap, and government open data.
These maps are edited visual materials, not raw data files, and are provided for education, documents, presentations, and graphic reference.