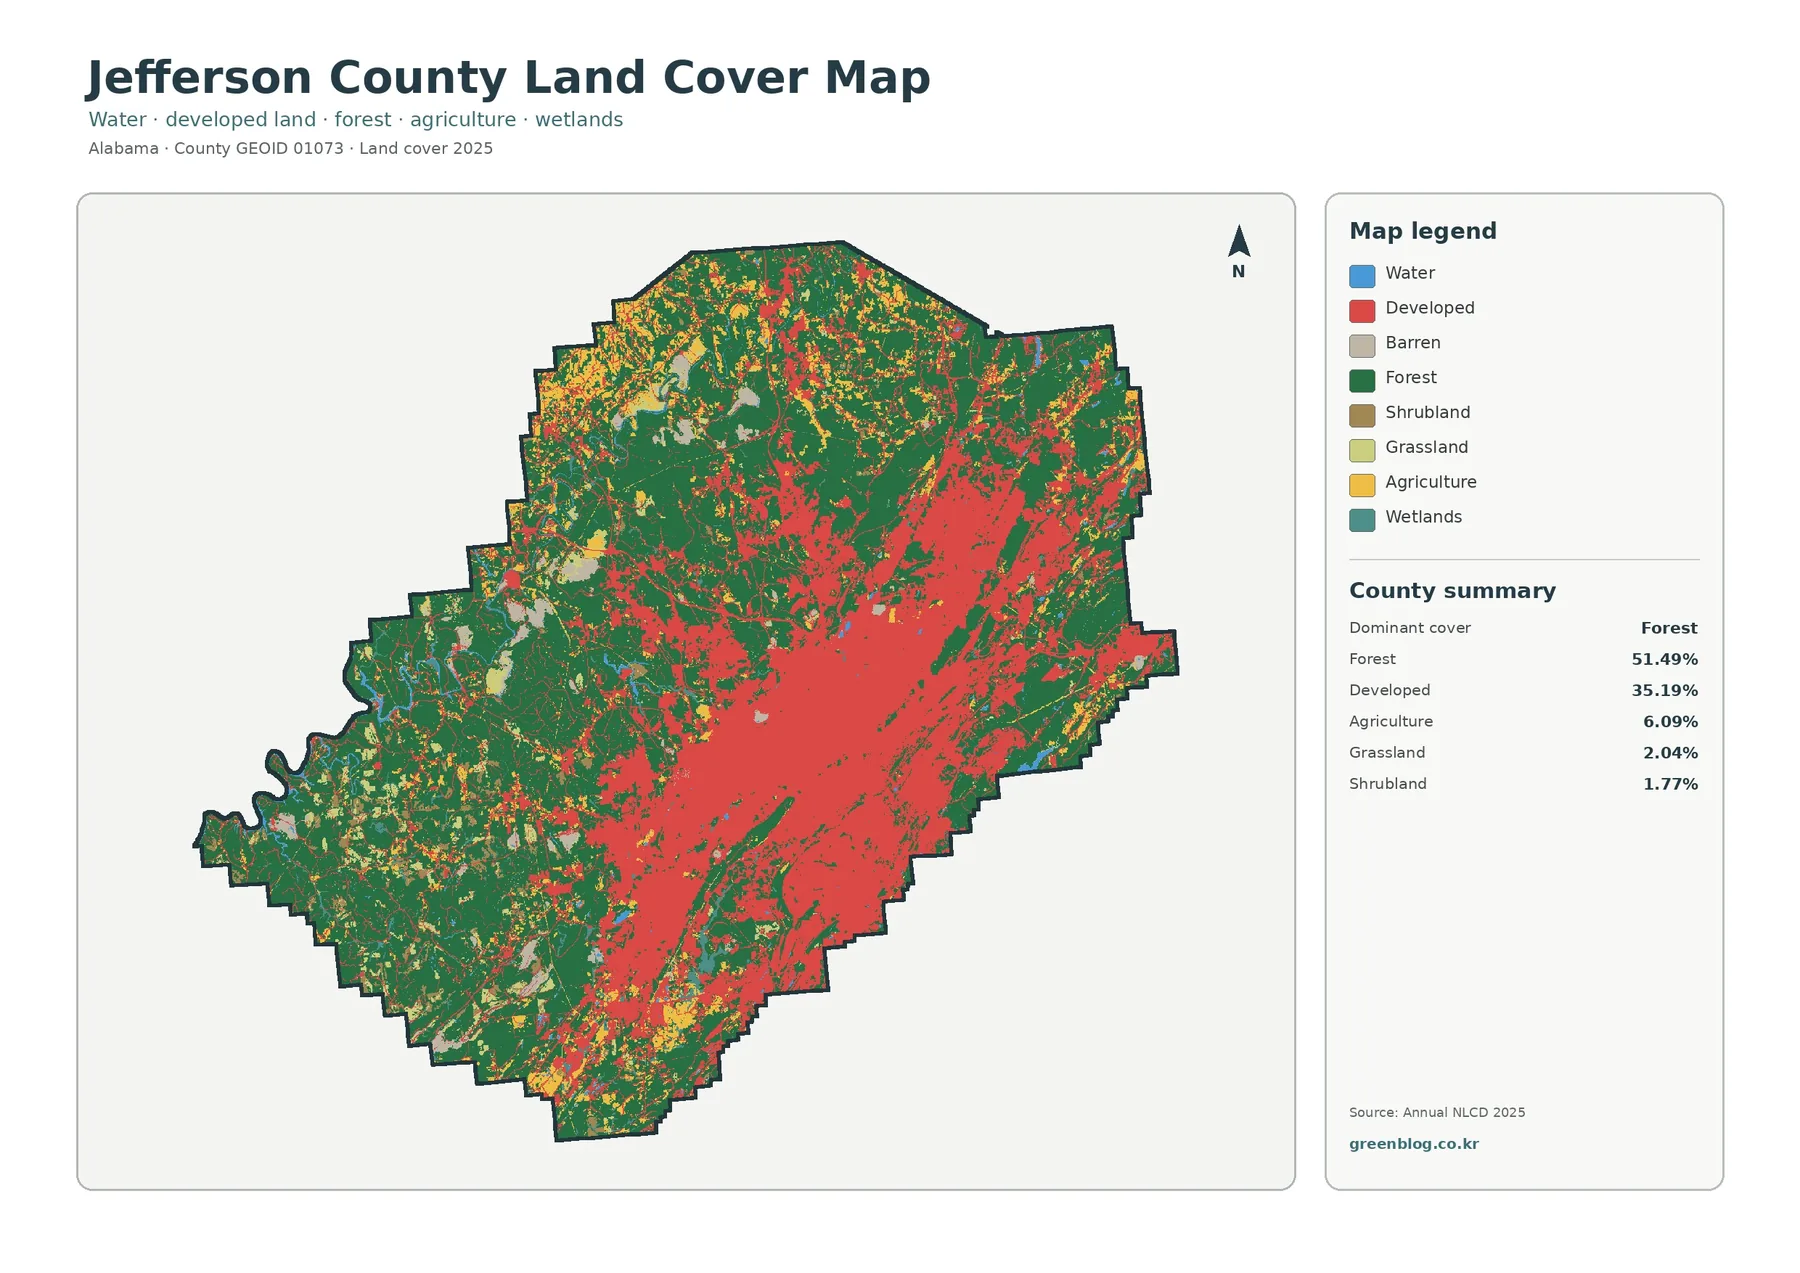
Jefferson County Alabama Land Cover Map shows one of the clearest urban–forest contrasts in this Alabama county series. A large developed area fills much of the Birmingham-centered middle and eastern portion of the county, while broad forest remains dominant across the west, southwest, and many outer slopes. The supplied 2025 summary reports 51.49% forest and 35.19% developed land, with agriculture at 6.09%, grassland at 2.04%, and shrubland at 1.77%.
Four matching maps can be compared on this page, and the four original JPG files are available in one ZIP download. The set includes current land cover, forest and farmland, fractional impervious surface, and mapped class differences from 1985 to 2025. Each source JPG is 2480 × 1754 pixels, while the article uses 1800 × 1273 WebP previews for on-page viewing.
Table of Contents
A large urban core occupies the center while forest dominates the county edges
The first thing that separates Jefferson County from many rural Alabama counties is the size of the developed footprint. Red cells form a broad connected area across the center and extend strongly toward the east and southeast. Smaller developed corridors reach north and southwest, creating a web of settlement and transportation surfaces rather than one compact town-sized cluster.
Forest still covers the largest countywide share at 51.49%. The strongest green areas lie west and southwest of the urban core, with additional forest along the northern edge and between developed corridors. This means Jefferson County can be both highly developed and forest-majority at the same time: the dense built area occupies a large but concentrated part of the county, while the outer portions contain extensive woodland.
Jefferson County’s official website identifies Birmingham as the county seat and describes the county as lying in the rolling foothills of the Appalachian Mountains in central Alabama. That setting helps explain why a large metropolitan footprint and wooded uplands can occur within the same county. The thematic map does not show elevation contours, however, so terrain should be treated as official geographic context rather than inferred from land-cover colors.
Agriculture is only 6.09%, much smaller than either forest or developed land. Agricultural cells appear mainly as scattered openings on the county margins and within less developed western and northern areas. There is no broad farm belt comparable with counties farther south or east. The visual balance is instead between urban development and forest, with agriculture playing a secondary role.
Birmingham-area development is broad, connected, and internally varied
The developed class covers 35.19% of Jefferson County, but that number includes more than pavement and rooftops. Residential neighborhoods, commercial areas, landscaped lots, roads, trees, lawns, and other surfaces can all occur inside developed land-cover classes. This is why the separate impervious-surface map is necessary for understanding how hard the ground surface actually is within the broader developed zone.
Official county material identifies Birmingham as the county seat and notes that a second courthouse is maintained in Bessemer. Those places provide useful reference points for the large metropolitan area visible in the thematic maps. Still, the red land-cover cells are not municipal boundaries: the developed footprint crosses city limits and includes suburban and transportation areas that a city map would divide among multiple jurisdictions.
Outside the main urban concentration, narrow developed traces extend into forested surroundings. They often follow the same general corridors as roads and settlements, but the land-cover image does not identify street names or prove that a particular road caused nearby development. It only shows that developed classes and linear built surfaces are concentrated together in those locations.
Removing the urban colors reveals how much forest remains around the metro area
The forest-and-farmland version turns developed and other surfaces pale, allowing the rural cover to stand out. Its county summary lists forest at 51.49%, agriculture at 6.09%, water at 1.11%, grassland at 2.04%, shrubland at 1.77%, and wetlands at 1.02%. The large pale metropolitan area remains easy to recognize, but the surrounding green forest becomes the main feature of the map.
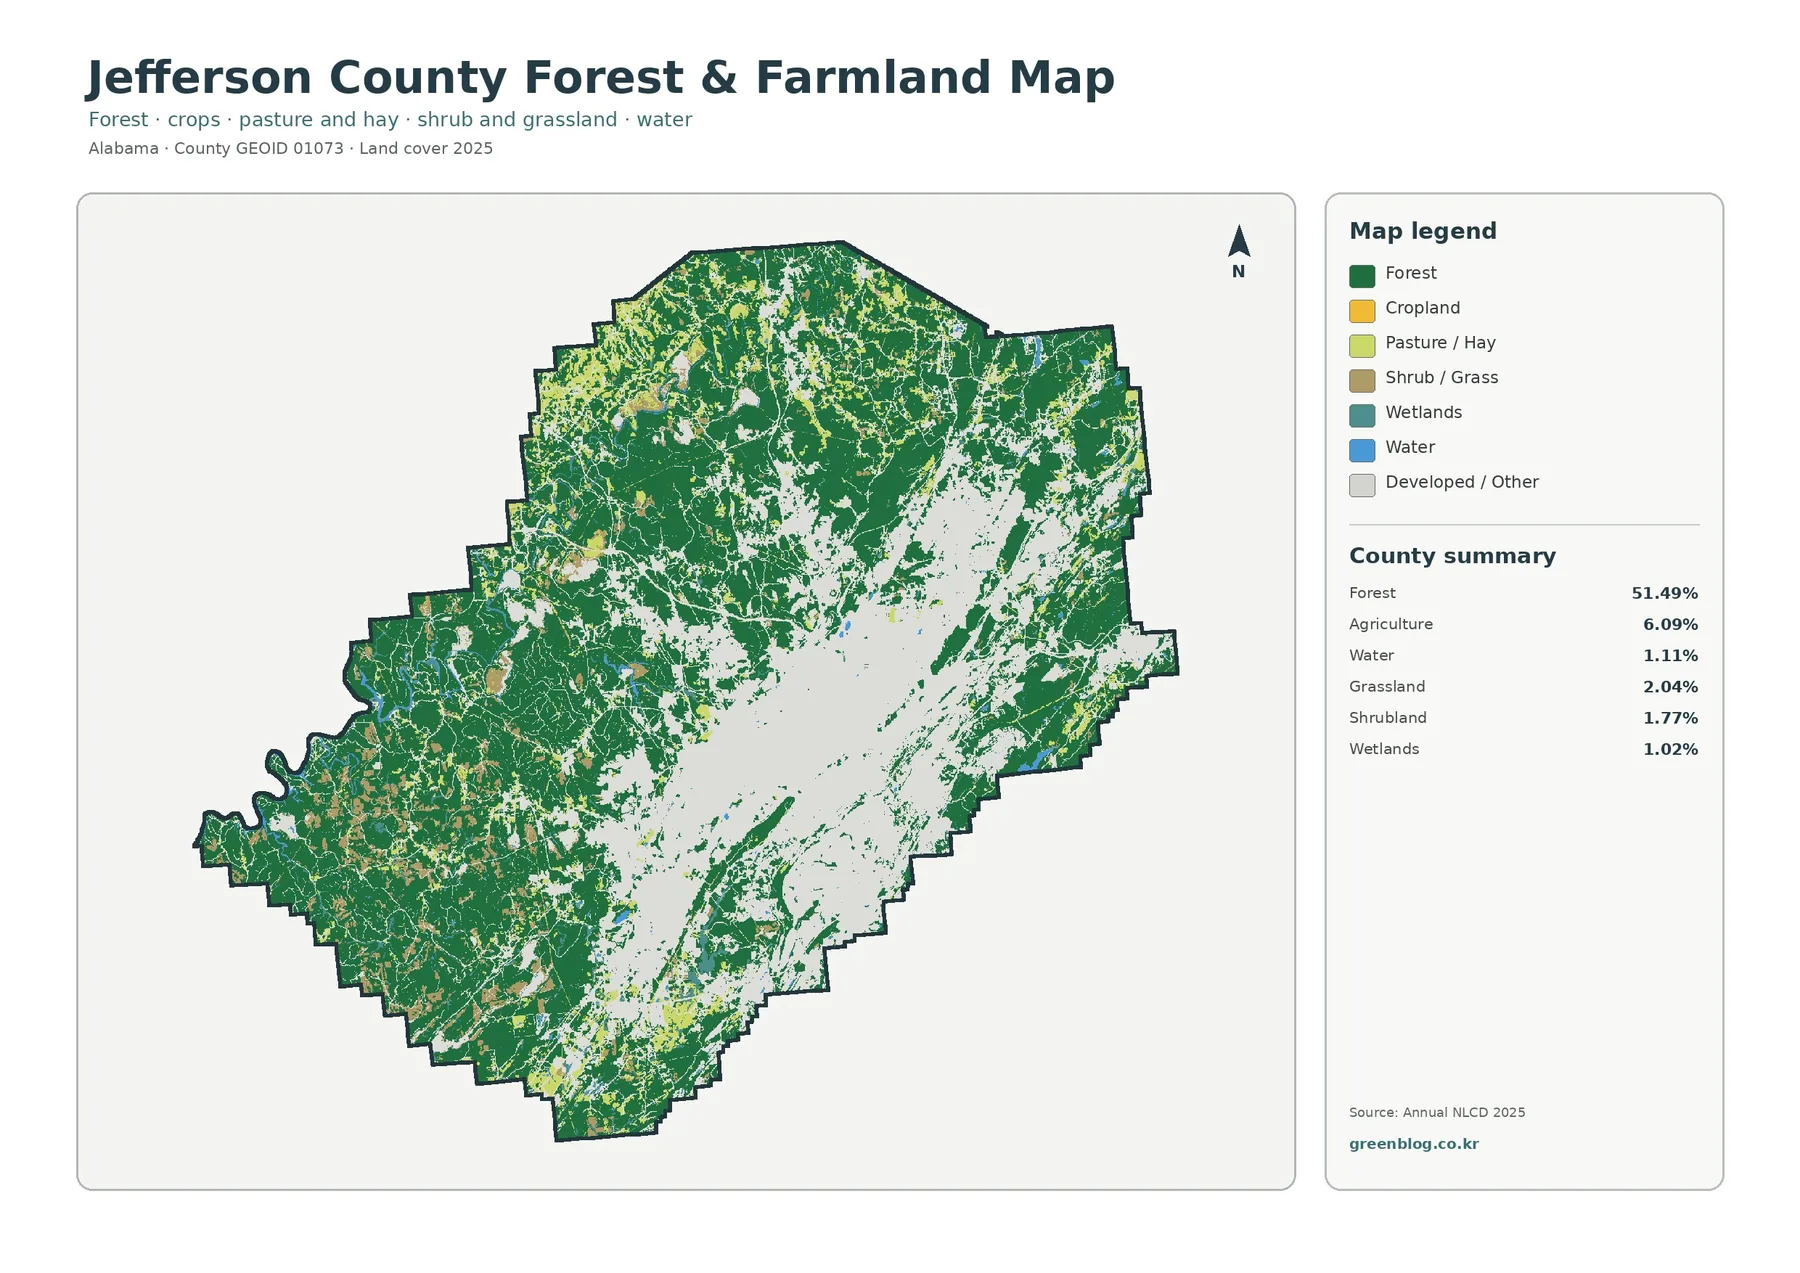
Western Jefferson County contains the broadest connected forest. Agricultural cells are scattered through openings there, but they occupy much less ground than the woodland. North of the main urban area, forest and developed traces alternate more closely. The southern and southeastern edges also contain substantial forest, although the nearby metropolitan footprint breaks it into smaller pieces in several places.
The 6.09% agriculture share should not be interpreted as a map of farms or agricultural ownership. A cropland or pasture-colored cell only describes the surface class assigned by the dataset. It cannot identify the owner, crop, lease, tax status, or zoning. The same limitation applies to forest: green cells do not show public ownership, timber rights, or conservation status.
For countywide planning or classroom work, this map is useful because it strips away some of the urban visual dominance and makes the remaining rural land easier to compare. It can help answer where forest is most continuous, where agricultural openings are concentrated, and how rural cover changes around the edges of the Birmingham metropolitan area.
Cahaba and Black Warrior watersheds provide context for the county’s water network
Open water accounts for 1.11% and wetlands 1.02% in the forest-and-farmland summary. Those percentages are small, yet water-related cells appear in several distinct corridors and reservoirs across the county. Alabama Department of Environmental Management records identify Jefferson County waters in both the Cahaba and Black Warrior systems, including Cahaba River reaches and Village Creek in the Black Warrior basin.
The map itself does not label individual rivers, creeks, lakes, or reservoirs. A blue or blue-green shape can therefore be described as water or wetland cover from the thematic image, but assigning a specific name requires a separate hydrography reference. This matters in an urban county where small streams, reservoirs, and wetland corridors can be surrounded by dense development.
Wetland cover is a land-cover classification, not a legal wetland determination. The same map also cannot establish a floodplain, stormwater easement, stream buffer, or permit boundary. Environmental and engineering decisions require current agency, survey, hydrologic, and site-level information.
Imperviousness reveals the densest parts of the metropolitan footprint
Fractional impervious surface estimates how much of each raster cell is covered by hard materials such as pavement and rooftops. Jefferson County’s mean imperviousness is 10.82%, and 7.79% of the county is mapped at 50% or greater imperviousness. These values are much higher than in the mostly rural Alabama counties processed nearby in this series, which fits the unusually large developed footprint visible in the 2025 land-cover image.
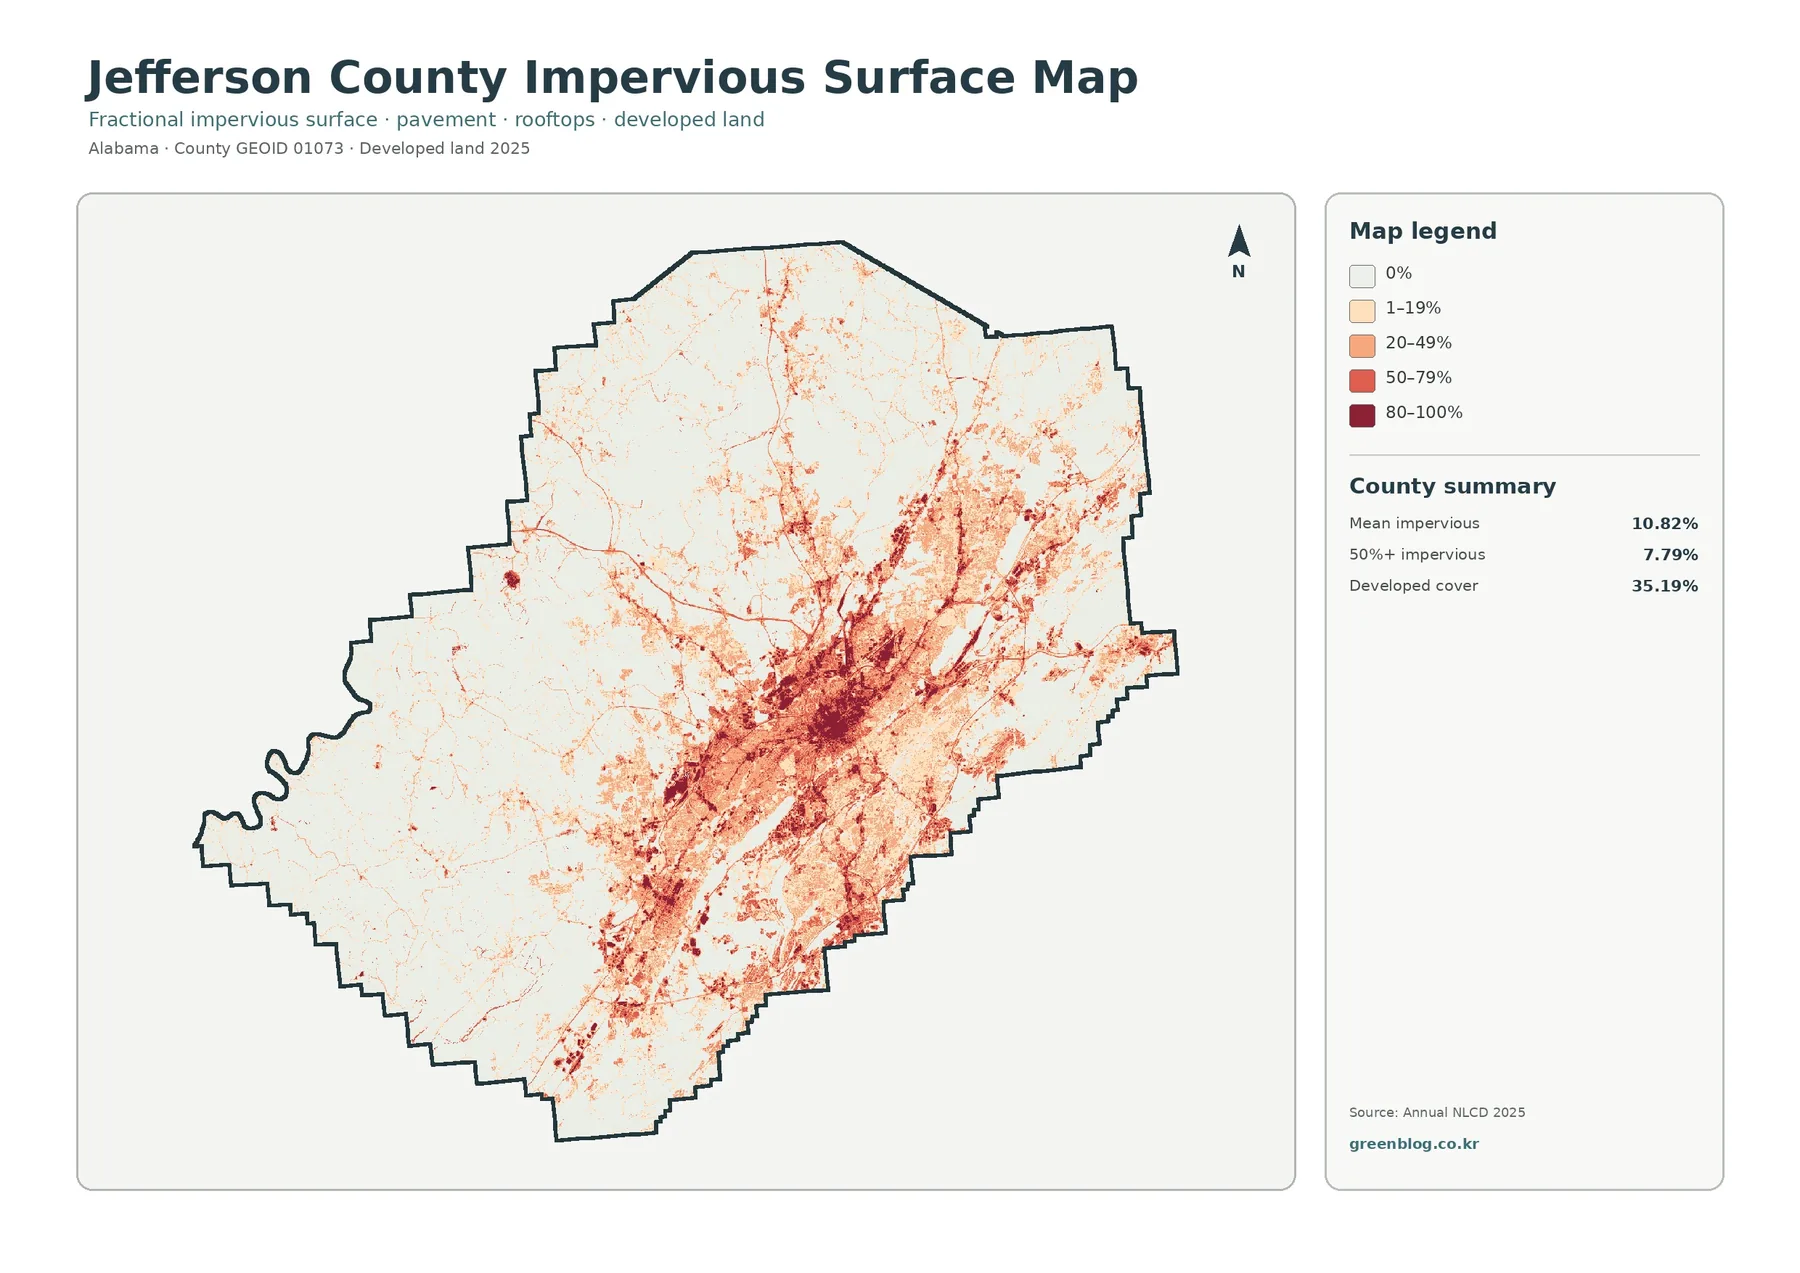
Dark impervious cells form a dense center inside the broader developed area, then branch outward along several corridors. The highest values are not spread evenly through every red land-cover cell. Many outer developed areas remain lighter, reflecting lower-density neighborhoods and mixed surfaces where trees, yards, and soil occupy part of each raster cell.
The difference between 35.19% developed cover and 10.82% mean imperviousness is important. Developed land is a categorical surface class, while imperviousness measures a fraction. A suburban cell can be classified as developed even when most of the cell is lawn or tree canopy. Treating the two numbers as interchangeable would exaggerate the amount of fully paved or roofed ground.
For stormwater discussions, the impervious map can identify broad areas where hard surfaces are concentrated. It does not show storm sewers, culverts, drainage inlets, detention basins, road ownership, or building footprints. Those details require engineering and local infrastructure data.
The 1985–2025 comparison highlights substantial development-related differences
The endpoint comparison reports class differences across 31.25% of Jefferson County. The supplied summary identifies 8.24% as cells classified to developed, 4.84% as forest loss, 1.41% as agricultural loss, and 16.70% as other class difference. A wetland-difference color is also present in the legend, but the summary does not provide a separate countywide percentage for that category.
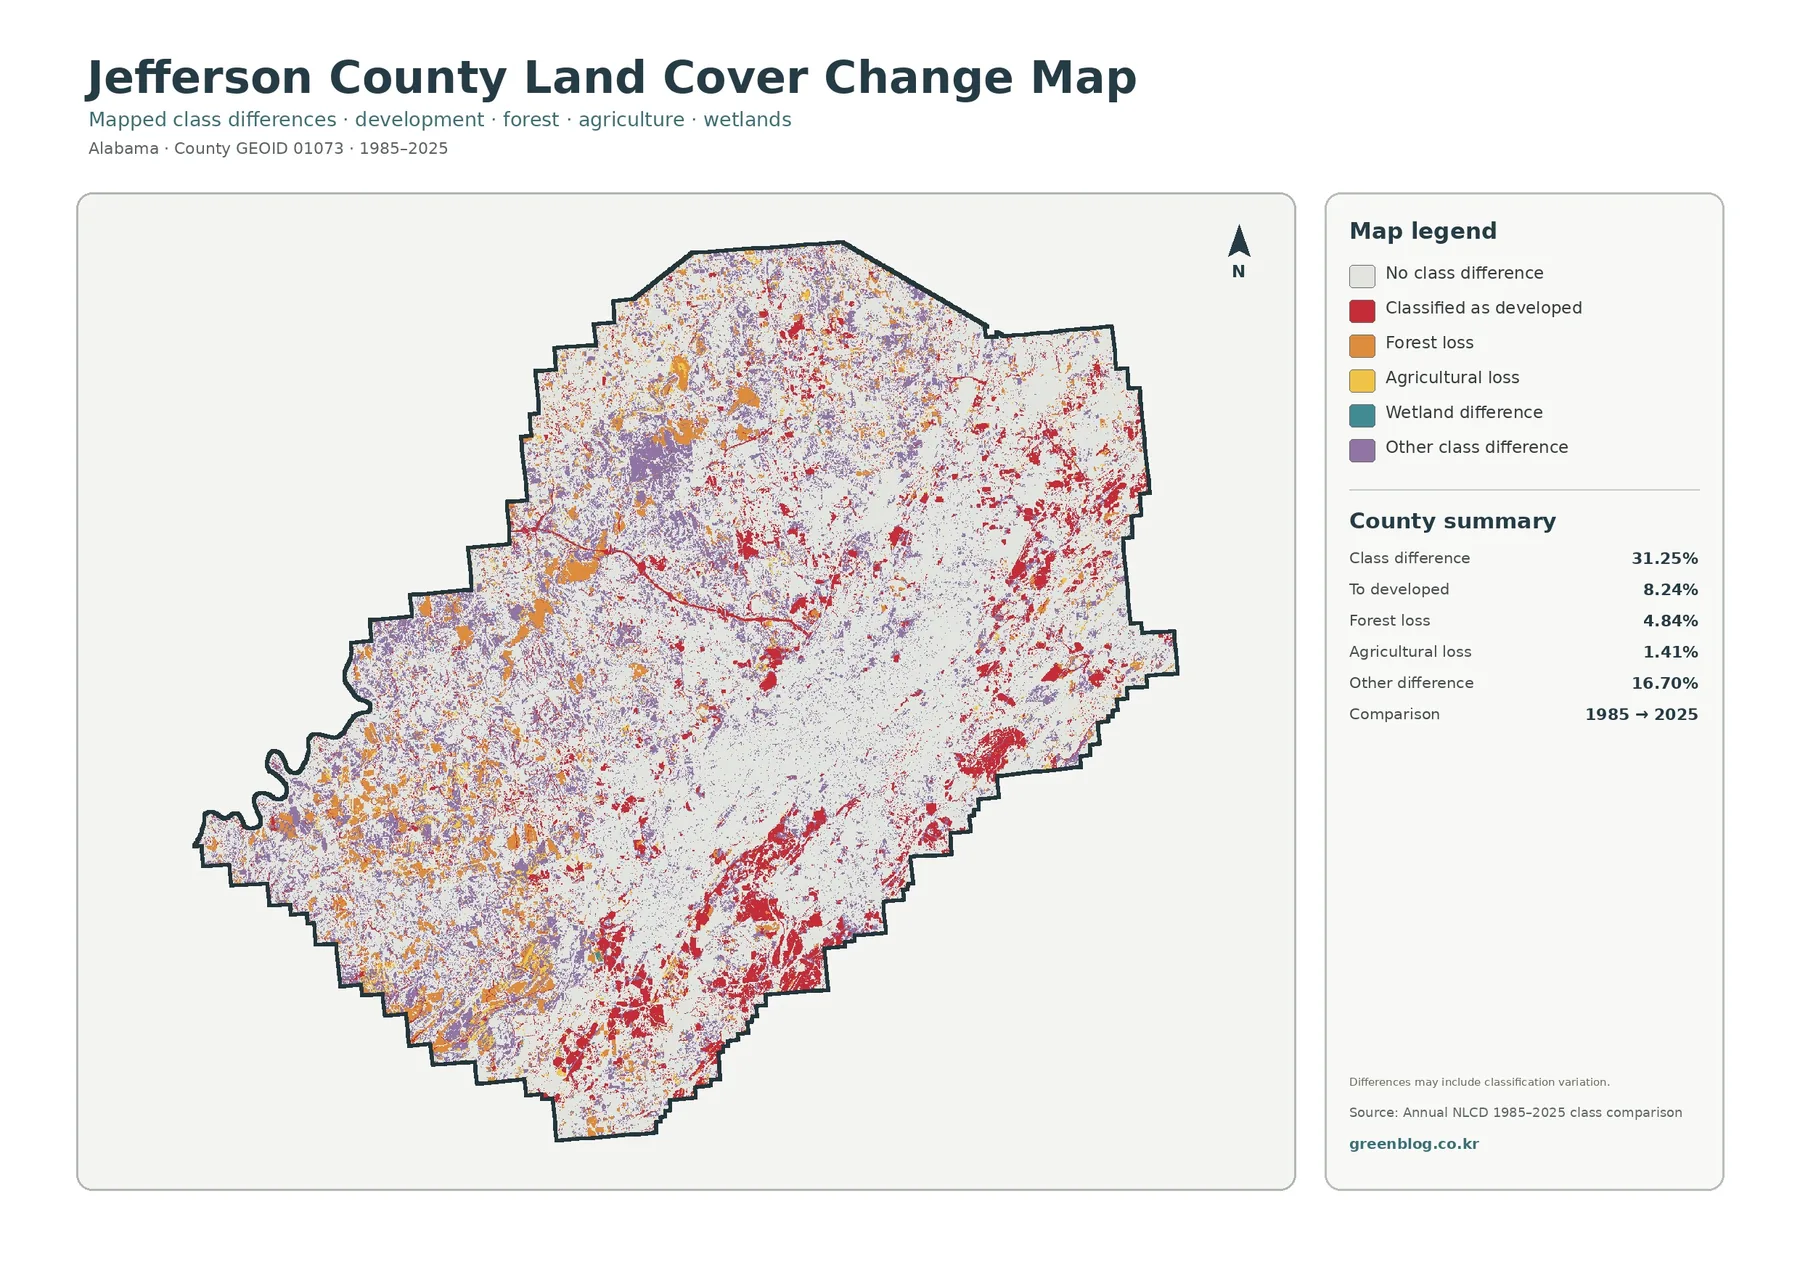
Red to-developed cells are widely distributed around the present metropolitan area, especially along its outer edges and connecting corridors. Orange forest-loss and purple other-difference cells are more common in the western half and around transitions between forest and development. The pattern makes urban expansion a visible component of the endpoint comparison, but it is not the only source of mapped difference.
The change image includes an explicit warning that classification variation may contribute to the result. Annual NLCD uses generalized raster cells, and a roughly 30-meter land-cover cell can include trees, roads, rooftops, yards, bare ground, and water at the same time. Differences in imagery, seasonal conditions, sensors, or classification methods can change the assigned class even without a simple one-time physical conversion.
For historical work, the 31.25% value should be treated as the share of cells whose endpoint classifications differ, not as a direct physical-conversion rate. Intermediate Annual NLCD years, historical aerial photographs, local development records, or parcel histories can be checked where a specific change matters.
The four maps use different measurements, so their percentages should stay separate
Current developed cover is 35.19%, mean imperviousness is 10.82%, and 8.24% of the county is classified to developed in the 1985–2025 endpoint comparison. Those three numbers answer different questions. The first describes a 2025 land-cover class, the second measures average hard-surface fraction, and the third identifies a particular type of two-date class difference.
Forest follows the same rule. Forest covers 51.49% in the 2025 map, while 4.84% is marked as forest loss in the endpoint comparison. Subtracting 4.84 from 51.49 would not produce a valid historical forest percentage because the datasets and categories describe different measurements.
This distinction also improves comparisons with other counties. Match 2025 forest with 2025 forest, developed cover with developed cover, mean imperviousness with mean imperviousness, and the same 1985–2025 change categories with one another. Consistent definitions make a regional table or classroom chart much easier to explain.
Download the four original Jefferson County JPG maps
The download archive contains four original JPG maps using the same Jefferson County boundary and orientation: 2025 land cover, forest and farmland, fractional impervious surface, and 1985–2025 mapped class differences. The consistent extent makes the set useful for a report that moves from the overall Birmingham-area footprint to rural cover, hard-surface intensity, and long-term comparison.
Each original JPG is 2480 × 1754 pixels. The package identifies that size as the source resolution and does not mark the maps as meeting a higher A3-resolution reference. If the images are printed at a large physical size, check the legend and small labels before final output rather than assuming that enlargement adds new map detail.
Raster scale and legal limits matter even more in a dense urban county
Annual NLCD land cover is raster data. Jefferson County is divided into grid cells and each cell receives a representative surface class. At roughly 30-meter land-cover resolution, a road, roof, yard, tree canopy, parking area, and stream edge can occur within the same cell. A sharp boundary between two colors is therefore not a surveyed parcel or zoning line.
The current-cover maps summarize 2025 conditions. Construction, demolition, road work, forest clearing, or redevelopment after that observation year are outside the images. The historical map compares only the 1985 and 2025 endpoints, so changes that happened and later reversed may disappear from the final two-date comparison.
Land cover should not be used as a substitute for zoning, ownership, building permission, or environmental jurisdiction. A developed cell does not prove a parcel is buildable, forest does not identify protected land, and wetland color does not establish a regulated wetland. Jefferson County’s official GIS, planning, parcel, and permit records are the appropriate starting points for those questions.
Frequently Asked Questions
What is the largest 2025 land-cover class in Jefferson County?
Forest is the largest class at 51.49%, followed by developed land at 35.19%. Agriculture is 6.09%, grassland 2.04%, and shrubland 1.77%. The map shows the strongest forest coverage west and southwest of the Birmingham-centered urban area.
Why is developed cover 35.19% while mean imperviousness is 10.82%?
They measure different things. Developed land is a categorical land-cover class that can include lawns, trees, and other permeable ground. Imperviousness estimates hard surfaces such as pavement and rooftops. Jefferson County’s mean imperviousness is 10.82%, while 7.79% of the county is mapped at 50% or greater imperviousness.
Does 31.25% class difference mean 31.25% of Jefferson County was physically transformed?
Not necessarily. It means 31.25% of mapped cells have different classes in the 1985 and 2025 endpoint comparison. The map warns that classification variation may be included, so some differences can reflect imagery or classification effects as well as real development, clearing, regrowth, or other land-cover change.
Map File Information
The ZIP contains four original Jefferson County JPG maps: 2025 land cover, forest and farmland, impervious surface, and mapped class differences from 1985 to 2025.
- File Type: ZIP containing four JPG images
Related Maps
- Autauga County Alabama Land Cover Map
- Baldwin County Alabama Land Cover Map
- Barbour County Alabama Land Cover Map
Sources and data
- MRLC Annual NLCD Data — official access point for Annual NLCD land-cover and developed-surface products.
- USGS Annual NLCD Land Cover Classification — official descriptions of the mapped land-cover classes.
- Jefferson County: Who We Are — official county background on Birmingham, the county seat, and the Appalachian foothill setting.
- Alabama Department of Environmental Management: Approved TMDLs — official records identifying Cahaba River, Village Creek, and other Jefferson County watersheds.
- Jefferson County Maps — official county mapping resources for administrative reference.
Green Map creates custom-edited map images using open geographic data sources such as geoBoundaries, Natural Earth, OpenStreetMap, and government open data.
These maps are edited visual materials, not raw data files, and are provided for education, documents, presentations, and graphic reference.