Etowah County Alabama Land Cover Map brings four views of the same northeastern Alabama county into one page: 2025 land cover, forest and farmland, fractional impervious surface, and mapped class differences between 1985 and 2025. The current-cover summary is led by forest at 47.03%, with agriculture at 26.16% and developed land at 17.76%. The image is especially easy to orient around the broad developed concentration in the Gadsden area, the water corridor through the middle and south, and the larger forested and agricultural areas that surround the urban core.
The four browser maps use matching county boundaries, so a reader can compare cover types without changing scale or orientation. Each WebP preview is 1800 × 1273 pixels. The download contains the four supplied original JPG files at 2480 × 1754 pixels each, preserving the source resolution rather than enlarging them to claim detail that is not present. They are useful for reports, lessons, regional reference, and presentations, while property, zoning, engineering, and regulatory questions still require the appropriate official records.
Table of Contents
The 2025 map separates a dense Gadsden core from a mostly forest-and-farm county
Forest is the largest mapped class in Etowah County at 47.03%, but it does not appear as one unbroken block. Dark green areas cover broad parts of the county and form long bands through the north, east, and west, while agriculture occupies 26.16% in lighter and yellow tones between those wooded areas. Developed land reaches 17.76%, a much larger share than in many rural counties, and it is strongly concentrated near the center of the map instead of being spread evenly from boundary to boundary.
Water accounts for 2.56% and wetlands for 2.25% in the supplied 2025 summary. Those percentages are small compared with forest or agriculture, yet the water pattern is visually important because a broad blue corridor passes through the developed center and bends southward. Etowah County’s official history page identifies Gadsden as the county seat and places the county in northeastern Alabama. A county stormwater report identifies Neely Henry Lake on the Coosa River as the primary receiving water for the Gadsden–Etowah urbanized stormwater system, which provides a useful local reference for the central water feature.
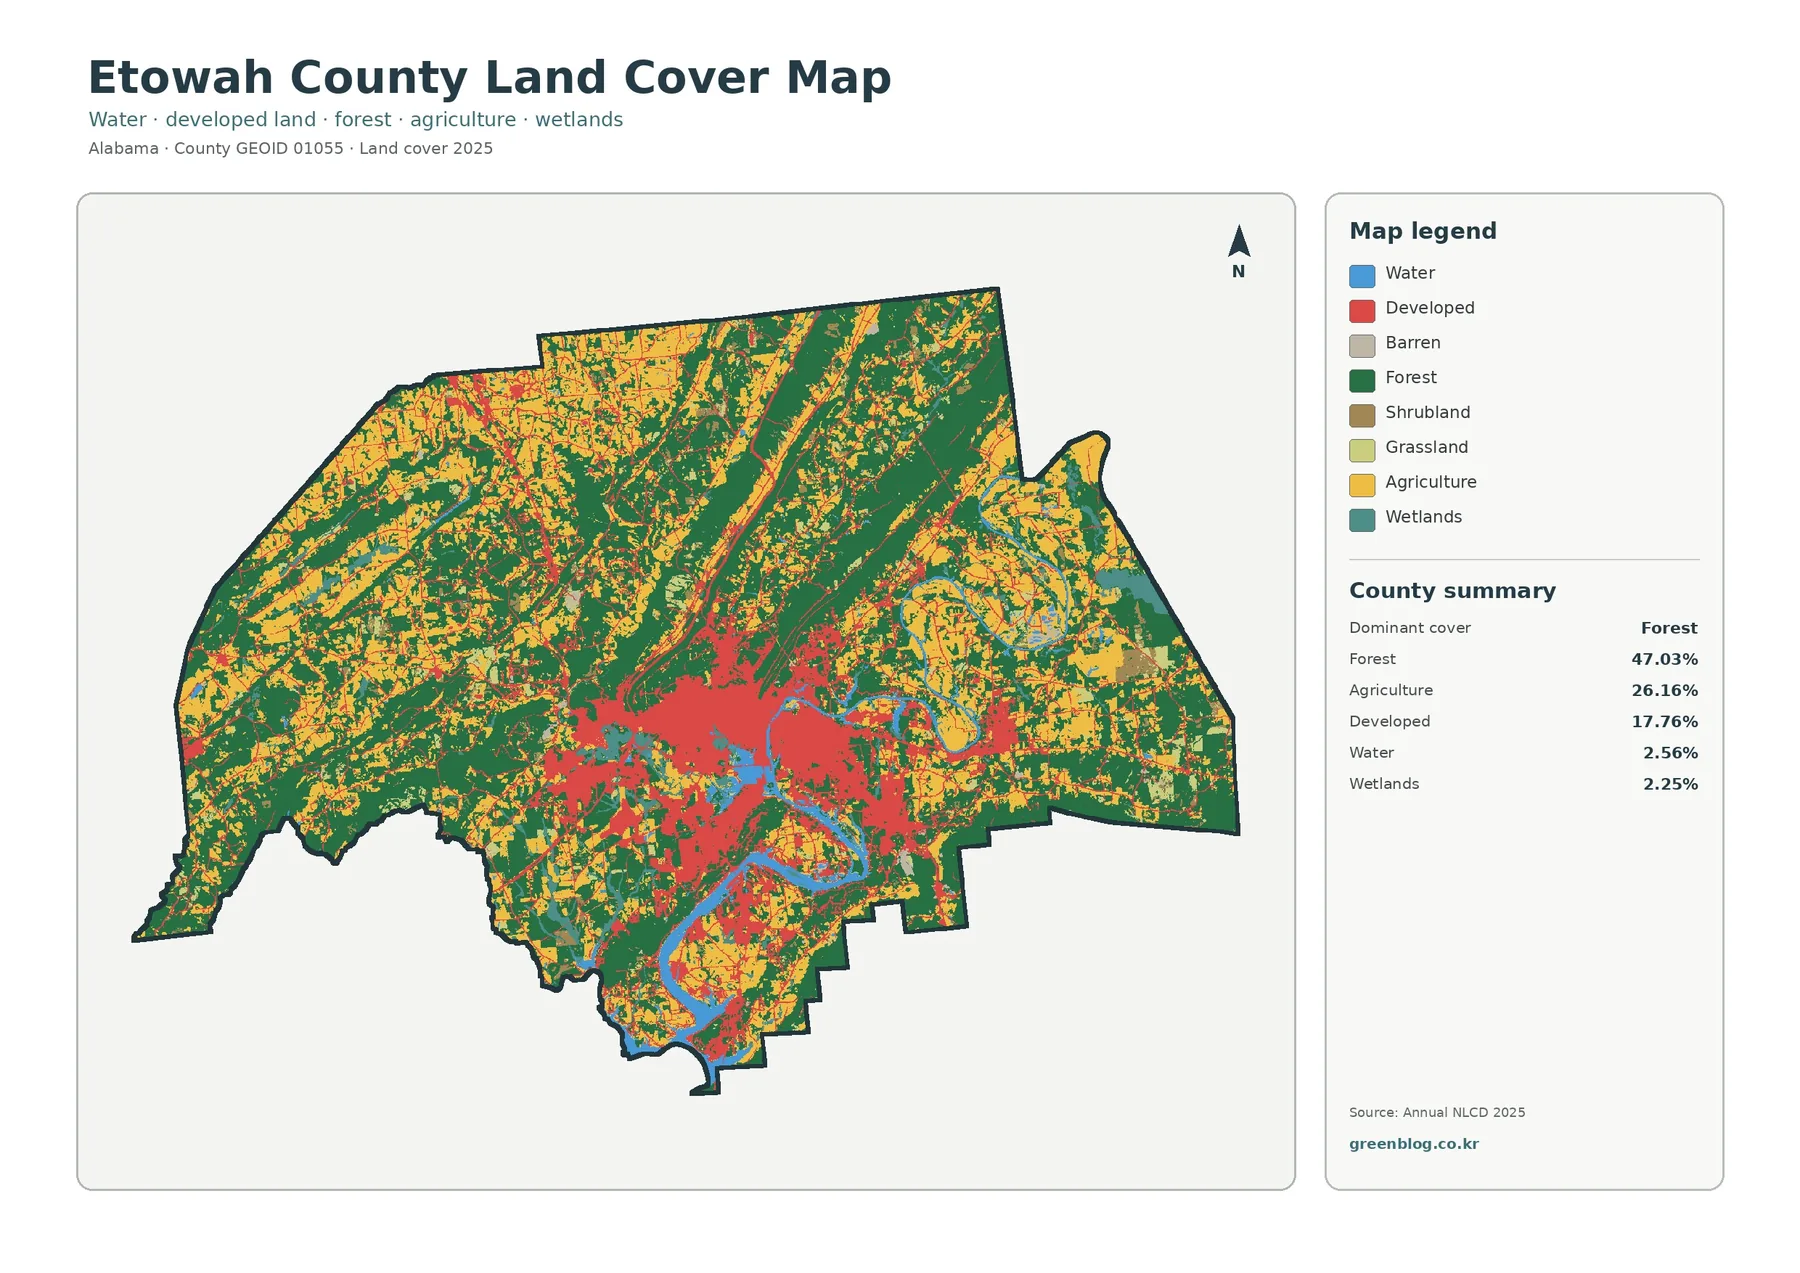
The map legend also includes barren land, shrubland, and grassland. They should be read as supporting classes rather than forced into the same level of discussion as the dominant categories. The important countywide pattern is a three-way contrast: an urbanized center with many developed cells, a substantial agricultural share that appears in repeated open patches, and extensive forest that remains common around and between those areas. This is land cover, meaning the mapped surface condition. It does not show parcel ownership, tax classification, zoning, or whether a tract can legally be developed.
Water and long forested bands make the county easier to recognize than the outline alone
Etowah County’s shape contains several projecting edges, but the internal pattern gives a stronger sense of place. The water corridor is one of the clearest guides because it runs through the same central zone where development is densest. Outside that center, long dark-green bands are visible across the northern and eastern portions of the land-cover image, with agriculture filling many of the spaces between them. The result is not a simple urban-versus-rural split. Developed cells, farms, forest, and water repeatedly meet along the margins of the Gadsden-centered built area.
The county government’s history page names Sand Mountain and Lookout Mountain among local geographic features. The thematic maps do not draw topographic contours, so they should not be used to assign a particular green strip to a named ridge from appearance alone. Still, the long, directional bands of forest and open land are useful visual clues when the land-cover set is compared with a separate elevation or topographic map. Keeping those data types separate prevents a common mistake: treating vegetation color as if it directly measured slope or elevation.
The same restraint applies near water. A blue cell represents mapped open water, while the wetland class represents a different surface category. Neither one automatically defines a floodplain, a regulated wetland boundary, a stream buffer, or a parcel setback. The map is valuable for seeing where water-related cover is concentrated in relation to forest, farms, and developed land, but regulatory decisions need current jurisdictional and site-specific information.
Forest and farmland remain widespread outside the central developed area
The forest-and-farmland view removes much of the visual competition from developed classes and makes the rural pattern easier to compare. Its summary repeats forest at 47.03% and agriculture at 26.16%, while grassland is 2.21%, wetlands 2.25%, shrubland 1.72%, and water 2.56%. Cropland and pasture or hay are displayed separately in the legend even though the summary combines them as agriculture. That matters because cultivated fields and pasture do not form identical shapes or occupy every open area for the same reason.
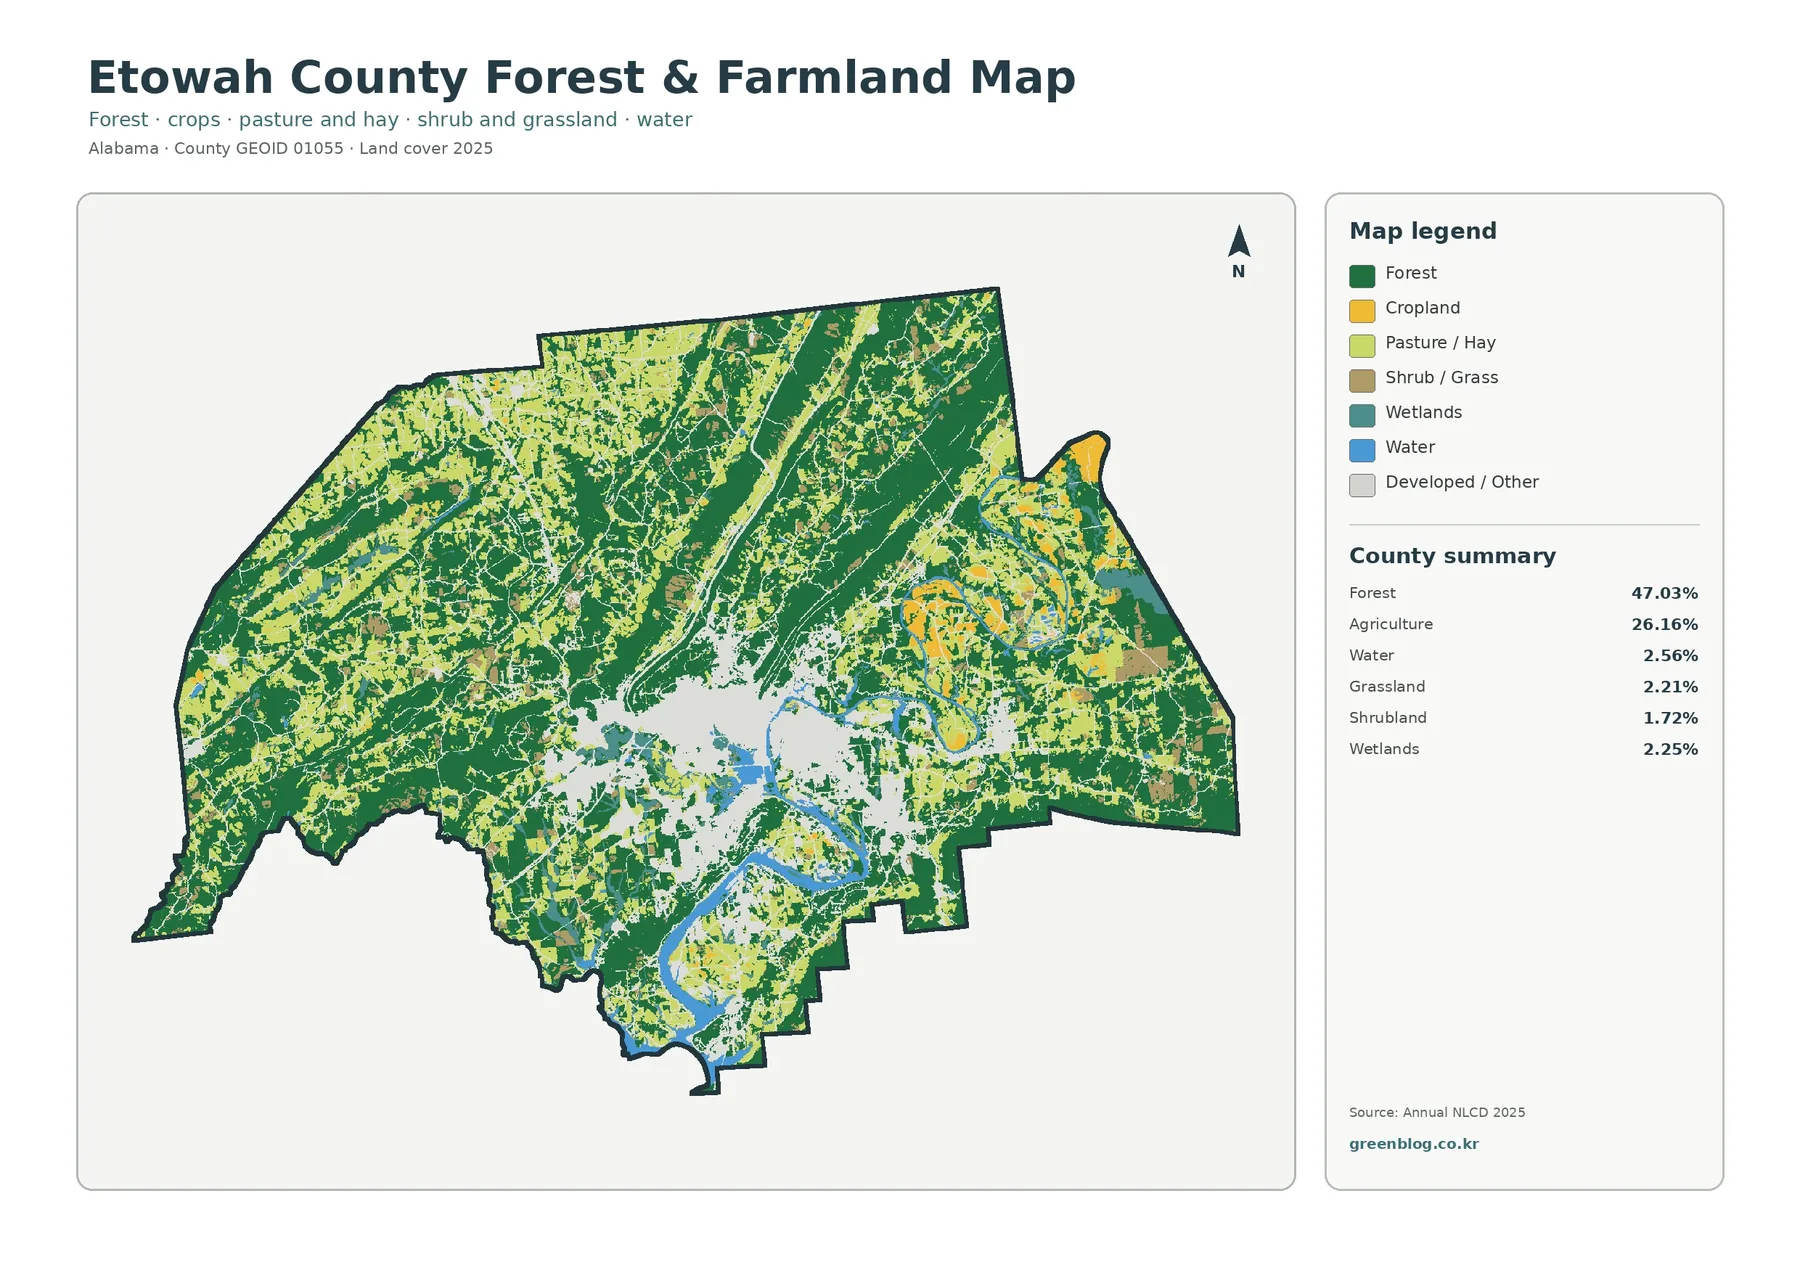
The rural map shows broad dark-green areas toward the edges of the county and many lighter agricultural patches through the interior and eastern side. Some agricultural areas appear as relatively broad blocks, while others are narrow or broken by forest. Around the central built-up zone, the white developed/other category interrupts both forest and farm colors, which helps a reader see how quickly the land-cover mix changes near the urban area. The map is therefore more informative than a countywide percentage by itself: two places can contribute to the same 26.16% agriculture total while looking very different on the ground.
For classroom or regional comparison, this map is well suited to questions about landscape composition rather than property use. A student can compare how continuous forest is in different parts of the county, identify where farmland forms larger open areas, or trace where wetlands and water cut through the rural pattern. A land manager can use it as a first-look reference before opening more detailed datasets. It should not be used to identify a farm operator, timber ownership, crop species, conservation easement, or legal land-use designation.
Impervious surface reveals how concentrated the built footprint really is
The impervious-surface map measures something narrower than developed land. Impervious surface means hard cover such as pavement and rooftops where water does not readily soak into the ground. Etowah County’s mean impervious value is 4.53%, while 2.39% of the county is mapped at 50% or greater imperviousness. Developed cover, by contrast, is 17.76%. The difference is expected because a developed land-cover cell can include lawns, trees, bare soil, and other surfaces that are not fully paved or roofed.
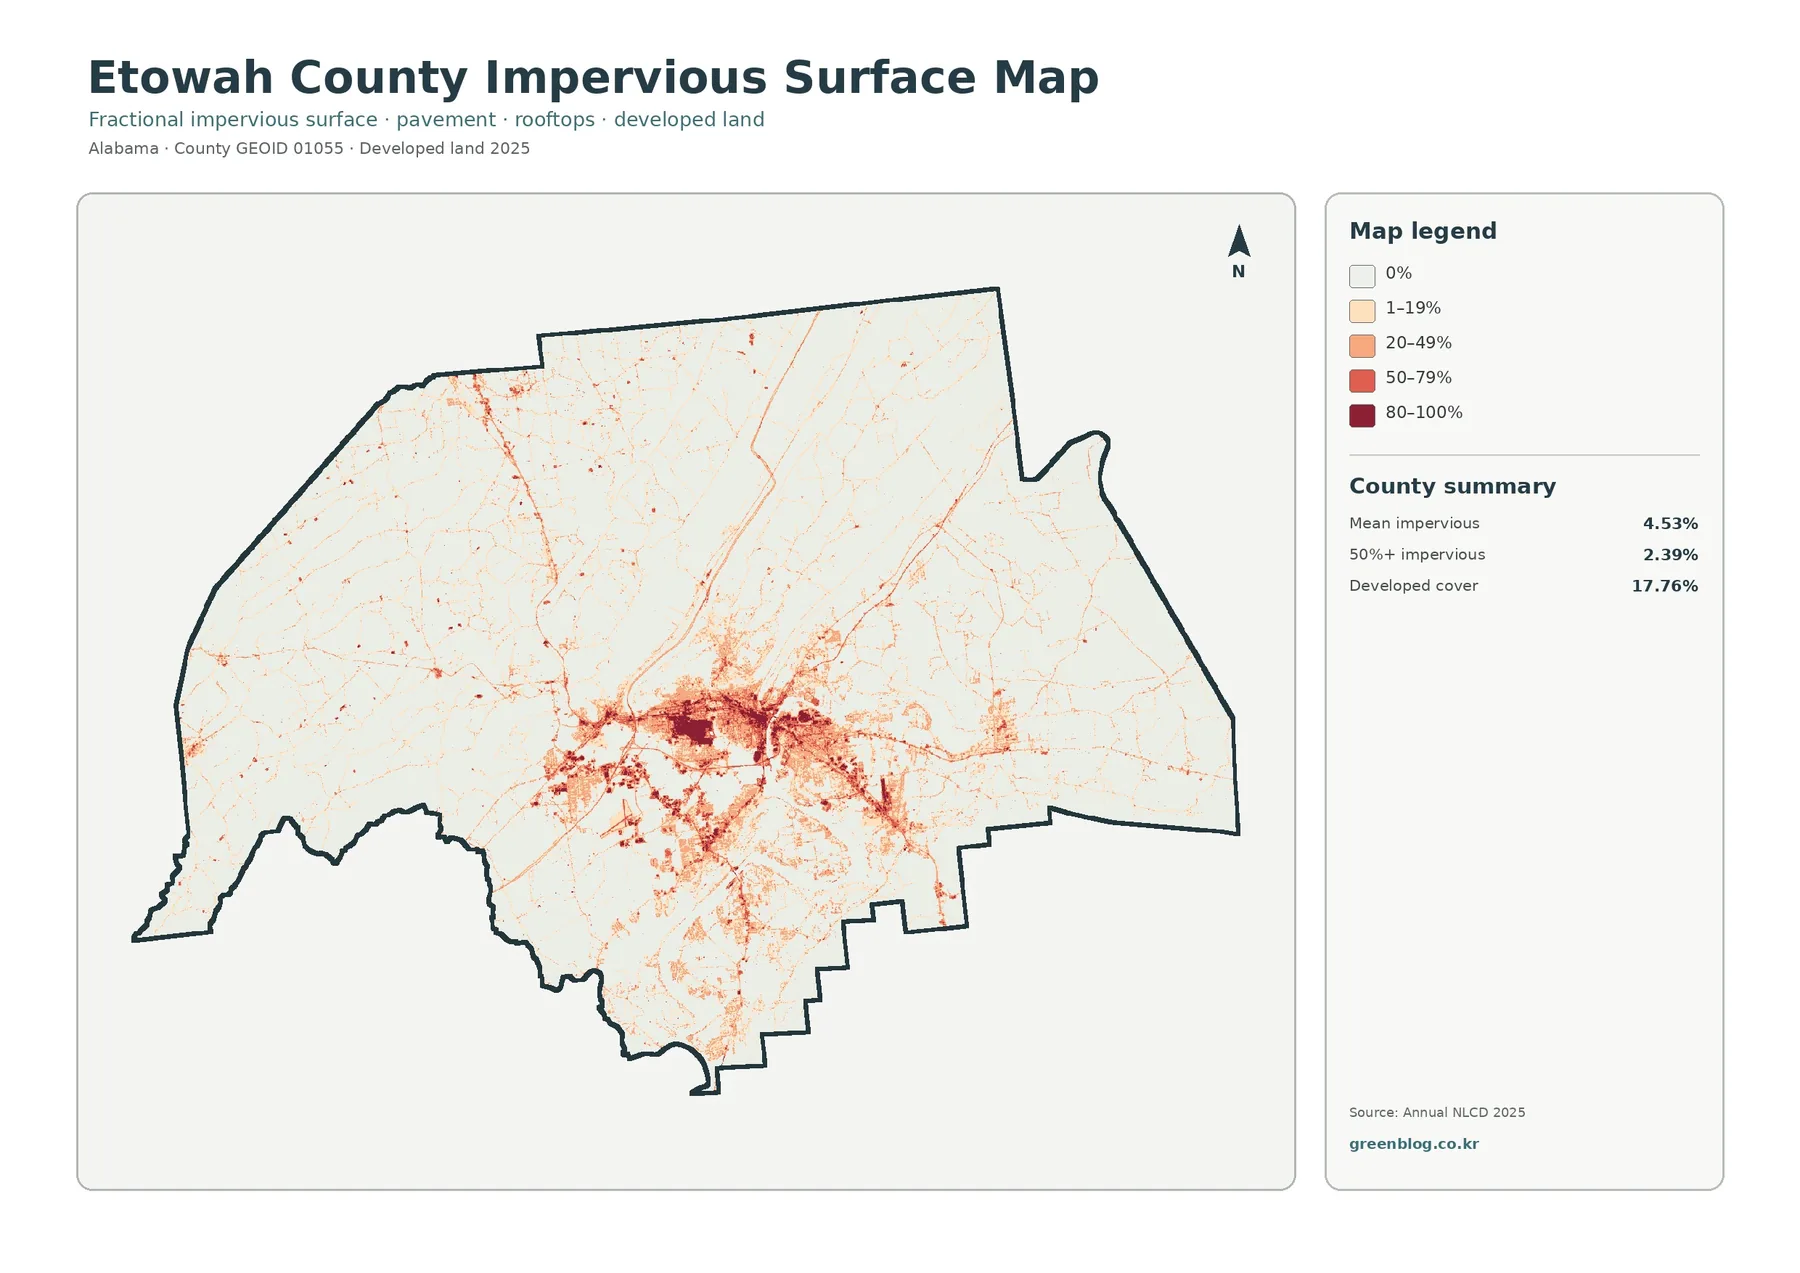
The strongest dark tones form a compact central concentration, with thinner lines and smaller clusters extending outward. That pattern is consistent with a county where the largest built footprint is centered on Gadsden and nearby communities rather than distributed evenly across every rural area. The pale background outside the center is just as informative: large portions of the county contain little mapped impervious surface even where the general land-cover map may classify scattered development. This makes the impervious image useful for comparing development intensity, not merely the presence or absence of a developed category.
For stormwater education, the distinction is important because pavement and rooftops affect runoff differently from forest, pasture, or other permeable surfaces. Etowah County’s official stormwater material discusses the Gadsden–Etowah urbanized area and identifies Neely Henry Lake on the Coosa River as a primary receiving water. The impervious map can provide a broad visual companion to that local watershed information, but it is not a drainage model. It does not show pipe networks, flow direction, detention facilities, permitted outfalls, or site-level runoff calculations.
The 1985–2025 map flags class differences without claiming a complete history
The change product compares mapped classes at two endpoints, 1985 and 2025. Its summary reports class differences across 27.69% of Etowah County. Within the highlighted categories, 4.09% is classified as to developed, 6.78% as forest loss, 2.14% as agricultural loss, and 14.48% as other class difference. A wetland-difference color is present in the legend, but the map summary does not provide a separate percentage for it, so a precise countywide wetland-change figure should not be inferred from the image.
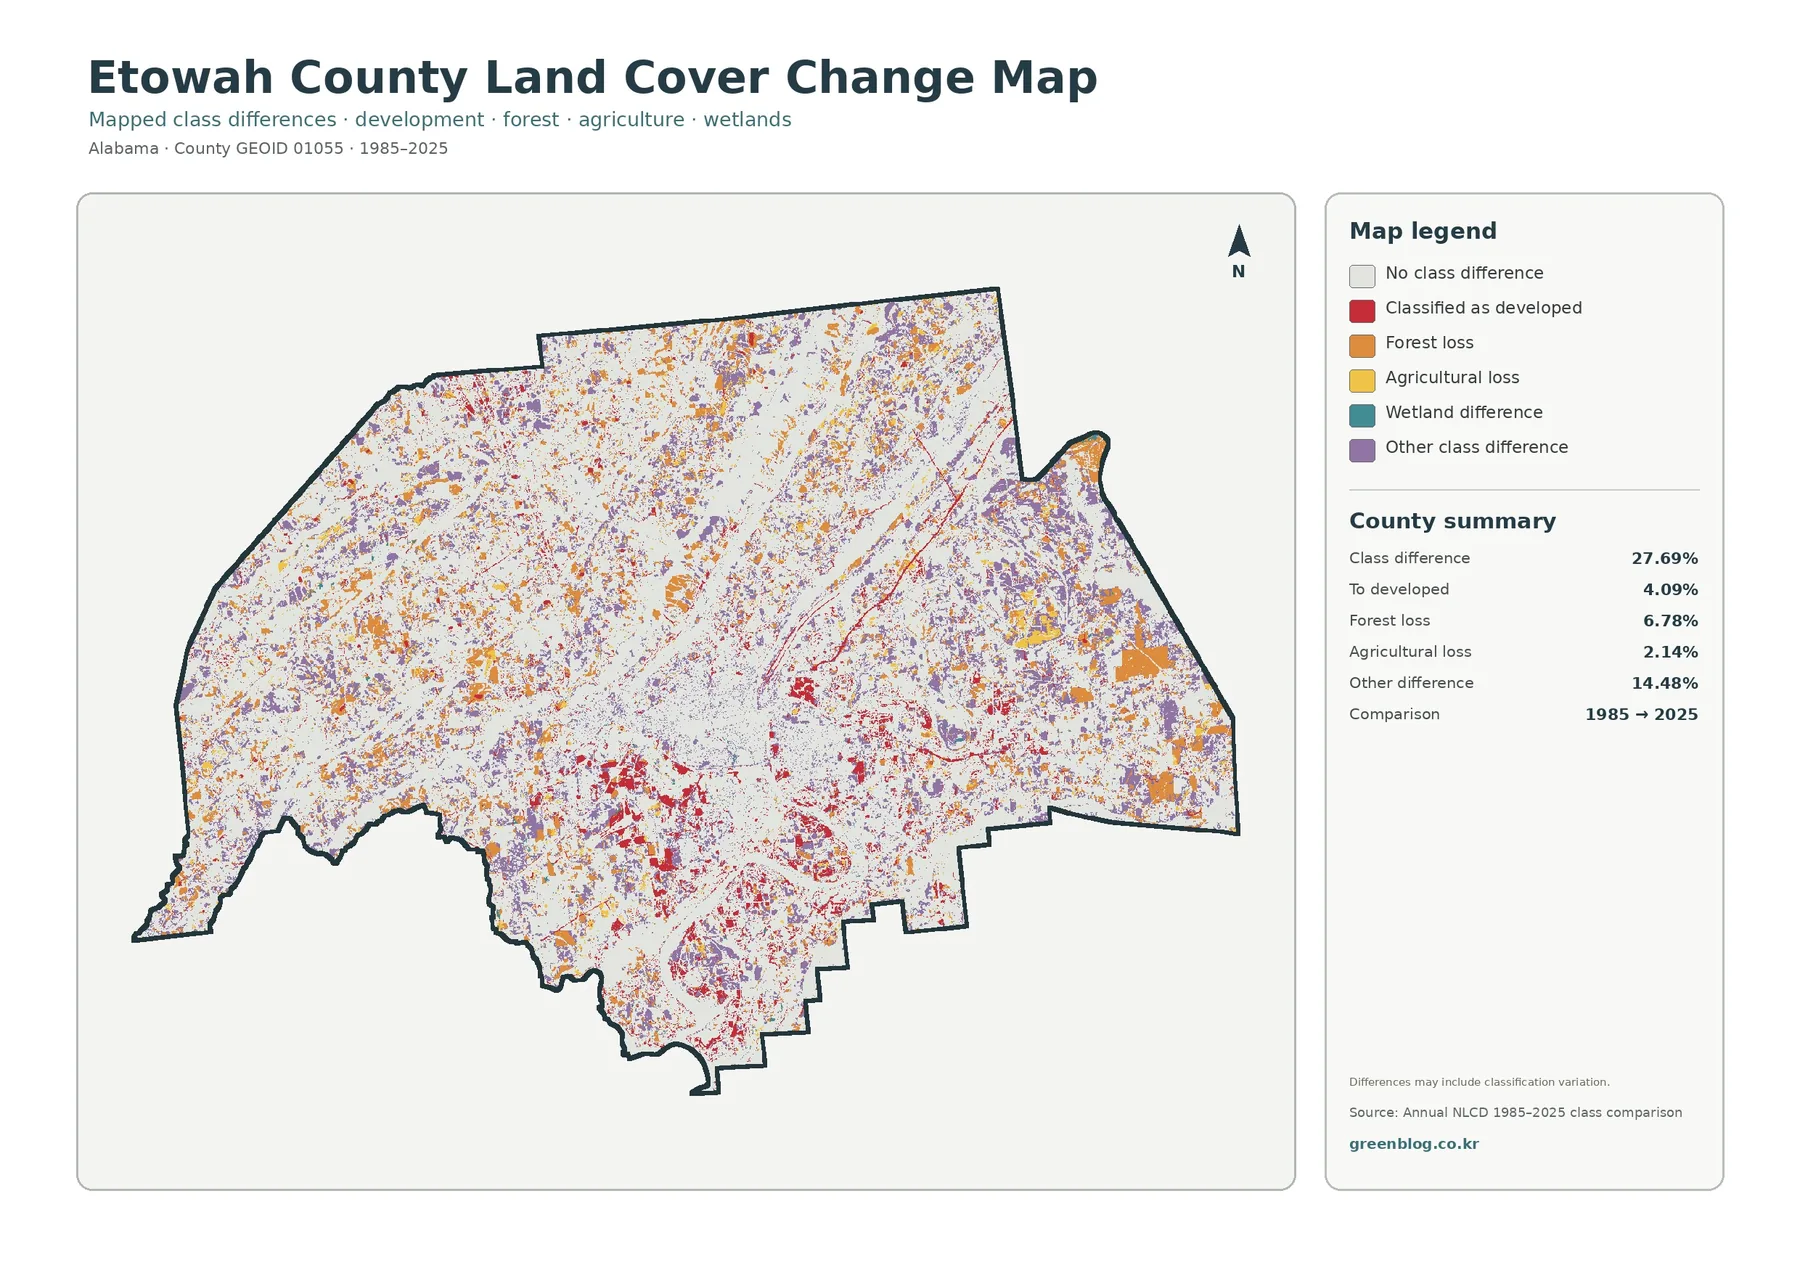
Red to-developed cells are especially visible around the present central urban area and along some narrow connecting traces, while forest-loss and other-difference colors are scattered much more widely. That distribution makes the map useful for locating places that deserve a closer look. It does not prove why a cell changed class. Construction, timber harvest, vegetation regrowth, farming, storms, image conditions, or classification rules may all be relevant in a real investigation, and this two-date image cannot separate those possibilities by itself.
The warning printed on the map is essential: differences may include classification variation. Annual land-cover products are raster datasets, and each cell is assigned a class from imagery and modeling. Mixed pixels, seasonal conditions, sensor differences, or revisions in classification can affect how the same landscape is labeled. For research that depends on the timing or cause of change, use the map as a screening tool, then examine intermediate Annual NLCD years, aerial photographs, local records, or field evidence.
Reading the four maps together prevents several common mistakes
A reliable comparison starts with the 2025 land-cover map because it establishes the full set of current classes. The forest-and-farmland map can then separate the rural categories that are easy to overlook around the developed center. The impervious map answers a different question by showing the hard-surface share within the built landscape. Finally, the 1985–2025 comparison identifies cells whose mapped class differs between the two endpoints. Keeping those questions separate prevents a present-day developed cell from being described automatically as new development.
The numbers reinforce that distinction. Developed land is 17.76% in 2025, but only 4.09% is labeled “to developed” in the endpoint comparison. Mean imperviousness is 4.53%, which is smaller again because it measures hard-surface fraction rather than a categorical developed class. Likewise, forest covers 47.03% today even though 6.78% is marked as forest loss in the comparison. Those values describe different measurements and should not be added, subtracted, or treated as a single change rate.
When comparing Etowah County with another county, use the same map type and observation year on both sides. A forest percentage from the general 2025 map is comparable to the same 2025 summary elsewhere; an impervious mean should be compared with another impervious mean, not with developed-cover percentage. This simple discipline makes the set more useful for statewide projects, school assignments, county profiles, and presentations because the visual differences are tied to matching measures.
The downloadable JPG set works best as a reference graphic, not a survey
The four original JPGs use the same Etowah County extent and are useful when a project needs a consistent sequence of images. A report can introduce the overall 2025 cover first, move to the forest-and-farm pattern, focus on built surfaces, and finish with the long-term class comparison. For a classroom exercise, students can compare the central developed area with the surrounding forest and agriculture, then discuss why water, wetlands, developed cover, and imperviousness are related but not interchangeable.
Each supplied JPG is 2480 × 1754 pixels, while the article previews are 1800 × 1273 WebP images. The files are kept at the supplied source resolution rather than being artificially enlarged. For large-format printing, test labels and legend readability at the intended physical size instead of assuming that enlargement creates additional map detail.
Scale and classification limits matter when the maps are used for decisions
Annual NLCD land cover is raster data, so the county is represented by a grid of cells rather than surveyed parcel polygons. At roughly 30-meter land-cover resolution, a narrow road, small stream, field edge, building, or patch of trees can share a cell with another surface. The assigned class is therefore a generalized description of the surface at that scale. A sharp color edge in the JPG should not be treated as a property line or an engineering-grade boundary.
Land cover is also different from land use. A cell mapped as agriculture does not prove agricultural zoning, ownership, tax treatment, or a specific crop. A forest cell does not identify public land or a timber-management plan. Developed cover does not establish a building right, and a mapped wetland class is not a legal wetland determination. Etowah County’s own mapping office maintains property-oriented mapping resources for assessment purposes, which illustrates why parcel and tax mapping should be consulted separately from this thematic land-cover set.
The date must remain visible in any interpretation. The current maps summarize 2025, and the comparison uses 1985 and 2025 endpoints. Conditions after 2025 are outside the dataset shown here. A site may also have changed more than once during the forty-year interval without that sequence appearing in a two-date comparison. For recent construction, current forestry activity, new roads, or site-specific environmental work, check newer imagery and authoritative local information before drawing conclusions.
Frequently Asked Questions
What is the largest land-cover class in Etowah County?
Forest is the largest class in the supplied 2025 summary at 47.03%. Agriculture follows at 26.16%, and developed land is 17.76%. Water accounts for 2.56% and wetlands 2.25%. The map shows that these classes are not evenly distributed: the strongest developed concentration is central, while forest and farmland remain widespread around it.
Why are developed land and impervious surface percentages different?
They measure different things. Developed land is a categorical land-cover class and can include lawns, trees, and other permeable surfaces within settled areas. Imperviousness estimates the fraction covered by hard surfaces such as pavement and rooftops. Etowah County is 17.76% developed in the land-cover summary, while mean imperviousness is 4.53% and 2.39% of the county is at least 50% impervious.
Does the 27.69% class-difference value mean that more than a quarter of the county was physically transformed?
Not necessarily. It means 27.69% of the mapped cells received a different class in the 1985 and 2025 endpoint comparison. The map explicitly warns that classification variation may be included. Some differences can reflect real land-cover change, while others may involve mixed pixels, imagery conditions, class definitions, or mapping methods. Use the change map to locate areas for follow-up rather than as a complete causal history.
Map File Information
The ZIP contains four original JPG maps for Etowah County: 2025 land cover, forest and farmland, impervious surface, and mapped land-cover class differences from 1985 to 2025.
- File Type: ZIP containing four JPG images
Related Maps
- Autauga County Alabama Land Cover Map
- Baldwin County Alabama Land Cover Map
- Barbour County Alabama Land Cover Map
Sources and data notes
- MRLC Annual NLCD Data — source portal for the land-cover and developed-surface datasets used for the thematic maps.
- USGS Annual NLCD Land Cover Classification — official explanation of the mapped land-cover classes.
- Etowah County: County History — county source identifying Gadsden as the county seat and describing the county’s northeastern Alabama setting and local geographic features.
- Etowah County 2023–2024 Annual Stormwater Report — county stormwater document with the Gadsden–Etowah urbanized area, Coosa River, Neely Henry Lake, and watershed references.
- U.S. Census Bureau TIGER/Line Shapefiles — official geographic boundary reference.
Green Map creates custom-edited map images using open geographic data sources such as geoBoundaries, Natural Earth, OpenStreetMap, and government open data.
These maps are edited visual materials, not raw data files, and are provided for education, documents, presentations, and graphic reference.