Dallas County Alabama Land Cover Map compares 2025 land cover, forest and farmland, fractional impervious surface, and mapped class differences from 1985 to 2025. Forest, wetlands, and agriculture cover most of the county, while the strongest developed cluster appears around Selma.
The four original 2480 × 1754 JPG maps are available in one ZIP. Use the WebP previews for quick reading online and the JPG set for printing, classroom comparison, reports, or presentations.
Table of Contents
A river-centered county with three major cover types
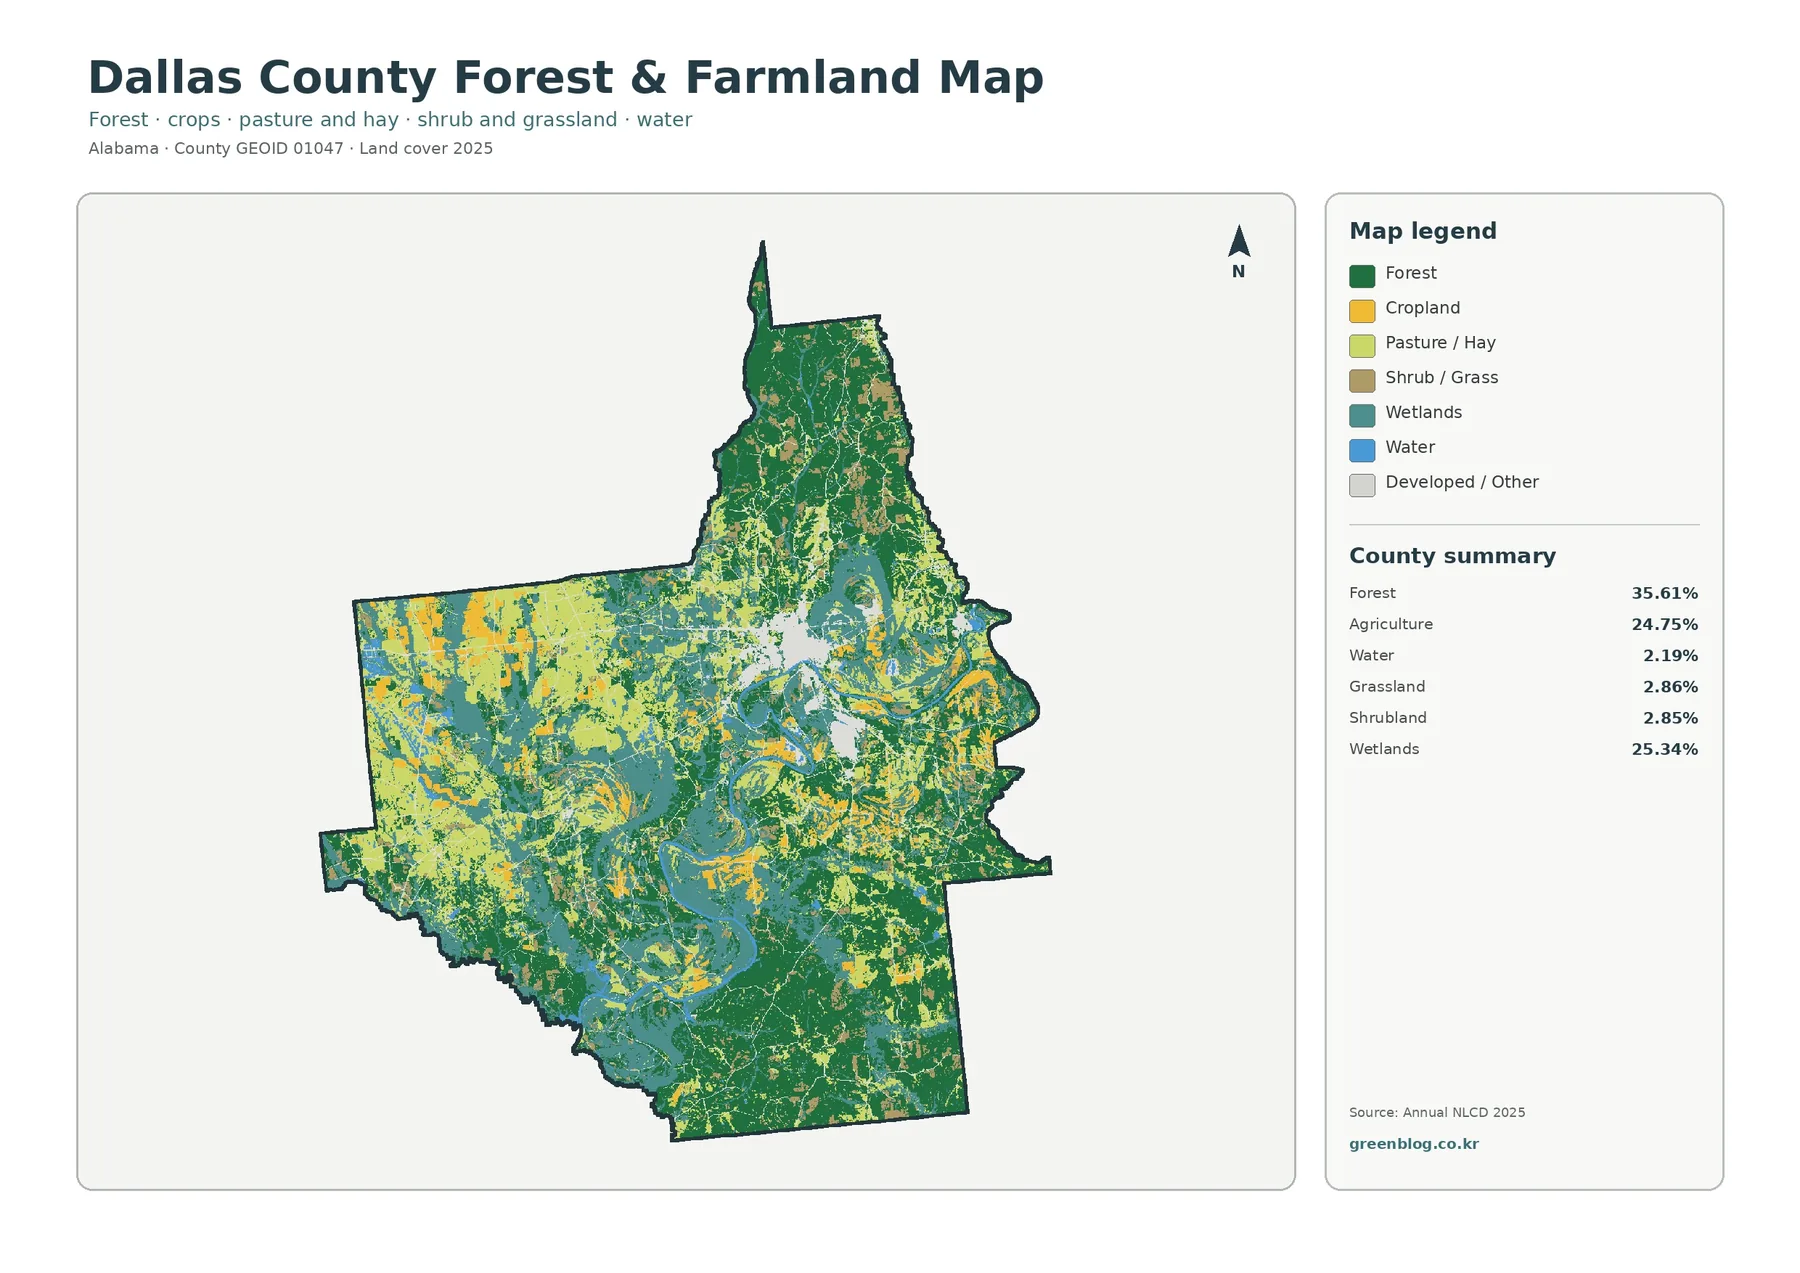
The 2025 county summary gives forest the largest share at 35.61%. Wetlands account for 25.34% and agriculture for 24.75%, so those three categories together define most of the visible landscape. Developed land is 6.24%, and grassland is 2.86%. The forest-and-farmland view also reports 2.19% water and 2.85% shrubland. These figures matter because Dallas County is not visually dominated by a single uniform cover. Large wooded tracts, farmed areas, wet ground, open water, and a compact urban center are interwoven across the county.
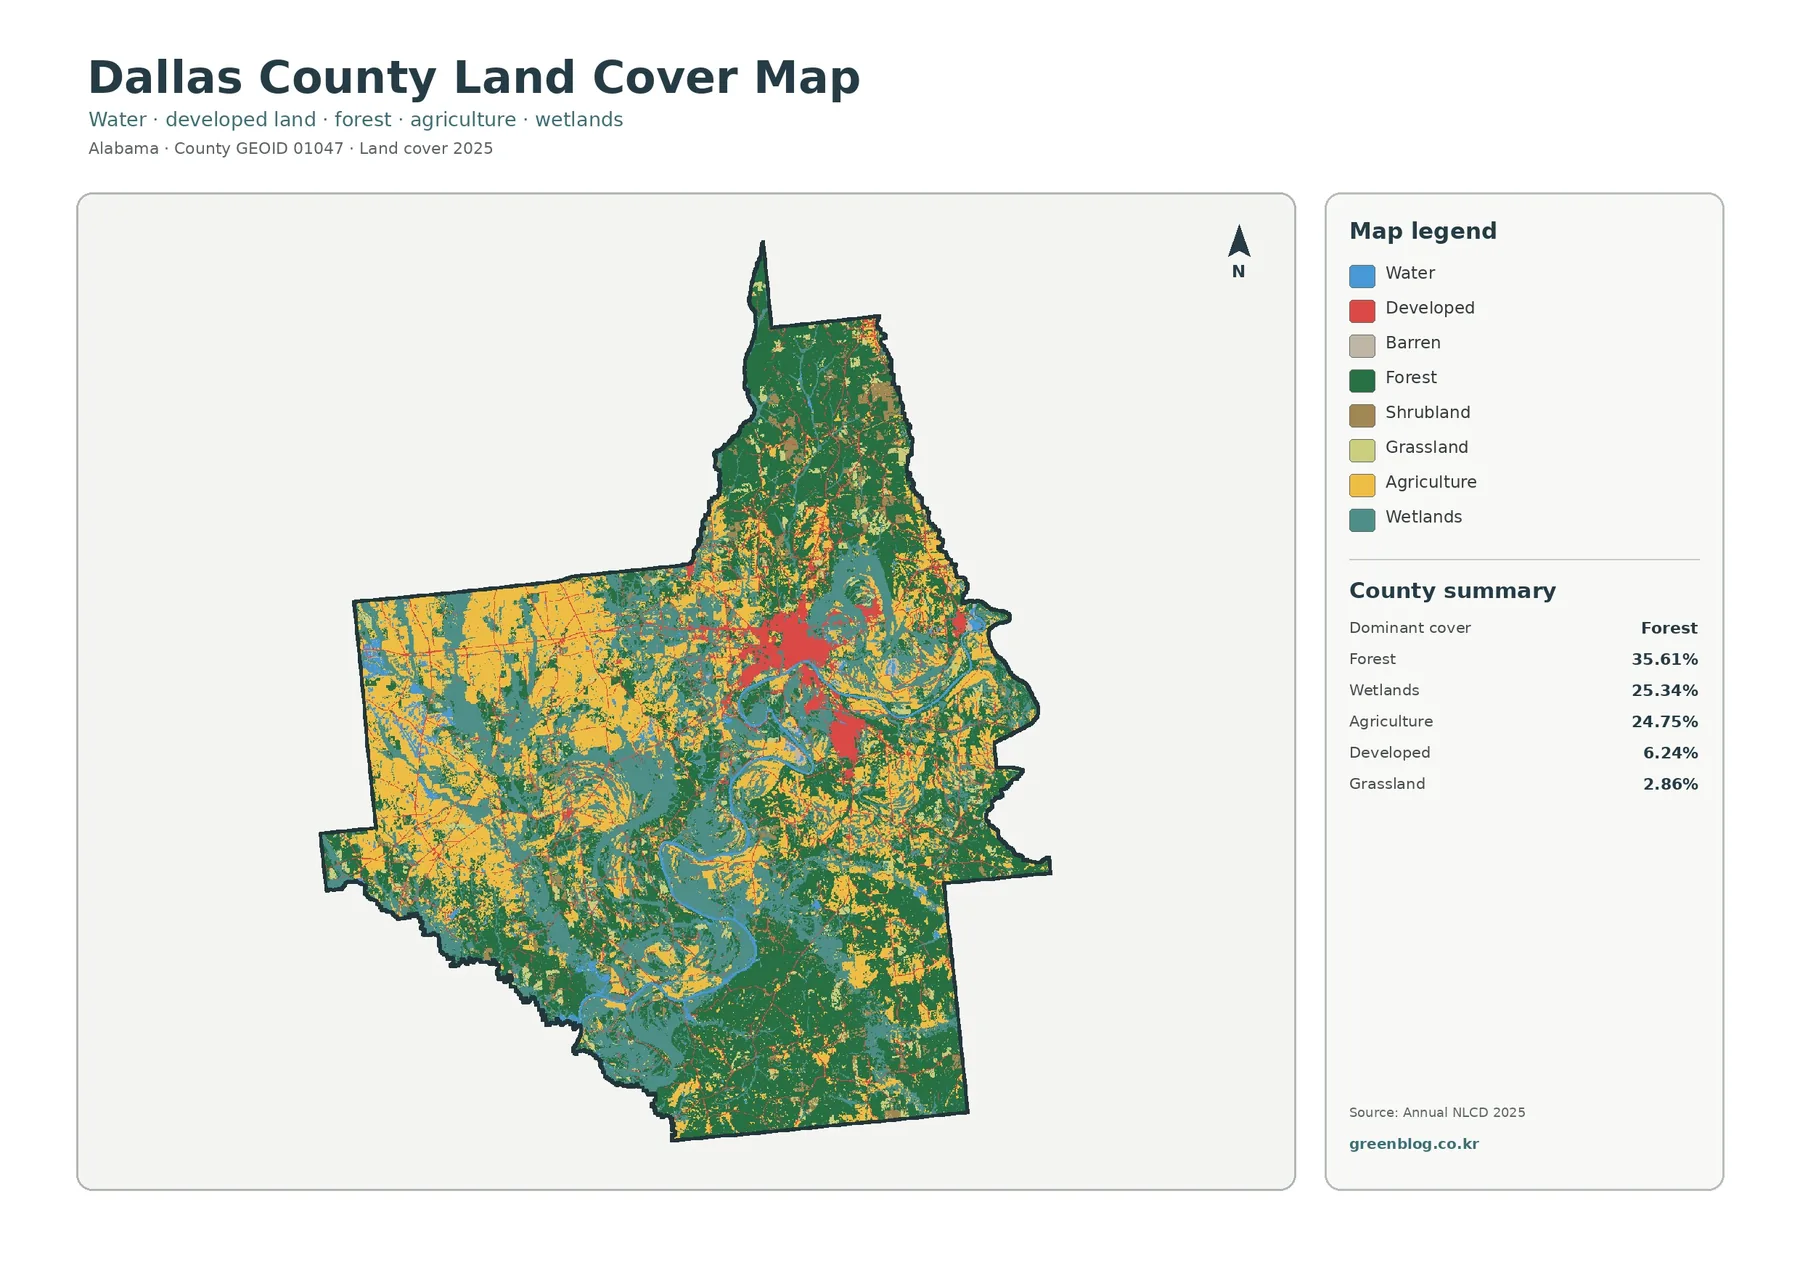
The general map works best as the overview because it keeps the main classes together. Forest is especially prominent in the northern extension and across much of the southeast, while broad agricultural patches are easy to see in the western half. Wetlands broaden through the central and southern river corridor. Near Selma, red developed classes interrupt that rural pattern and create the county’s most obvious built-up concentration. Barren land appears in the legend but is not a leading category in the county summary, which is consistent with its limited visual presence.
Selma stands out when land cover is replaced by impervious percentage
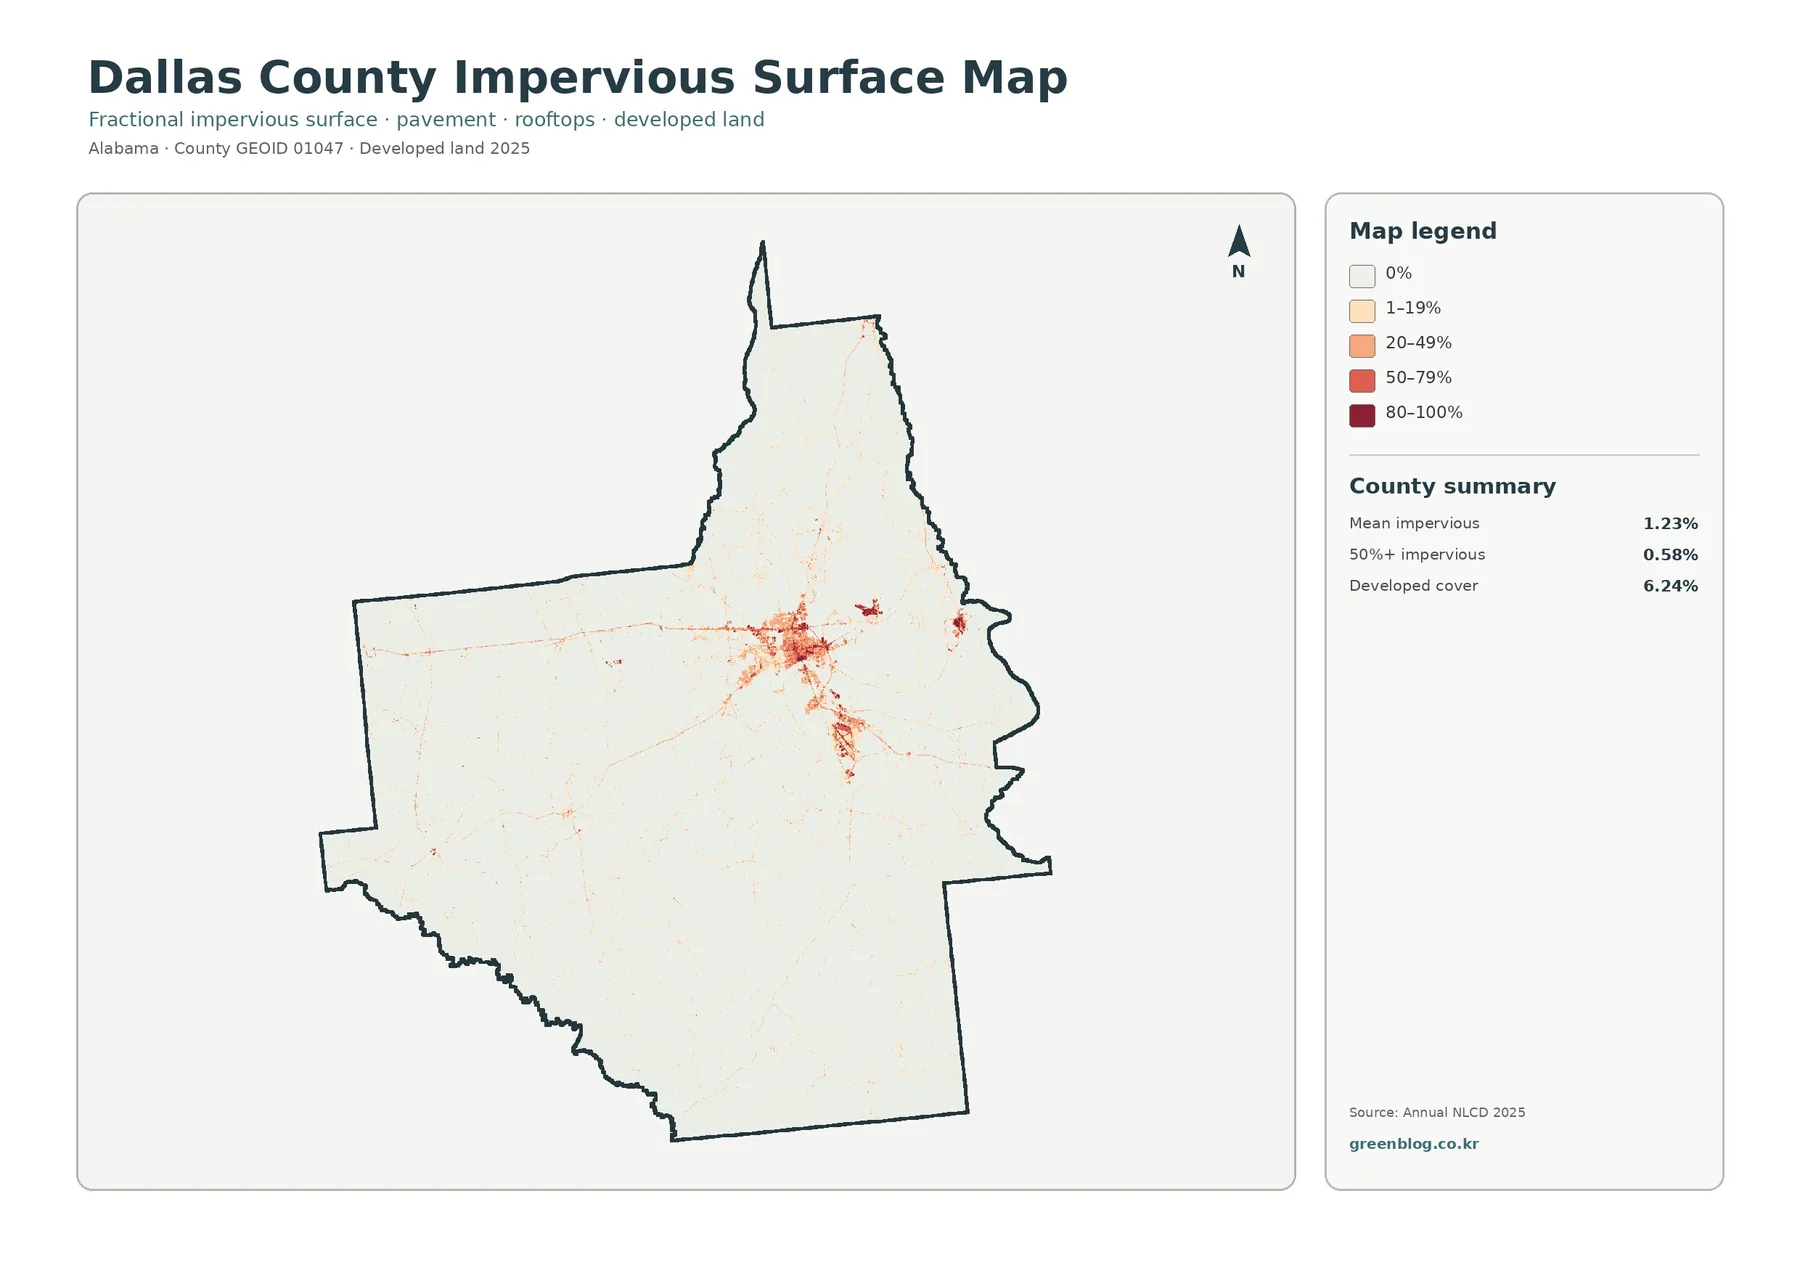
The impervious-surface map strips away most vegetation classes and asks a narrower question: how much of each mapped cell is covered by hard surfaces such as pavement and rooftops? Almost the entire county is pale, but the Selma area forms a compact red and orange cluster. Thin lower-value traces extend away from that center, producing a pattern that resembles a network rather than a continuous urban blanket. Because road names are not printed on this map, those lines should be treated as impervious corridors rather than identified as particular highways without a separate transportation layer.
Countywide mean imperviousness is 1.23%, and only 0.58% of the mapped area is at least 50% impervious. Developed cover, however, is 6.24%. The difference is useful rather than contradictory. A land-cover class labels the predominant character of a cell, while the fractional impervious product estimates the share actually sealed by hard material. A low-density residential cell can therefore be classified as developed while still containing substantial grass, trees, or bare soil.
Forest and farmland reveal the rural mosaic hidden in the overview
Removing most developed detail makes the agricultural landscape easier to interpret. Dark green forest covers large parts of the north, southeast, and many smaller blocks elsewhere. Cropland is especially visible as yellow patches across the west and west-central portions of the county. Pasture and hay add lighter green areas between fields and woods, while shrub and grass occupy smaller pieces of the same rural matrix. Wetlands remain a major presence, especially near the central river corridor, so the map never becomes a simple forest-versus-farm split.
What the 1985–2025 difference map can and cannot say
The supplied change map compares mapped classes from 1985 and 2025. Its summary reports a class difference across 31.50% of the county. Within the displayed categories, 1.27% is marked as classified to developed, 4.34% as forest loss, 8.08% as agricultural loss, and 16.80% as other difference. Red change pixels are most noticeable around Selma and a number of smaller locations, while orange, yellow, purple, and wetland-related differences are scattered much more widely. The pattern is therefore broader than urban growth alone.
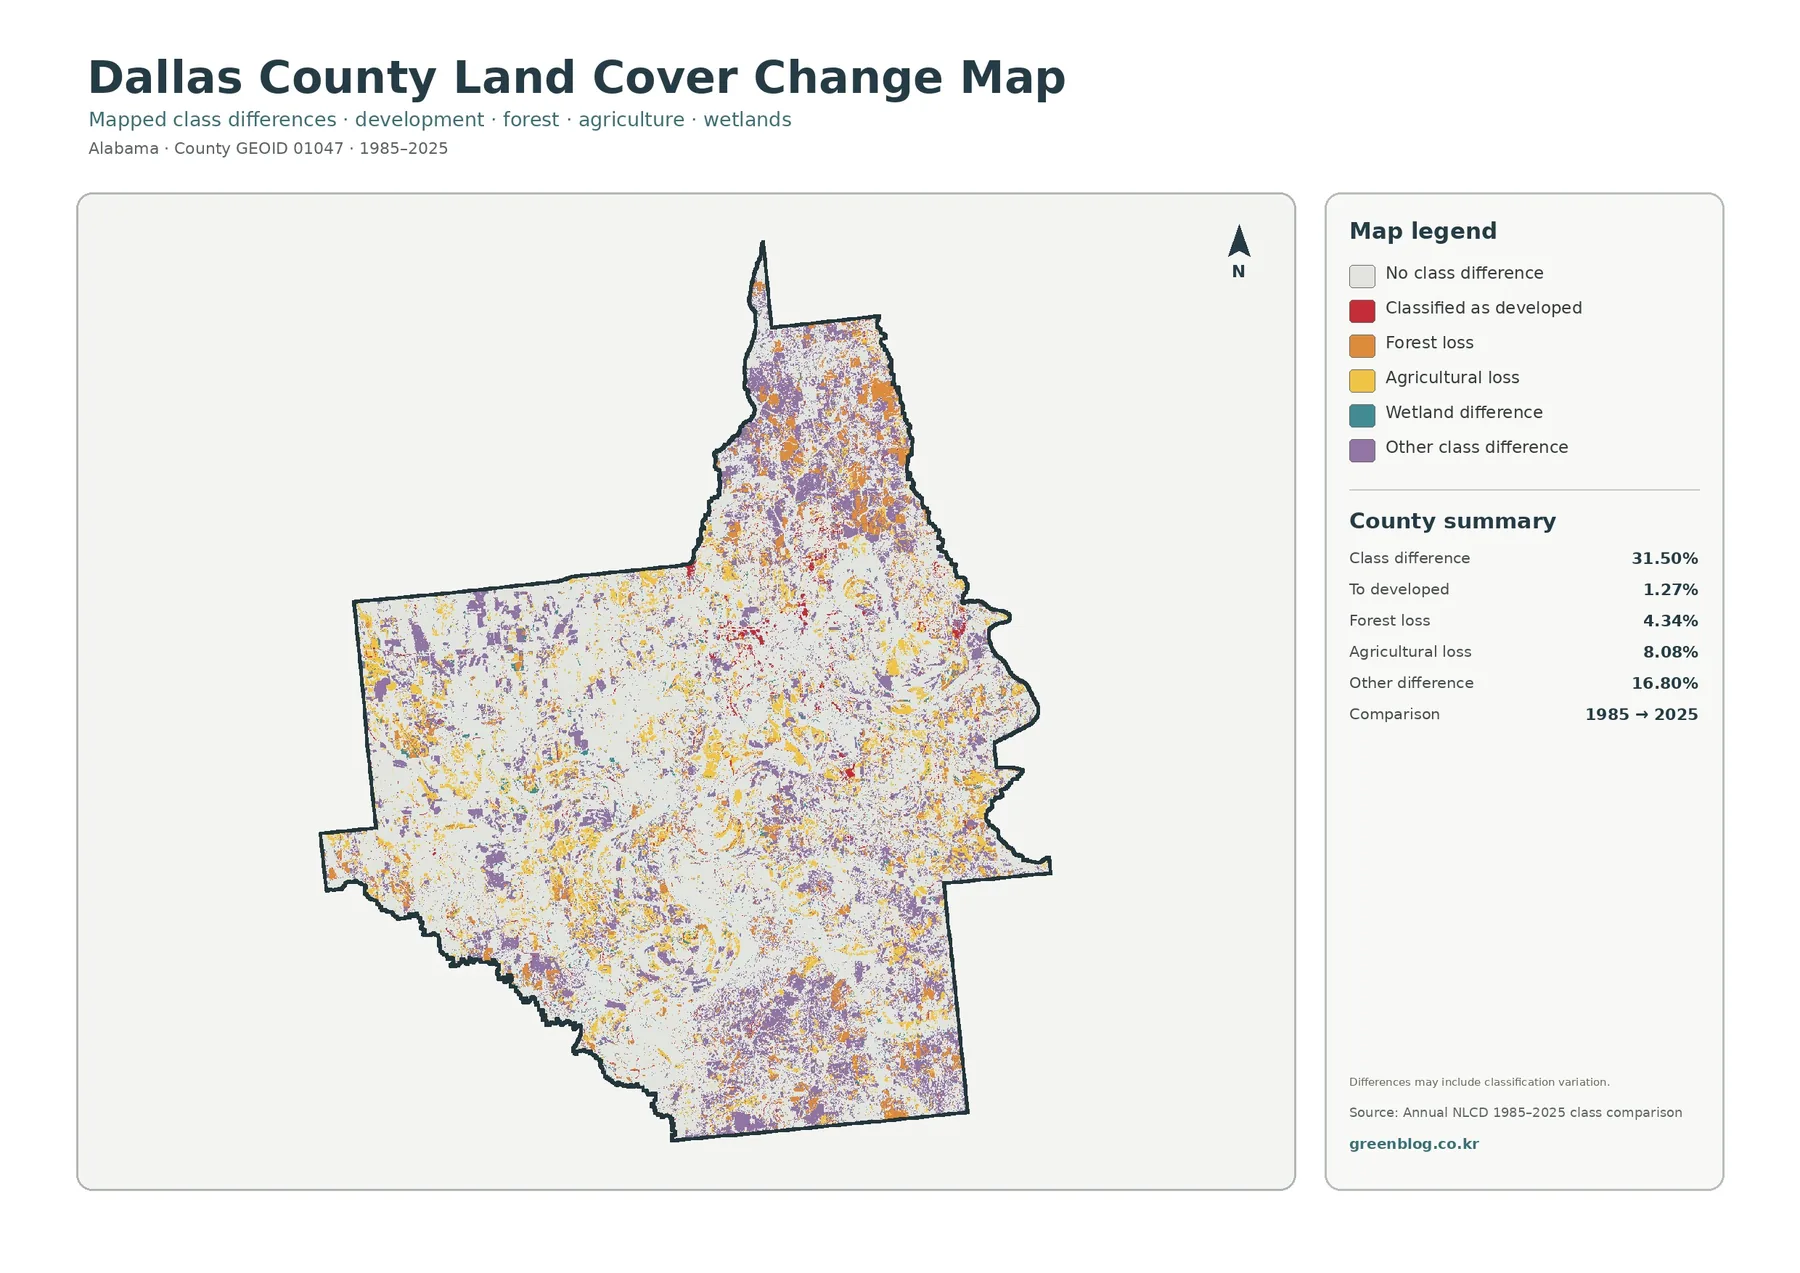
A colored change pixel should not automatically be called permanent conversion. The map itself warns that differences may include classification variation. Annual NLCD is a 30-meter raster product, and mixed pixels at field edges, wetland boundaries, forest margins, or narrow corridors can be assigned differently when the dominant signal changes. Agricultural cycles can also make endpoint comparisons more complicated. The correct use is to flag places worth checking, then consult the underlying yearly data, aerial imagery, or another authoritative source before making a claim about development, clearing, restoration, or habitat loss.
Choose the map that matches the question
Use the general land-cover map when the goal is to describe Dallas County as a whole. It is the quickest way to compare the Selma developed cluster with the Alabama River wetland corridor, western agricultural areas, and broad forest cover. Switch to the forest-and-farmland view when the distinction between cropland, pasture/hay, forest, and other open cover matters. The impervious map is more appropriate when a report is about built surfaces, runoff context, or the concentration of roads and structures. The change view belongs in projects that ask where classifications differ across time.
Download the four original JPG maps
Each online preview is 1800 × 1273 pixels, while the download preserves the supplied 2480 × 1754 JPG originals. The originals also keep the legend and summary text clearer than a screen capture of the page.
Scale, classification, and legal-use limits
Annual NLCD is a raster dataset produced at 30-meter spatial resolution for the conterminous United States. In plain terms, the landscape is divided into grid cells, and each cell carries a representative class or a fractional value. Small buildings, narrow streams, thin tree lines, and field edges can be smaller than a cell or mixed within one cell. The map therefore generalizes the ground. It is very useful for county-scale patterns but should not be treated as a parcel survey or as evidence of an exact boundary around a farm, wetland, or developed lot.
Land cover is also different from zoning, ownership, and legal land use. A cell classified as agriculture does not tell you who owns it or whether the parcel is legally zoned for farming. A developed class does not establish that new construction is permitted there. Wetland classification is not a substitute for a regulatory wetland determination. For property decisions, permitting, flood analysis, or engineering, pair these images with the appropriate current county, state, or federal data and field verification.
Frequently Asked Questions
What is the largest land-cover class in Dallas County?
Forest is the largest class in the supplied 2025 summary at 35.61%. Wetlands are 25.34% and agriculture is 24.75%, so the county is better understood as a mix of three large rural and natural cover groups than as a place dominated by forest alone.
Why is developed cover 6.24% when mean imperviousness is only 1.23%?
They measure different things. Developed land is a categorical land-cover label, while fractional impervious surface estimates the share of each cell covered by hard surfaces such as pavement or rooftops. A developed cell can still contain lawns, trees, soil, or other permeable ground, especially in lower-density areas.
Does every colored pixel on the change map prove that the land was converted?
No. The map identifies a difference in mapped class between the comparison years, and the supplied note says classification variation may be included. Use the change image to locate candidate areas, then verify important claims with yearly land-cover data, aerial imagery, or other authoritative records.
Map File Information
The download combines four original JPG maps of Dallas County so the same area can be compared across land cover, forest and farmland, impervious surface, and mapped change.
- File Type: ZIP containing four JPG images
Related Maps
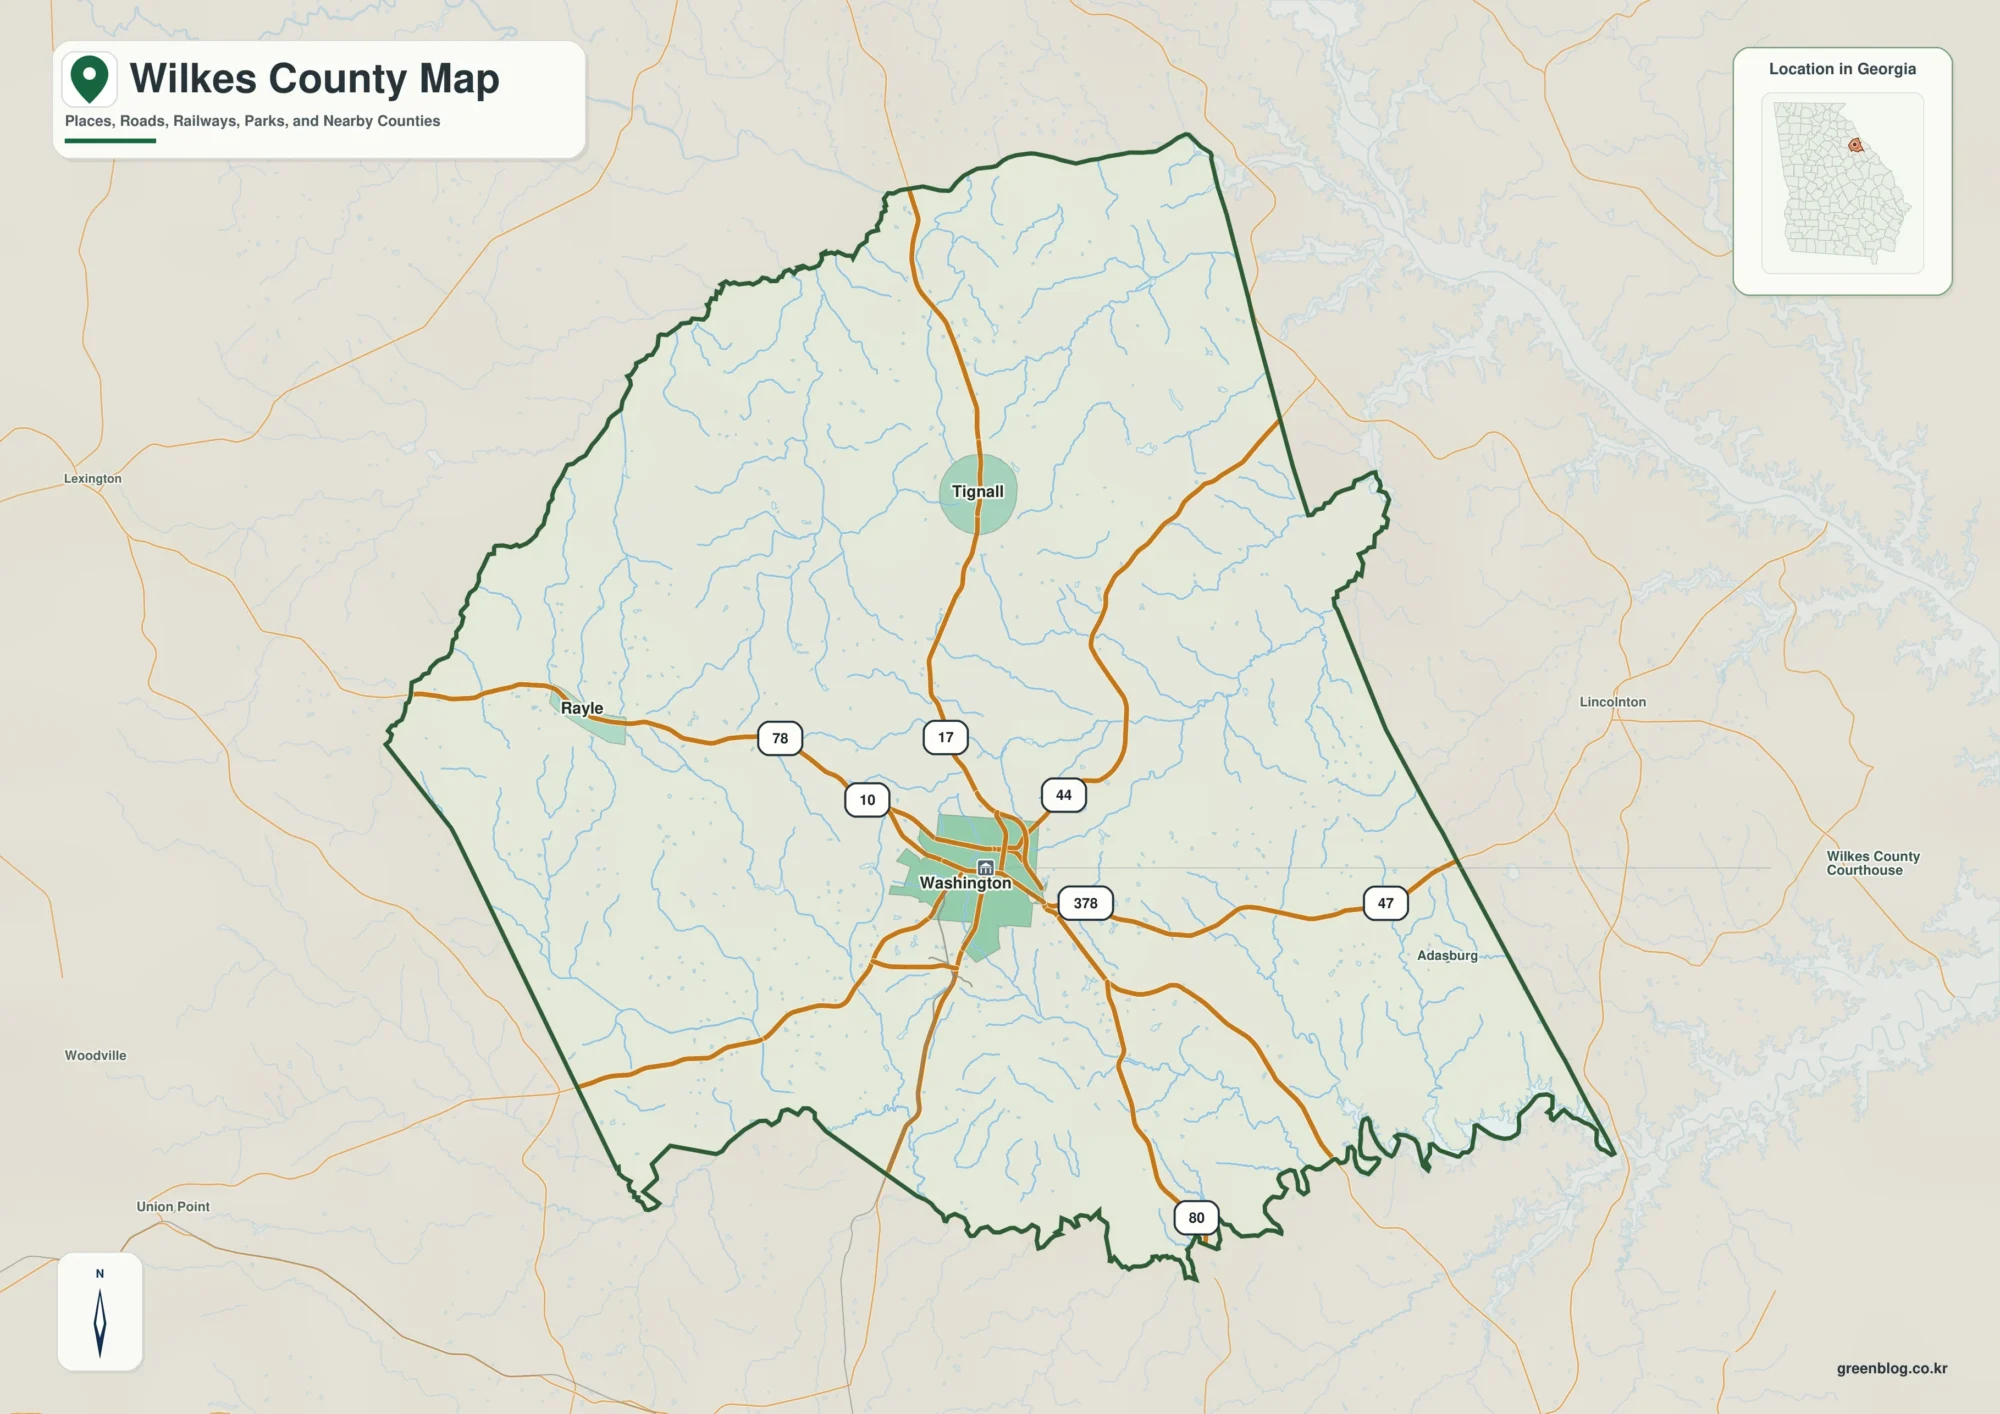
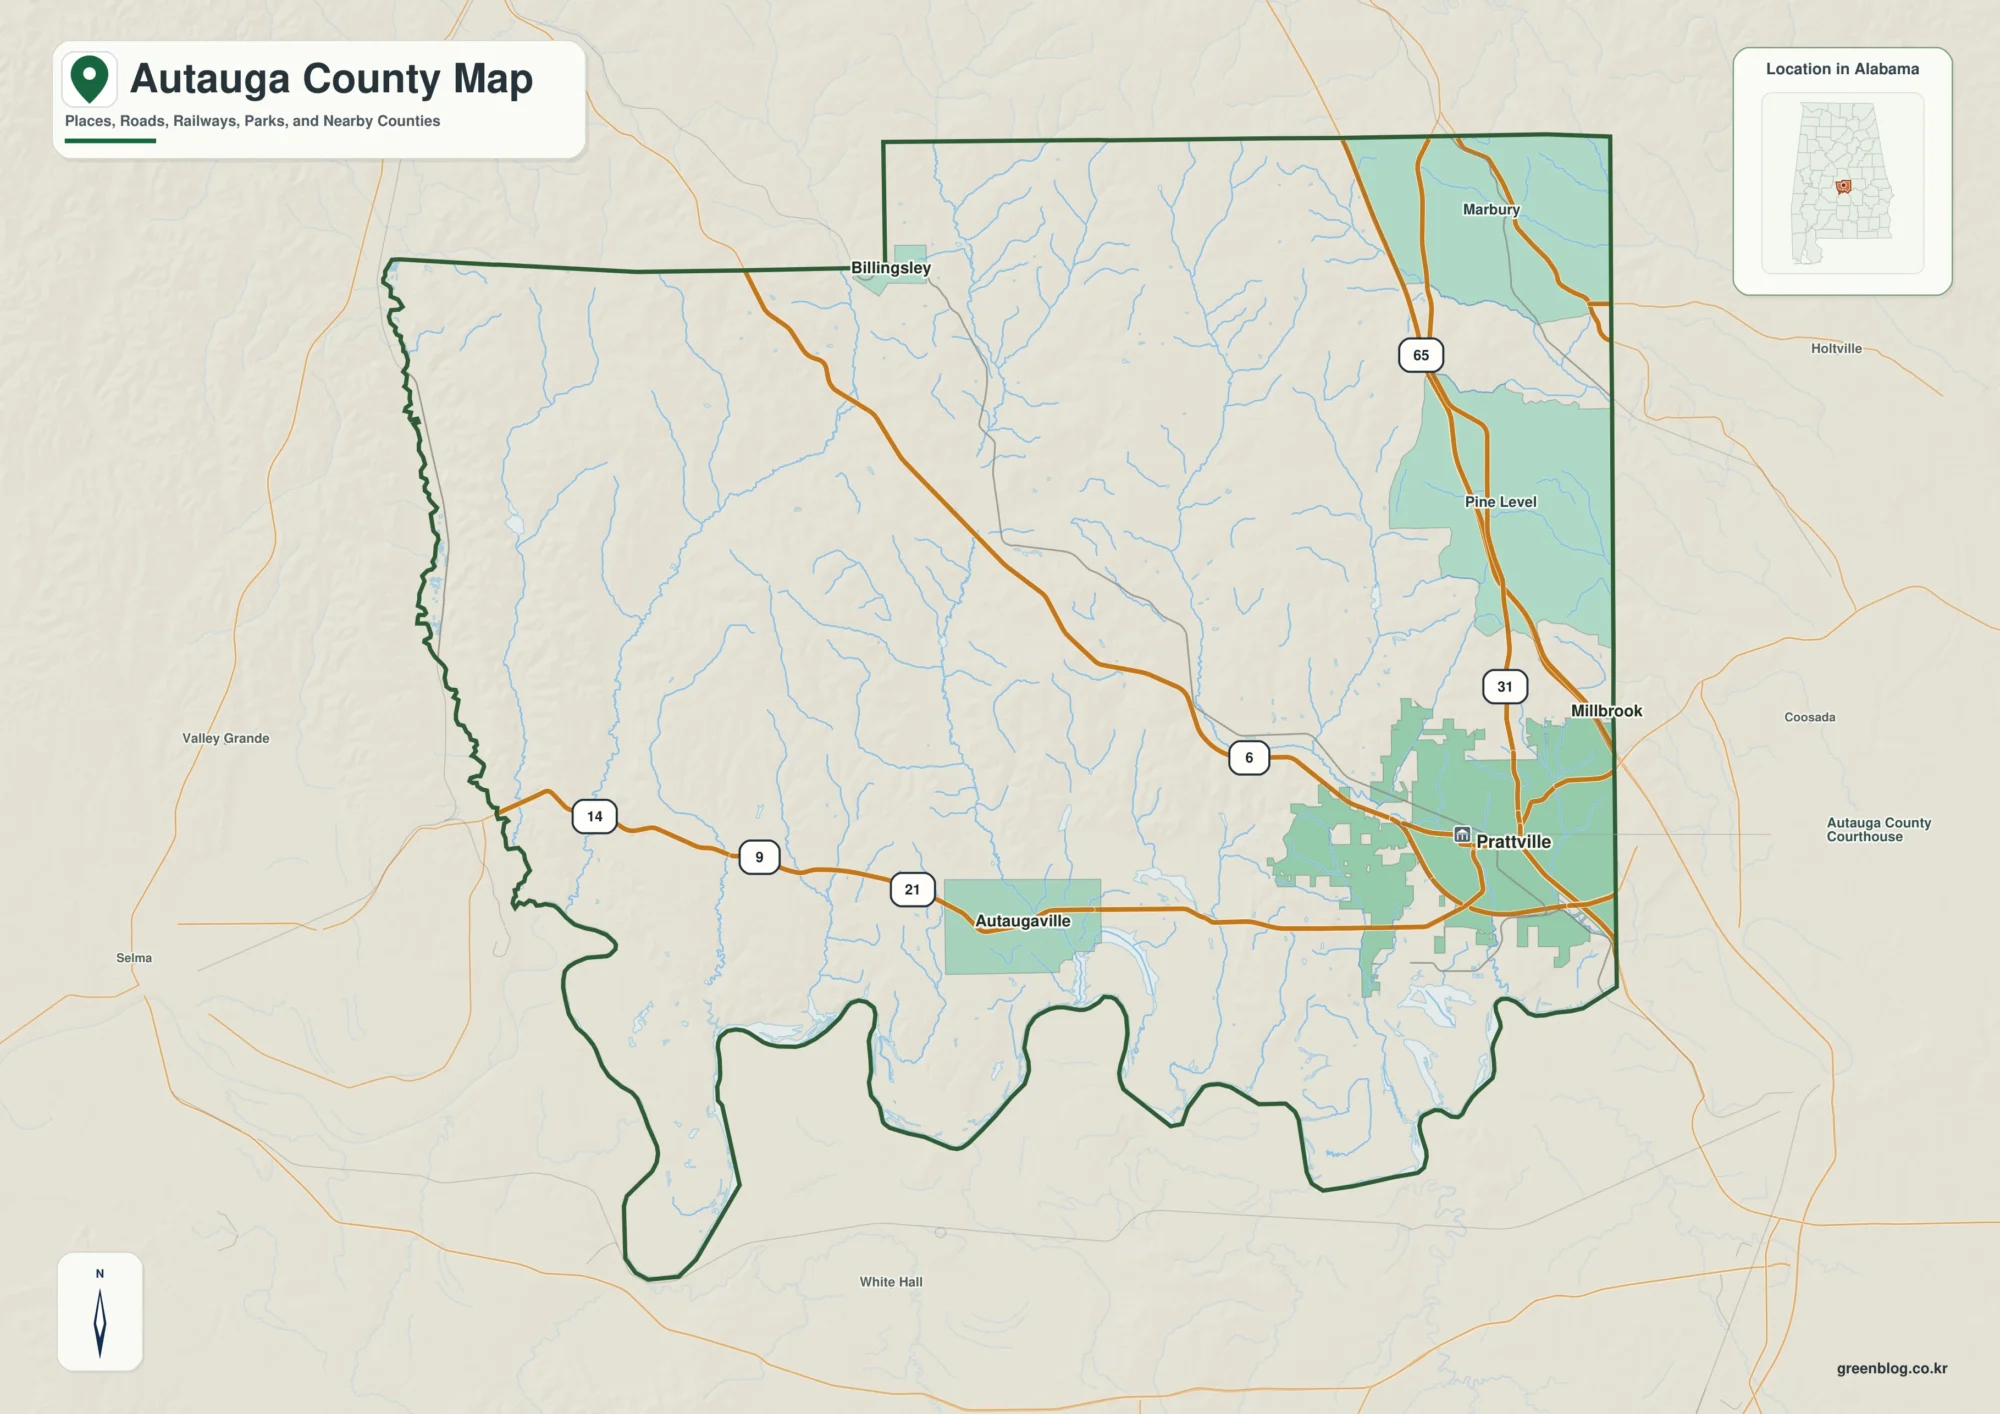
- Autauga County Alabama Land Cover Map
- Baldwin County Alabama Land Cover Map
- Barbour County Alabama Land Cover Map
Sources and Further Reading
- USGS Annual National Land Cover Database — official overview of the Annual NLCD product suite, including the release that extends land-cover mapping through 2025.
- USGS Annual NLCD Land Cover Classification — definitions for the land-cover classes used in the national product.
- Alabama Cooperative Extension: Soil Descriptions and Plant Selections for Dallas County — county-specific background on Black Belt soils, Coastal Plain soils, river terraces, and wetlands.
- Encyclopedia of Alabama: Dallas County — trusted geographic background on Selma, the Alabama River, the Cahaba River, and the county landscape.
- U.S. Census Bureau TIGER/Line Shapefiles — official county boundary and geographic-reference data.
Green Map creates custom-edited map images using open geographic data sources such as geoBoundaries, Natural Earth, OpenStreetMap, and government open data.
These maps are edited visual materials, not raw data files, and are provided for education, documents, presentations, and graphic reference.