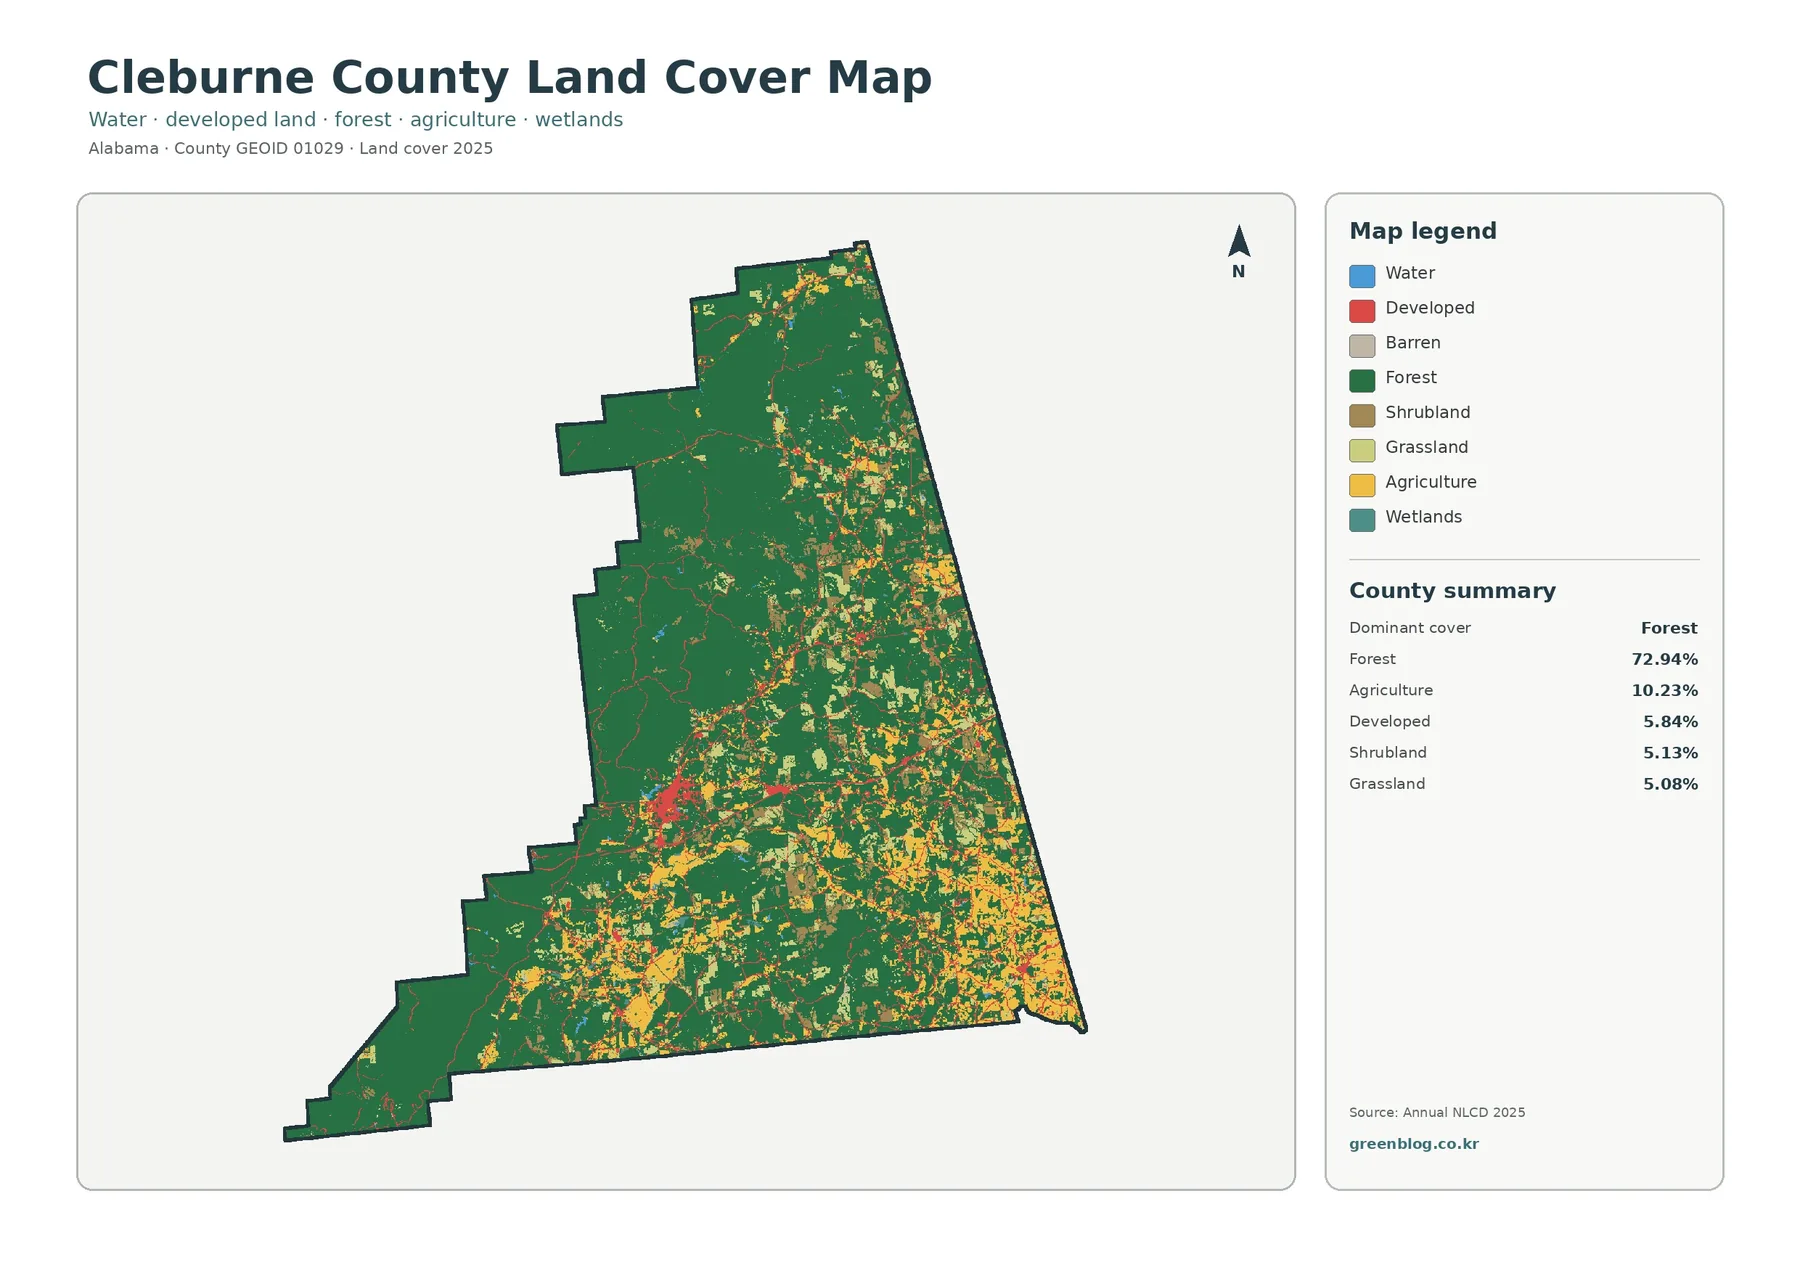
Forest is the defining feature of Cleburne County in the 2025 land-cover data. It accounts for 72.94% of the county, forming broad, nearly continuous blocks across much of the west and northwest. The eastern and southern portions are more mixed, with agriculture, grassland, shrubland, and small developed areas breaking up the forest cover. That west-to-east contrast is the clearest pattern to keep in mind while reading the four maps on this page.
The map set separates four questions: what covers the ground in 2025, where forest and farmland are concentrated, where hard impervious surfaces occur, and where the mapped class differs between 1985 and 2025. The WebP images provide quick online previews, while the four original JPG maps are packaged together in one ZIP download for reports, classroom work, presentations, and county-to-county comparisons.
Table of Contents
A forest-dominated county with a more mixed eastern side
The general land-cover map makes Cleburne County look overwhelmingly green, but the pattern is not uniform. The western half contains the largest uninterrupted forest areas, including the irregular northwestern extension of the county. Moving east and southeast, yellow agricultural cells and lighter open-cover classes become more frequent. Developed land remains a small share overall, yet it forms recognizable clusters rather than being evenly scattered. Reading the map by zones is therefore more informative than treating the countywide percentages as if every part of Cleburne looked the same.
The 2025 summary lists forest at 72.94%, agriculture at 10.23%, developed land at 5.84%, shrubland at 5.13%, and grassland at 5.08%. Open water is 0.31% and wetlands are 0.35%. The small water and wetland percentages explain why blue and teal occupy little space at the county scale. Agriculture, shrubland, and grassland are individually much smaller than forest, but together they create much of the visual texture in the east and south. Their locations matter more than a simple ranking because the open-cover classes repeatedly occur beside forest edges and near the more settled parts of the county.
Land cover should not be confused with zoning or ownership. A green forest cell means the surface was classified as forest in the source data; it does not identify a public forest boundary, a private timber tract, or a conservation easement. Likewise, agricultural color does not define a legal farm parcel, and developed color does not draw municipal limits. This distinction matters in Cleburne County because the region includes both extensive forest landscapes and areas with different ownership and management histories. The map is best used to describe the visible surface pattern, not to make a legal land-use determination.
A developed cluster stands out in the west-central part of the county, where the map shifts from broad forest to a denser mix of red, yellow, and open-cover colors. Heflin provides useful local context for this area because county administrative offices are located there. The map itself does not label streets or individual facilities, so a red line should not be assigned to a particular road without a separate reference map. What can be said confidently is that the developed footprint is concentrated in a few connected areas within a county that is otherwise heavily forested.
Forest and farmland are not distributed in the same way
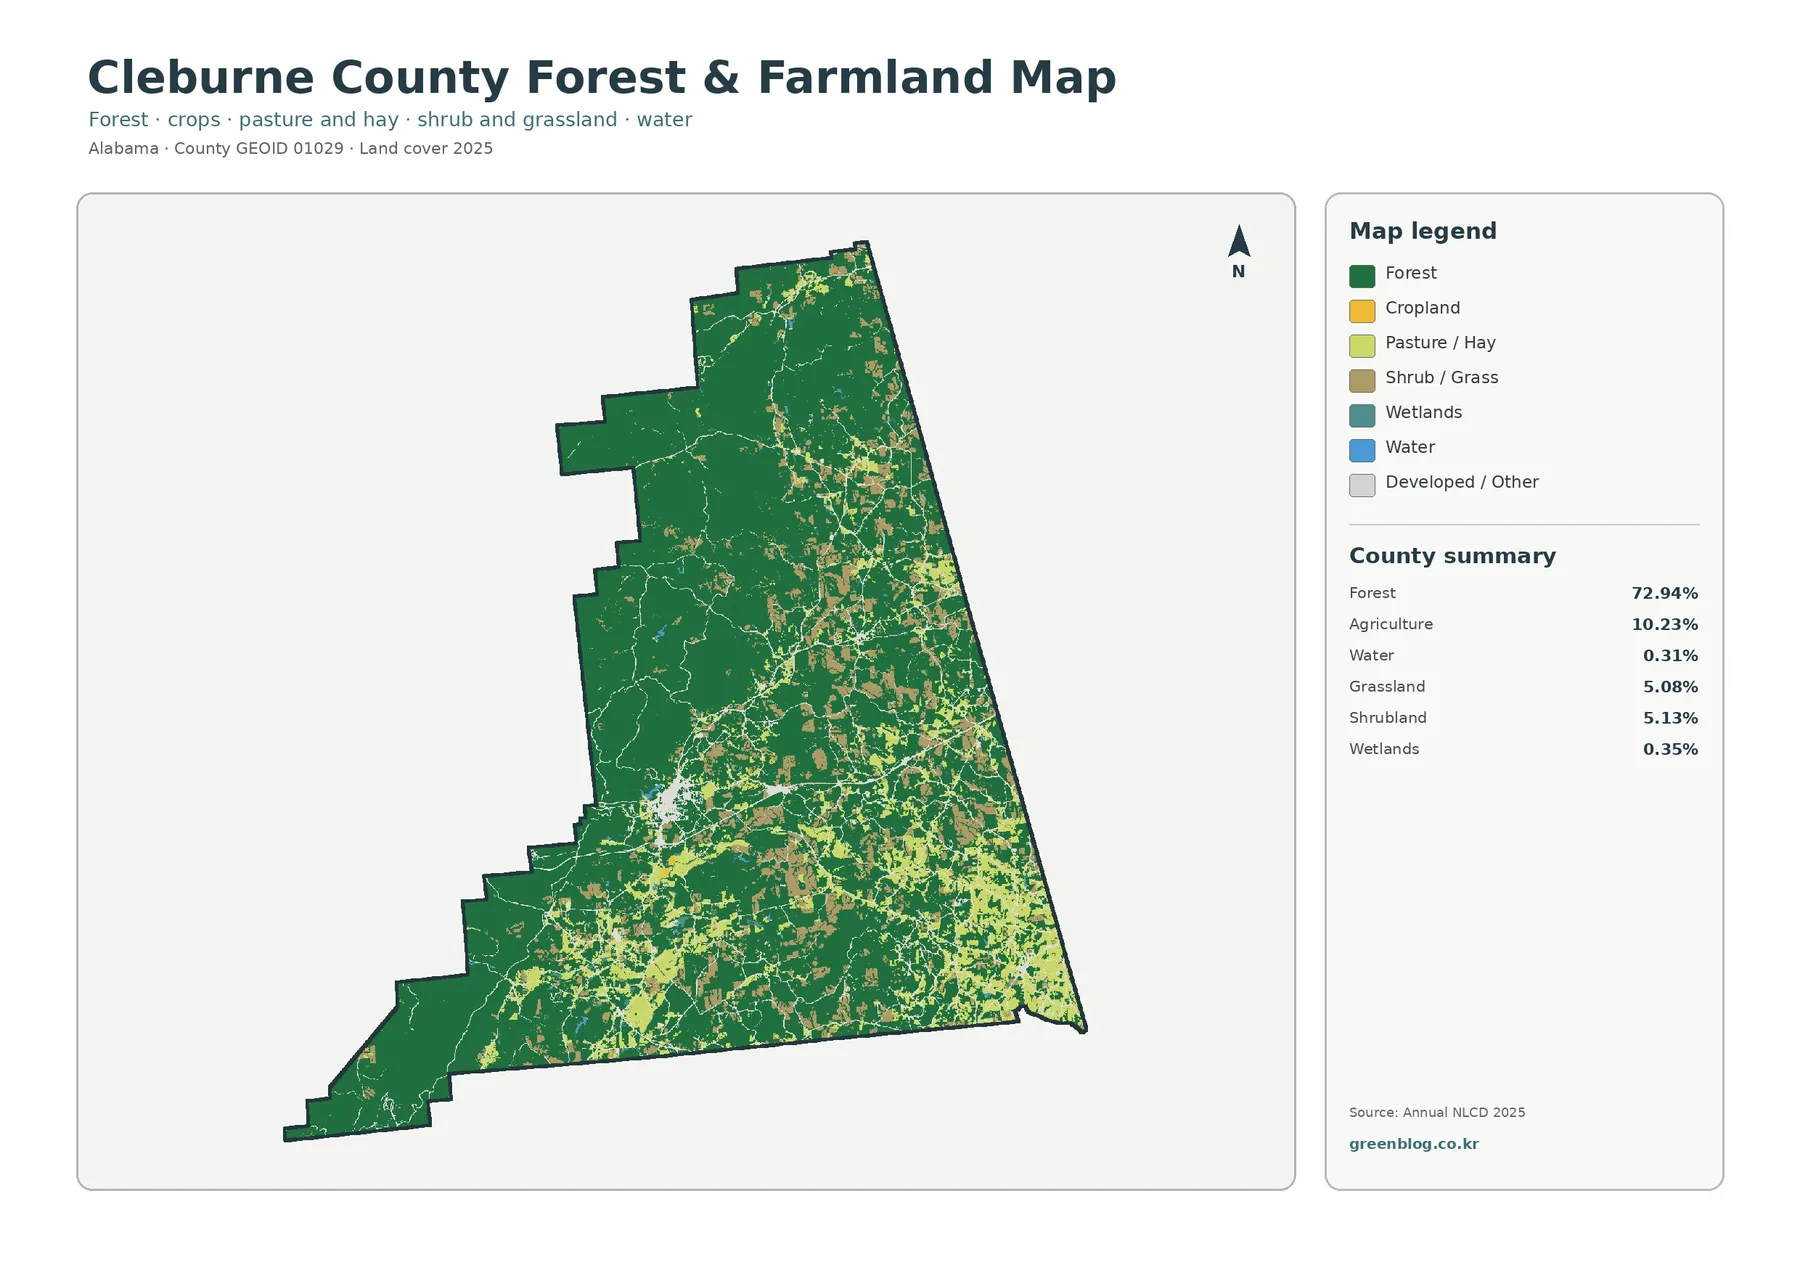
The forest-and-farmland view removes some of the complexity of the general legend and makes the county’s internal contrast easier to follow. Large forest blocks dominate the west, while crop, pasture or hay, and shrub or grass colors occur much more often in the eastern and southern parts of the county. The open areas do not form one continuous agricultural belt. Instead, they appear as patches of different sizes, often surrounded by or connected to forest. That arrangement is useful for explaining why a county with more than seventy percent forest can still contain locally important farming and open-land landscapes.
Agriculture accounts for 10.23% in the county summary. The map does not identify crop type, farm ownership, or management practice, so those questions require agricultural statistics or local records. It does show where agricultural cover is more common relative to the forest. Grassland at 5.08% and shrubland at 5.13% add another layer of open cover, especially where the landscape becomes more fragmented toward the east. Keeping these categories separate is important: a light-colored open cell is not automatically cropland, and shrub or grass cover should not be described as abandoned farmland without evidence.
Cleburne County’s western forest also has a clear regional context. Federal and state forestry sources describe the Talladega National Forest and the Cheaha area in and around Cleburne County. Those sources help explain why extensive forest is an important part of the county landscape, but the land-cover map still cannot be used as a national-forest ownership map. Forest cover extends beyond administrative forest boundaries, while public land boundaries may include more than one surface class. A reader interested in ownership, recreation management, or protected areas should compare this image with the appropriate Forest Service or state boundary data.
Water and wetlands are small in the countywide summary, at 0.31% and 0.35% respectively. Their limited area means narrow streams, small ponds, and wet margins can be difficult to see at this scale. The simplified forest-and-farmland legend helps distinguish blue water from teal wetland cells, but it still does not replace a hydrography map. A 30-meter land-cover grid can generalize narrow features, especially where water, trees, and open ground occupy the same cell. For watershed work, this map is most useful as a land-cover layer alongside more detailed stream and waterbody data.
Heflin-area hard surfaces remain a small countywide footprint
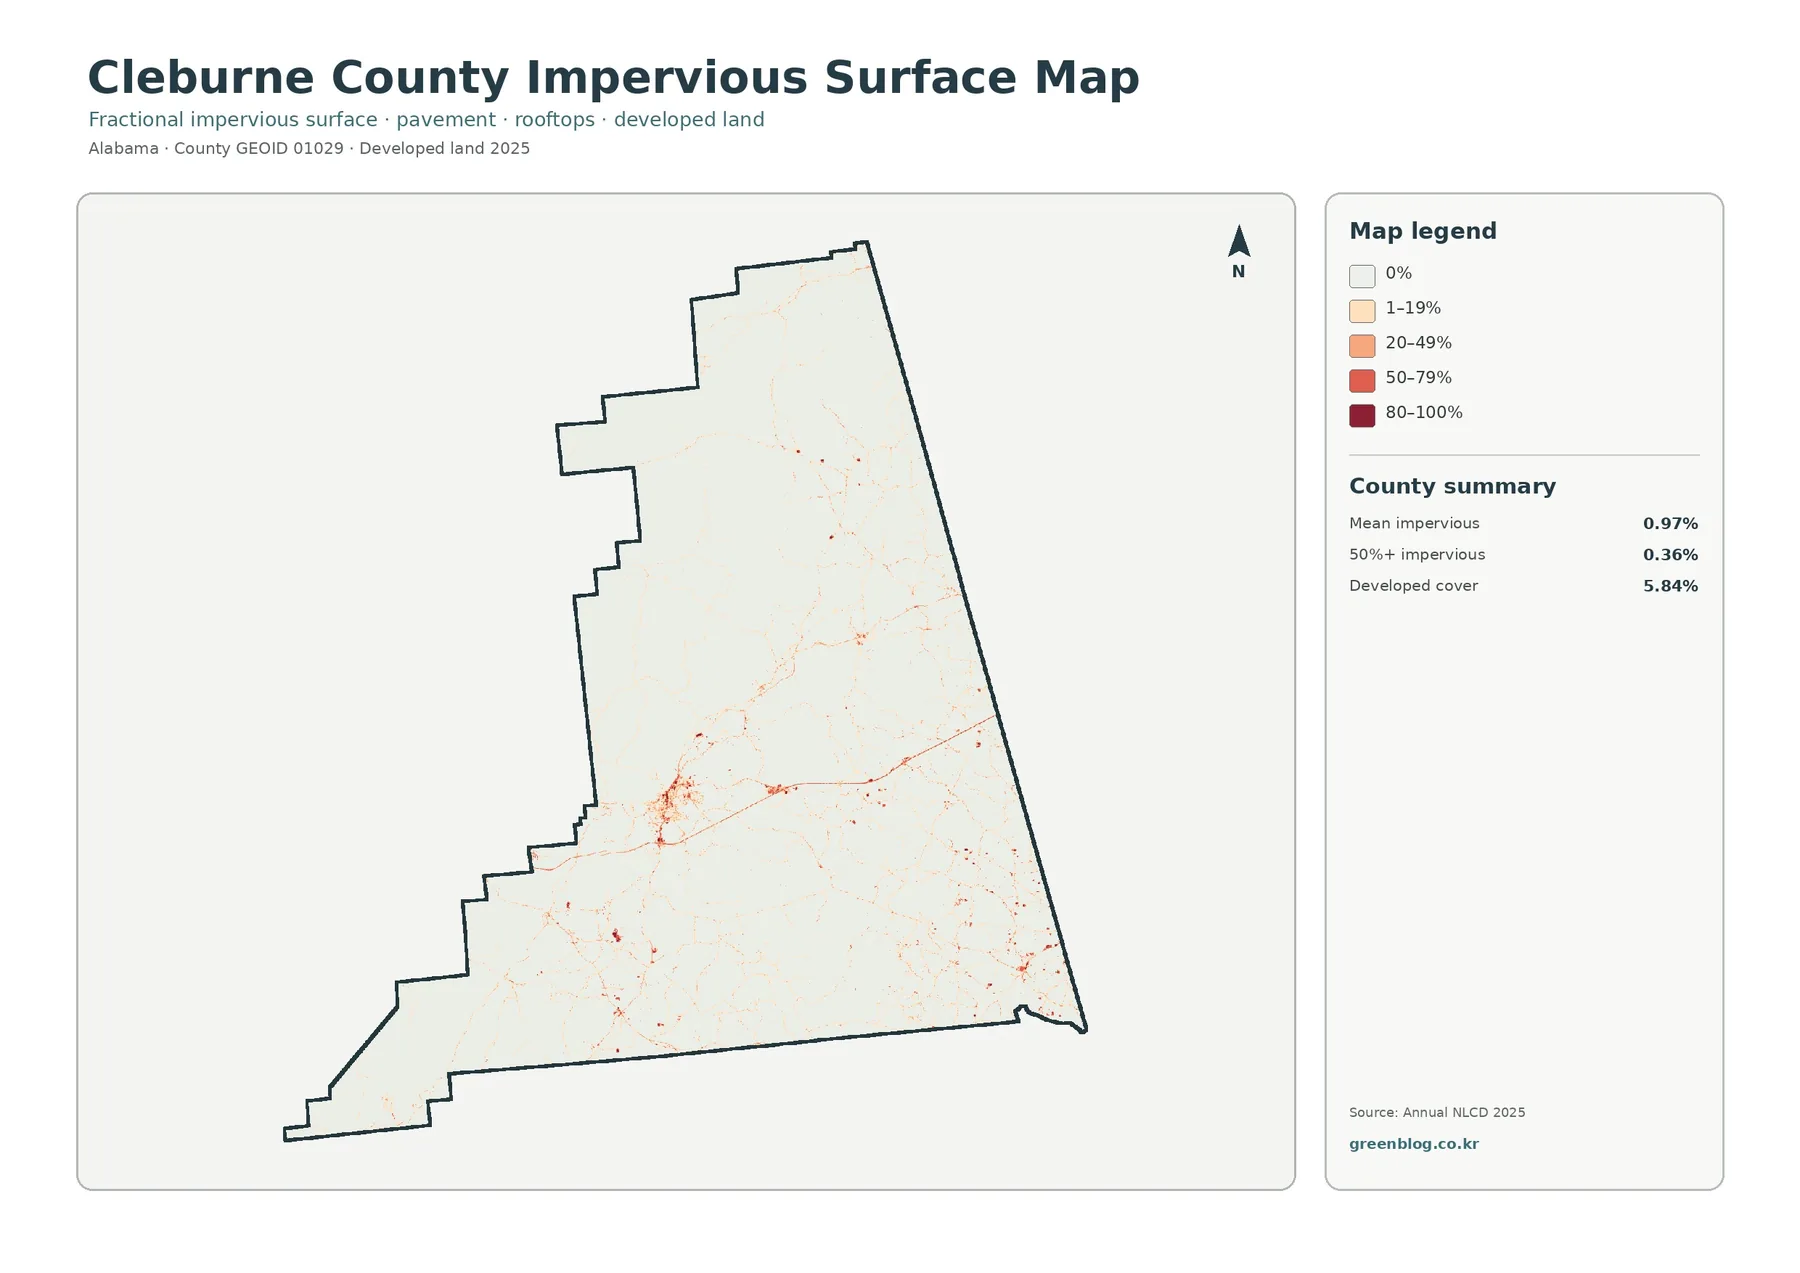
The impervious-surface map answers a different question from the developed-land class. Impervious surface refers to roofs, pavement, parking areas, and other hard surfaces that do not readily absorb rainfall. Cleburne County has a mean impervious value of 0.97%, and only 0.36% of the county is summarized as having at least 50% impervious cover. Developed land, by comparison, is 5.84% of total land cover. The gap is expected because a developed 30-meter cell can contain lawns, trees, soil, and other permeable surfaces in addition to pavement or buildings.
Most of the impervious map is very pale, which fits a county dominated by forest and rural open land. Stronger orange and red values collect in the west-central area, with thin lines extending outward and smaller concentrations elsewhere. This creates a clear visual hierarchy: a small settled core and transportation-linked traces stand out against a much larger background of low impervious cover. Countywide averages can hide that local concentration, so the map is more useful when the viewer looks for clusters and corridors rather than relying on 0.97% alone.
Heflin is a practical reference point for the west-central concentration because it is the county seat and the location of county administrative offices. Still, the preview does not name streets, neighborhoods, or individual buildings. The safest interpretation is that hard surfaces are more concentrated around the principal settled area and along connecting routes, not that every high-value pixel can be assigned to a specific feature. A road or building dataset would be needed for that level of identification.
Impervious coverage is often used in watershed and planning discussions, but this map should not be treated as a direct flood or water-quality risk map. Runoff depends on slope, soil, drainage infrastructure, rainfall, stream proximity, and other factors. In Cleburne County, the impervious map is especially useful for contrasting the heavily forested west with the small pockets where pavement and roofs are more common. It can identify places that deserve a closer look, but it does not provide the rest of the information needed to calculate hazard or environmental impact.
The 1985–2025 map measures class differences, not one single kind of change
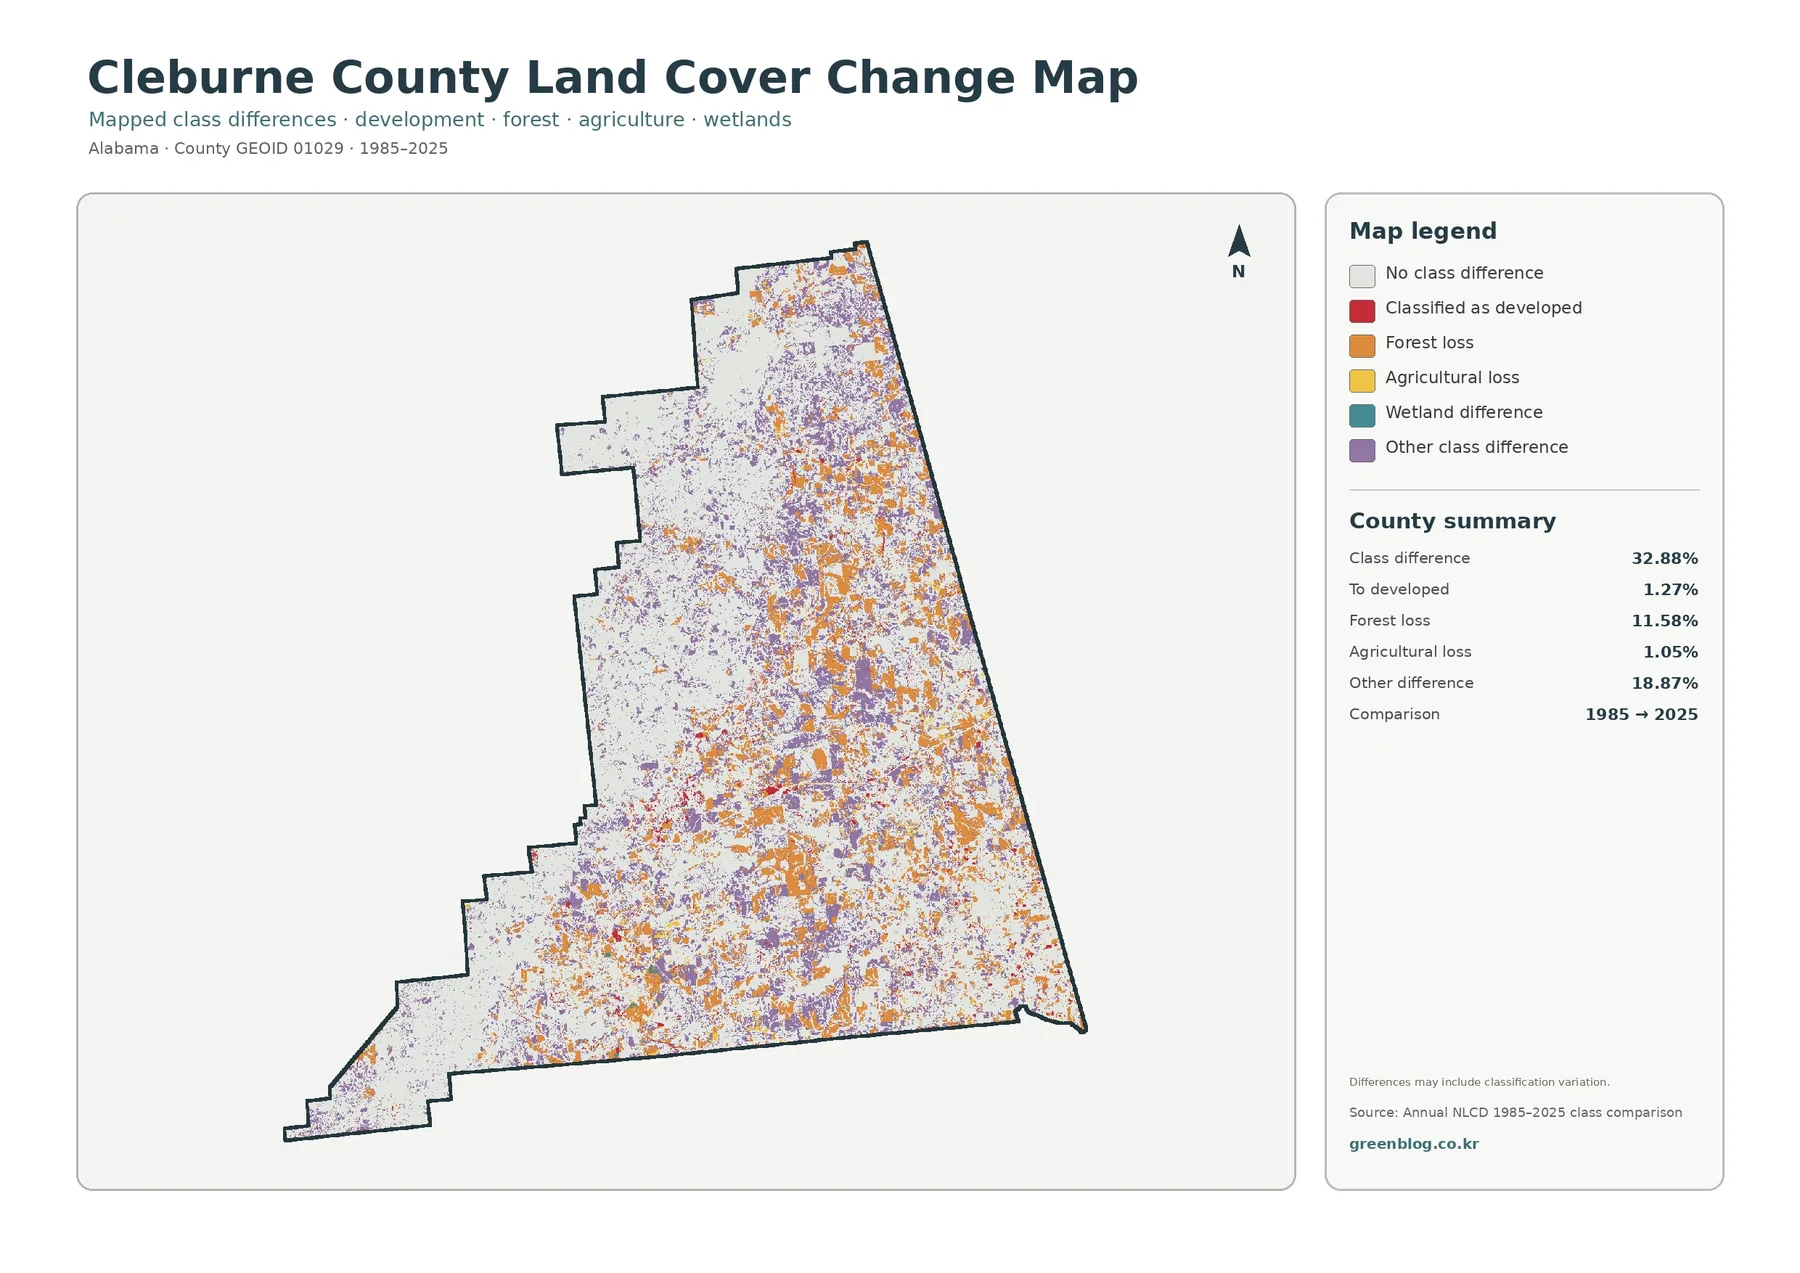
The change map reports a 32.88% class difference between the 1985 and 2025 classifications. That total contains several categories: 1.27% classified as developed, 11.58% forest loss, 1.05% agricultural loss, and 18.87% other class difference, with wetland differences also represented in the legend. These values immediately show why the total should not be described as a development rate. Only a small part of the countywide difference is assigned to the “to developed” category, while other land-cover transitions make up most of the mapped change.
Orange forest-loss and purple other-difference cells are scattered across much of the county, with many visible patches in the eastern and southern portions. The large western forest is not completely unchanged, but it also contains broad areas with no class difference. Red developed-change cells are more limited and tend to appear near the same settled locations that stand out on the impervious map. Comparing the two images is helpful because it separates the present-day footprint of hard surfaces from the much broader set of class changes recorded over the comparison period.
The forest-loss category needs careful wording. A cell that differs from forest in the two endpoint years is not, by itself, proof of permanent forest conversion. Timber harvest and regrowth, vegetation stage, agricultural use, classification differences, or other land-cover transitions may be involved. The map does not establish the cause or exact year of a change. For a site-specific question, intermediate Annual NLCD years, aerial imagery, forestry records, and field information are better suited to determining what actually happened between 1985 and 2025.
The map also notes that differences may include classification variation. A raster classification generalizes the landscape into cells, and mixed pixels near forest edges or narrow features can switch classes when imagery or vegetation conditions differ. This is particularly relevant in parts of Cleburne County where forest, pasture, shrubland, and agriculture form small adjoining patches. The change layer is a screening and comparison tool: it highlights where the two classifications differ, but it is not a parcel history or a permit record.
Cheaha and Talladega National Forest add useful context, but not ownership boundaries
Cleburne County’s forest percentage is unusually prominent in the map set, so local geography helps put that number in context. The U.S. Forest Service identifies Talladega National Forest as one of Alabama’s national forests, and Alabama forestry sources describe the forested ridge and Cheaha area associated with Cleburne County. The county is also home to Alabama’s highest-point landscape around Cheaha. Those facts are useful background for understanding why large forest blocks occur in western Cleburne, especially when the land-cover image is viewed alongside a regional physical map.
The distinction between context and map evidence is important. The WebP preview does not draw the boundary of Talladega National Forest or Cheaha State Park, and it does not label individual public parcels. A reader should therefore avoid tracing the national forest directly from the green land-cover cells. The correct use is to say that Cleburne County contains substantial public-forest and mountain context and that the 2025 classification independently shows extensive forest cover. A separate ownership or protected-area layer is required to measure overlap.
This separation also makes the map more flexible. A classroom project can use the land-cover layer to discuss forest extent and then add a Forest Service map to examine management boundaries. A planning or environmental presentation can compare the broad forest blocks with the developed and impervious maps without implying that forest cover has a single owner or legal status. Keeping the datasets in their proper roles prevents a visually simple map from being asked to answer questions it was not designed to answer.
Use the four maps as a sequence rather than four unrelated images
A good comparison begins with one location and follows it through all four views. The west-central developed cluster and the broad western forest are easy reference areas. Start with the general 2025 map to identify the current class. Move to the forest-and-farmland view to simplify the contrast between wooded and open cover. Then check the impervious map to see whether developed land in the same area also contains a strong concentration of hard surfaces. Finish with the change layer to ask whether the 1985 and 2025 classes are the same. Each map narrows the question instead of repeating the same information.
The same method works in the eastern part of the county, where agriculture, grassland, shrubland, and forest are more interwoven. A yellow agricultural patch on the general map may sit beside green forest and lighter open-cover cells. The impervious map may remain nearly blank there, which helps distinguish agricultural or rural open land from built surfaces. The change map may show a class difference even where impervious coverage is low. That combination demonstrates why “changed land” and “developed land” are not interchangeable terms.
For county comparisons, match year and metric. Cleburne County’s 72.94% forest share should be compared with forest percentages from the same 2025 classification. The 0.97% mean impervious value should be compared with the same impervious product, and the 32.88% class-difference value is most meaningful against maps using the same 1985–2025 endpoints. Mixing years or classification systems can create apparent differences that come from data design rather than from the landscape itself.
Presentation order can also make the set easier to understand. Use the general land-cover map to introduce the county, the forest-and-farmland map when discussing open land and woodland, the impervious view when the topic shifts to settlement and hard surfaces, and the change map only after the audience understands the current landscape. Because all four use the same county shape, the viewer can keep the same mental reference points while the theme changes.
Download the original JPG set and choose the right map for the job
The downloadable ZIP contains four original 2480×1754 JPG files: the 2025 general land-cover map, the forest-and-farmland map, the impervious-surface and developed-land map, and the 1985–2025 class-difference map. The article uses 1800-pixel-wide WebP previews for faster browsing. The larger JPG files are the better choice for documents, slide decks, classroom handouts, and side-by-side county comparisons where the legend needs to remain readable.
The asset manifest does not mark these JPG files as meeting an A3 high-resolution reference. That does not prevent ordinary printing, but it is worth checking a small proof before producing a large poster. Enlarging the JPG also does not improve the underlying land-cover detail. The source classification remains a generalized raster, so image size and geospatial resolution should not be confused. A larger printed map can make the legend easier to see without turning a 30-meter classification into parcel-level data.
Keep the map year and theme in captions or filenames when the images leave this page. “Cleburne County map” is too vague once the files are separated. A label such as “2025 land cover,” “impervious surface,” or “1985–2025 class comparison” prevents the 72.94% current forest share from being confused with the 32.88% endpoint class-difference figure. Clear naming is especially helpful when several Alabama counties are being assembled into one report or presentation.
Scale, mixed pixels, and other limits to keep in view
Annual NLCD land cover is raster data, meaning the landscape is represented by a grid of cells rather than by surveyed parcel polygons. The official classification uses 30-meter spatial resolution. A single cell can contain trees, lawn, pavement, a small structure, or the edge of a water feature, yet the classification assigns a representative value. Zooming into the image only enlarges the cell on screen; it does not reveal a smaller original unit. This is why the maps are appropriate for county-scale pattern recognition but not for locating a property line or a small building.
Legal land use is another separate question. Forest cover does not identify ownership or timber rights. Agricultural cover does not confirm zoning, tax status, or a farm boundary. Developed cover does not draw a city limit, and impervious percentage does not establish a drainage problem by itself. Anyone making a property, permitting, conservation, or infrastructure decision should use current county and state records alongside the land-cover image. The map is a visual reference layer, not an administrative ruling.
Date limitations matter as well. A 2025 map cannot show development or vegetation changes that occurred after the observation and processing period. The endpoint comparison cannot reveal every intermediate transition. A forest cell could change to another class and later return to forest while the endpoint map records no difference, or it could differ at the endpoints without explaining when the transition occurred. Long-term investigation should use the annual sequence, aerial photographs, and local records rather than relying on two endpoint years alone.
Used with those limits in mind, the four-map set provides a clear county-scale summary. It shows the exceptional dominance of forest in Cleburne County, the more open and agricultural texture of the east and south, the small but visible Heflin-area hard-surface footprint, and the places where the 1985 and 2025 classes differ. That makes the set a useful starting point for research, teaching, comparison, and visual planning before more detailed datasets are added.
Frequently Asked Questions
What is the dominant 2025 land-cover class in Cleburne County?
Forest is dominant at 72.94%. Agriculture is 10.23%, developed land 5.84%, shrubland 5.13%, and grassland 5.08%, while open water and wetlands account for 0.31% and 0.35%. The western part of the county contains the largest forest blocks, with a more mixed pattern toward the east and south.
Does the green forest area show the boundary of Talladega National Forest?
No. Talladega National Forest and the Cheaha area are important regional context for Cleburne County, but the land-cover image classifies the surface rather than ownership. Public forest boundaries, private land, state park land, and other property types require separate administrative or ownership layers.
Why is developed land 5.84% while mean impervious cover is only 0.97%?
A developed land-cover cell can include lawns, trees, soil, and other permeable surfaces along with roads or buildings. Impervious percentage measures the hard portion more directly. Cleburne County also has only 0.36% of its area summarized at 50% or greater impervious cover, so the strongest hard-surface concentrations are limited in extent.
Does the 32.88% class difference mean that one-third of the county was developed?
No. The “to developed” component is 1.27%. The total also includes 11.58% forest loss, 1.05% agricultural loss, 18.87% other class difference, and wetland differences. It is a two-date classification comparison, not a single development statistic.
What files are included in the download?
The ZIP contains four original 2480×1754 JPG maps covering 2025 general land cover, forest and farmland, impervious surface and developed land, and 1985–2025 class differences. The page uses smaller WebP versions as previews.
Map File Information
Cleburne County Land Cover Maps 2025 land cover, forest & farmland, impervious/developed land, and 1985–2025 class-difference maps in four original JPG files
- Included Files: Use only the versions confirmed in the article and supplied images
- File Type: Use the confirmed download contents
- Intended Use: Printing, education, presentations, and map-based projects
Related Maps
- Autauga County Alabama Land Cover Map
- Baldwin County Alabama Land Cover Map
- Barbour County Alabama Land Cover Map
Sources and reference links
- MRLC Annual NLCD Data – Official access point for Annual NLCD land-cover and related data products.
- USGS Annual NLCD Land Cover Classification – USGS guidance on the land-cover classes and the 30-meter classification product.
- U.S. Census Bureau TIGER/Line Shapefiles – Federal geographic boundary data used for county-level reference.
- National Forests in Alabama – U.S. Forest Service – Official Forest Service information for Alabama national forests, including Talladega National Forest.
- Cleburne County, Alabama – Official county information, including administrative services in Heflin.
- Alabama Forestry Commission – State forestry context for Cleburne County, the Talladega National Forest ridge, and the Cheaha area.
Green Map creates custom-edited map images using open geographic data sources such as geoBoundaries, Natural Earth, OpenStreetMap, and government open data.
These maps are edited visual materials, not raw data files, and are provided for education, documents, presentations, and graphic reference.