Rensselaer County sits on New York’s eastern side, with a striking contrast between the Hudson River side of the county and the heavily wooded interior and eastern uplands. The 2025 map summary is led by forest at 59.47 percent. Agriculture accounts for 17.84 percent, developed land 13.47 percent, wetlands 6.24 percent, and water 1.75 percent. Rather than forming one uniform landscape, those classes create a west-to-east shift from more settled and farmed areas toward broad forest cover.
This page brings together four views of that pattern: current land cover, forest and farmland, impervious surface with developed land, and mapped class differences from 1985 to 2025. The four original JPG maps are also available in one ZIP download for printing, classroom work, presentations, and side-by-side reference. Land cover describes what is physically covering the ground in the classified imagery; it does not establish zoning, ownership, parcel boundaries, or what a property may legally be used for.
Table of Contents
A county stretching from the Hudson edge to forested uplands
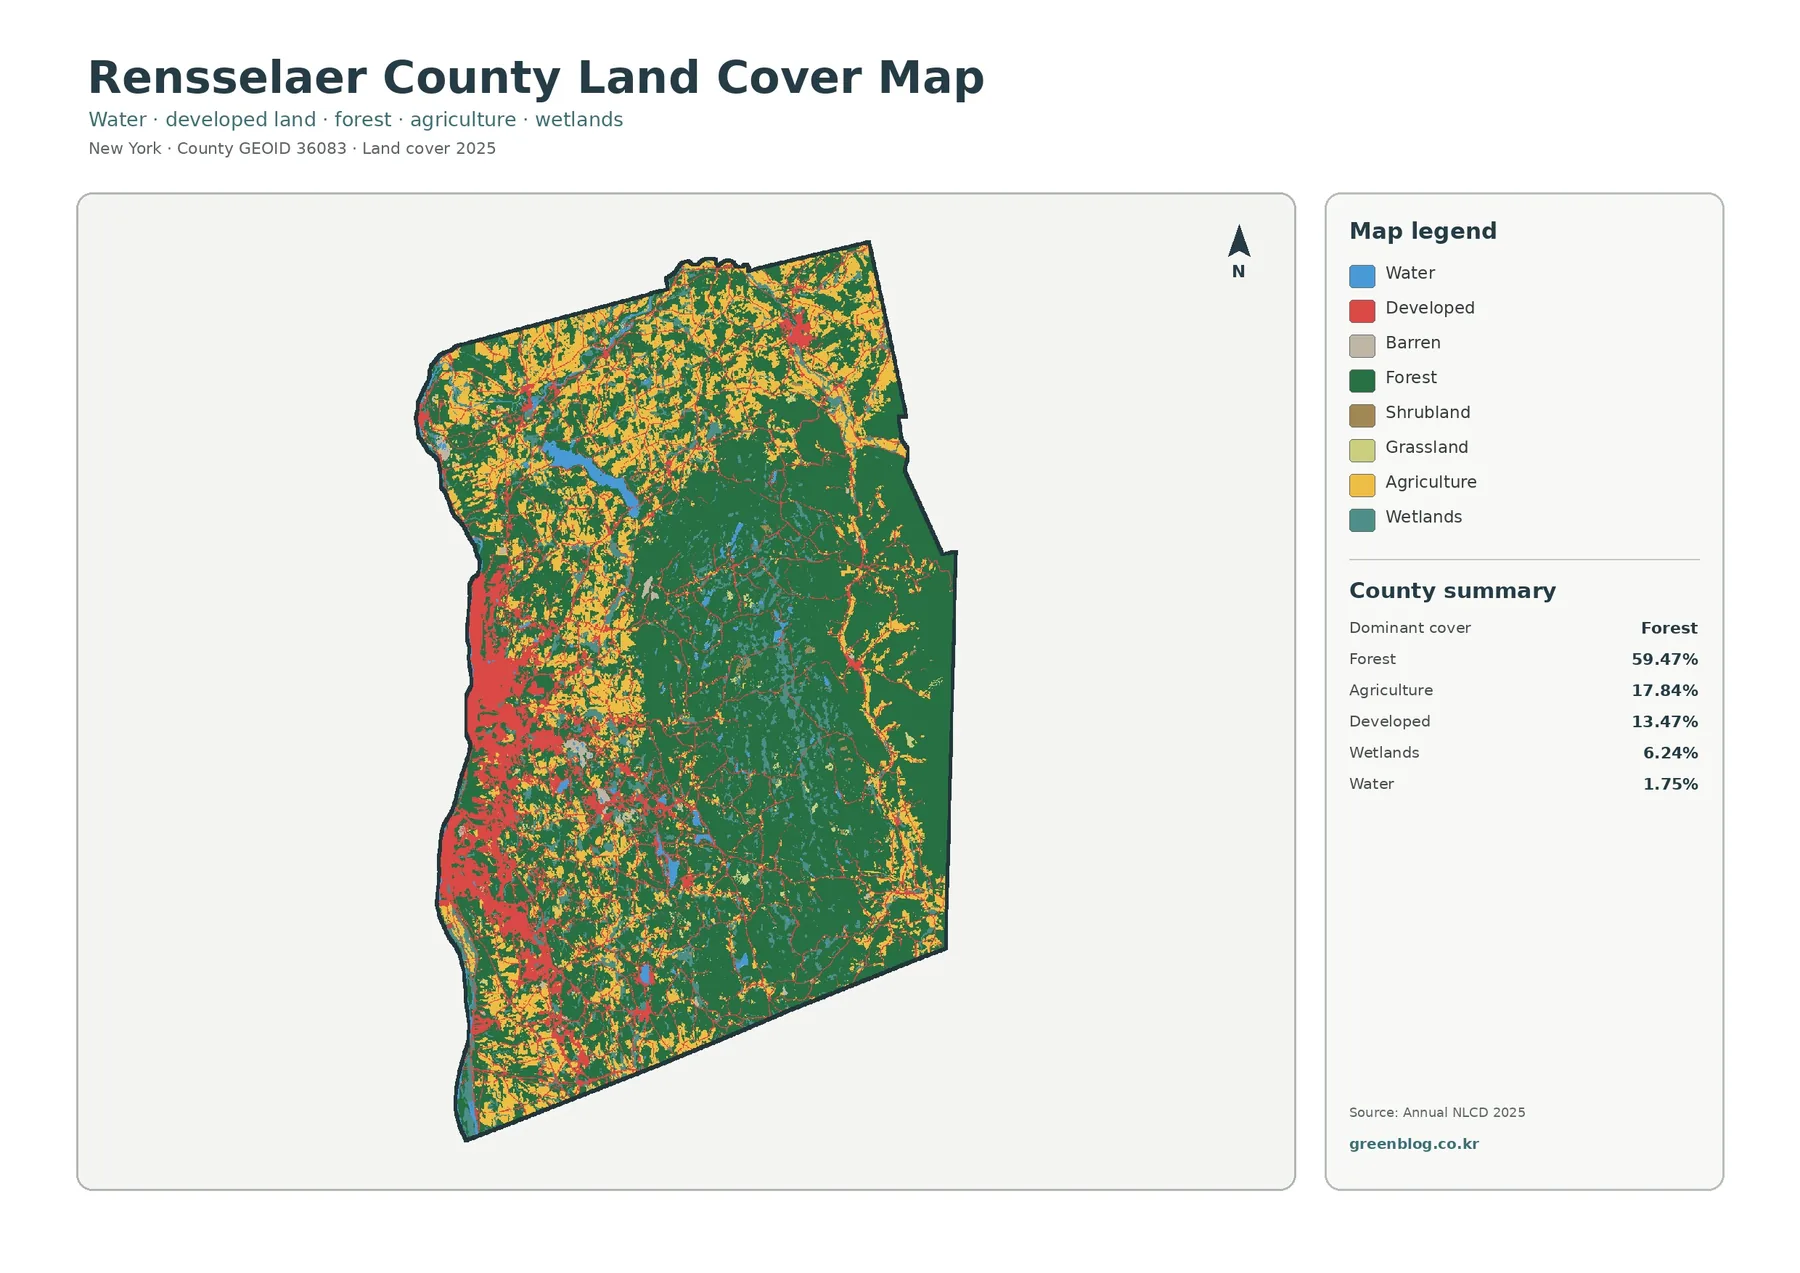
The broad land-cover view makes forest the visual anchor of the county. Large green areas occupy much of the center, east, and southeast, while the western side contains more developed land and agriculture. The northern part of the county is more mixed, with fields, woods, wet areas, and smaller developed patches appearing close together. That mixture is important because the county is not simply an extension of the Albany-Troy urban area, nor is it uniformly rural.
County geography helps explain why the map changes so much across a relatively short distance. Rensselaer County’s own planning and hazard-mitigation material describes the Hudson River on the western border, the Taconic Mountains to the east, and a landscape of rolling hills, valleys, forests, and waterways in between. Troy and the city of Rensselaer lie along the western side, while the interior includes more wooded uplands and rural communities. Those named features provide useful geographic context for the land-cover pattern visible in the image.
Forest and farmland reveal the rural pattern more clearly
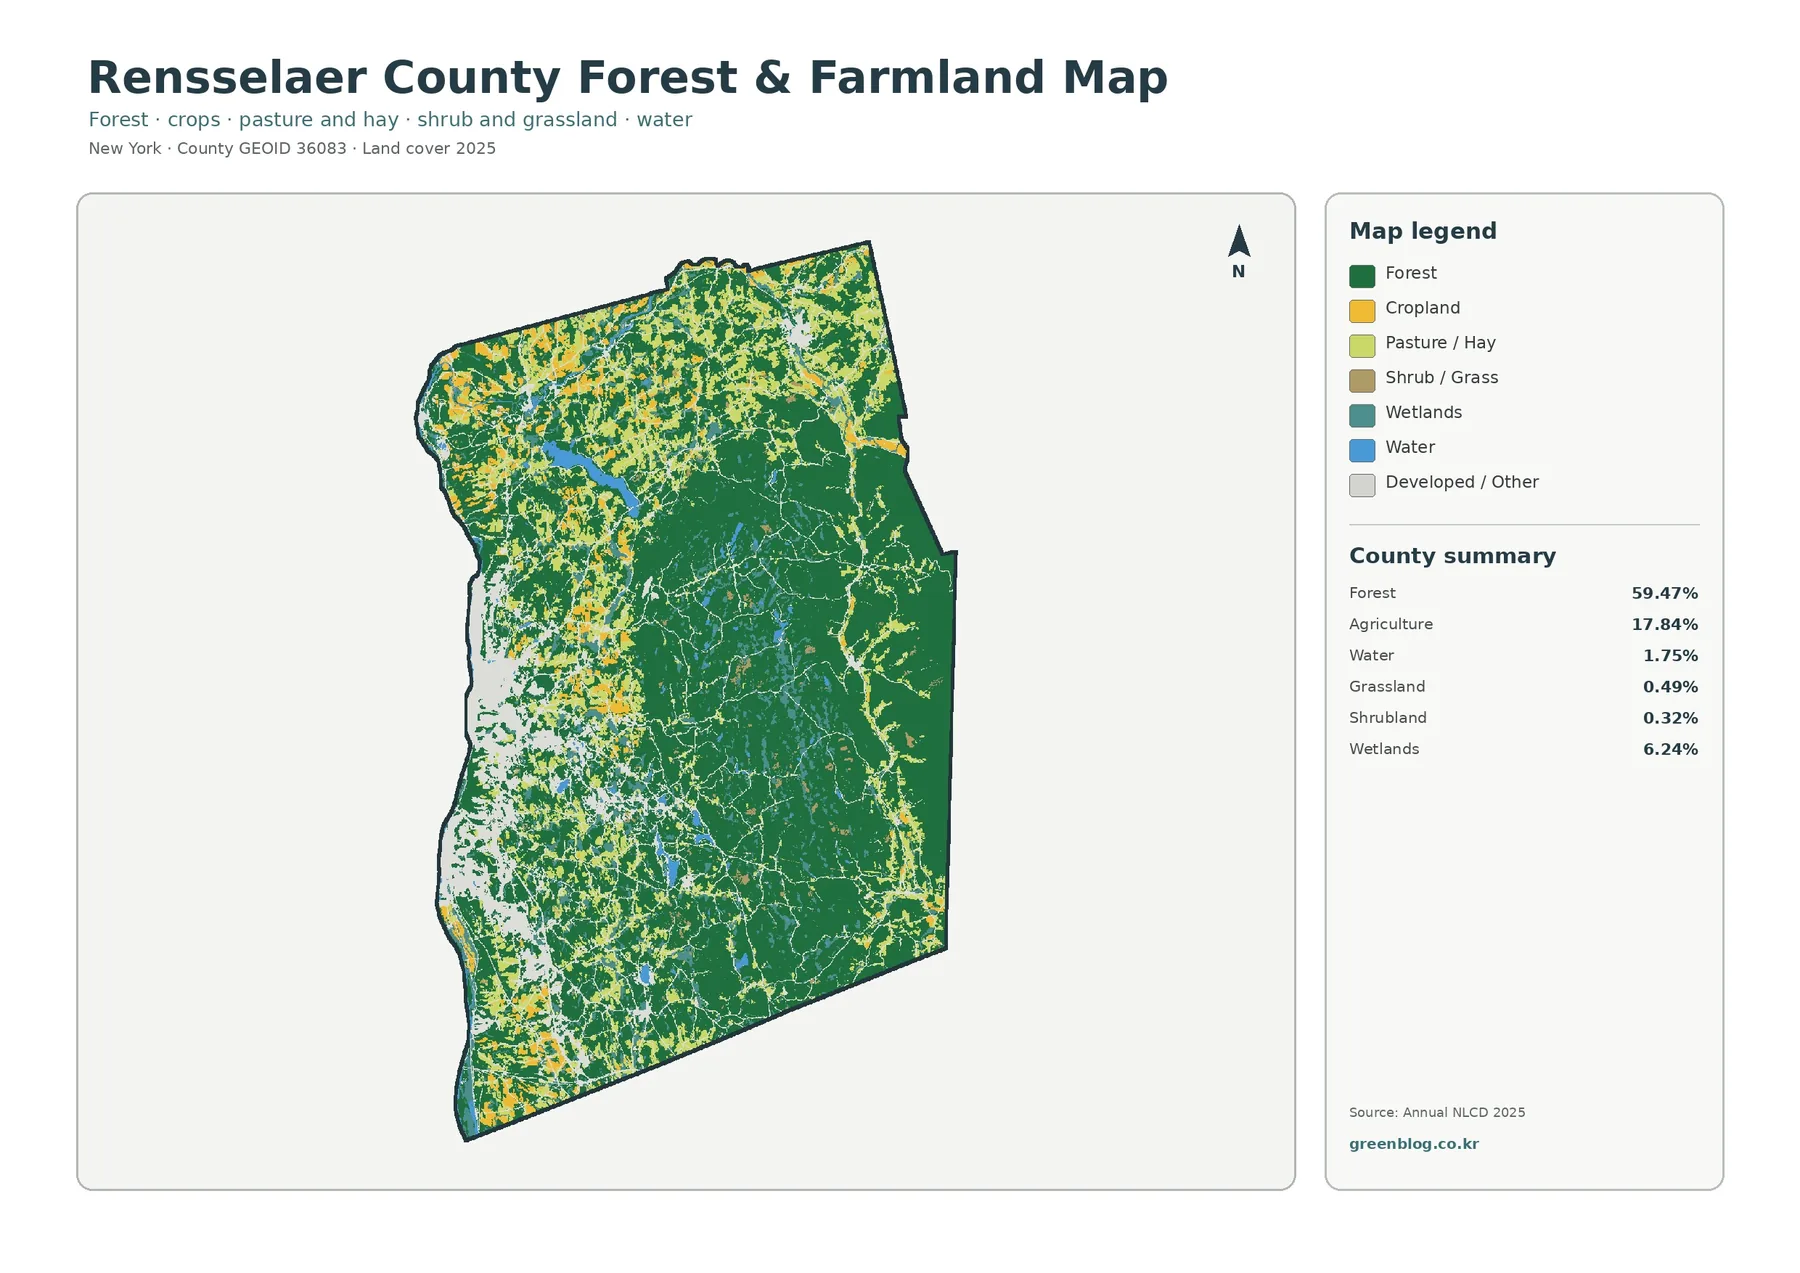
Removing most of the developed detail makes the relationship between woods and agriculture easier to follow. Forest remains the dominant class at 59.47 percent and forms the largest connected areas through the center and east. Agricultural cover is more common toward the west and northwest, with additional fields scattered through the north and south. Instead of one broad farm plain, the map shows farmland broken into groups by wooded slopes, wetlands, water, and settled areas.
The county summary also lists grassland at 0.49 percent and shrubland at 0.32 percent. These are small shares, but they matter when interpreting transitions around fields and forest edges. A pale open area between two wooded blocks should not automatically be treated as active cropland, and a green area should not be assumed to have a particular owner or conservation status. The map classifies surface cover from imagery; agricultural districts, easements, and protected lands require separate administrative data.
Impervious surfaces concentrate on the western side
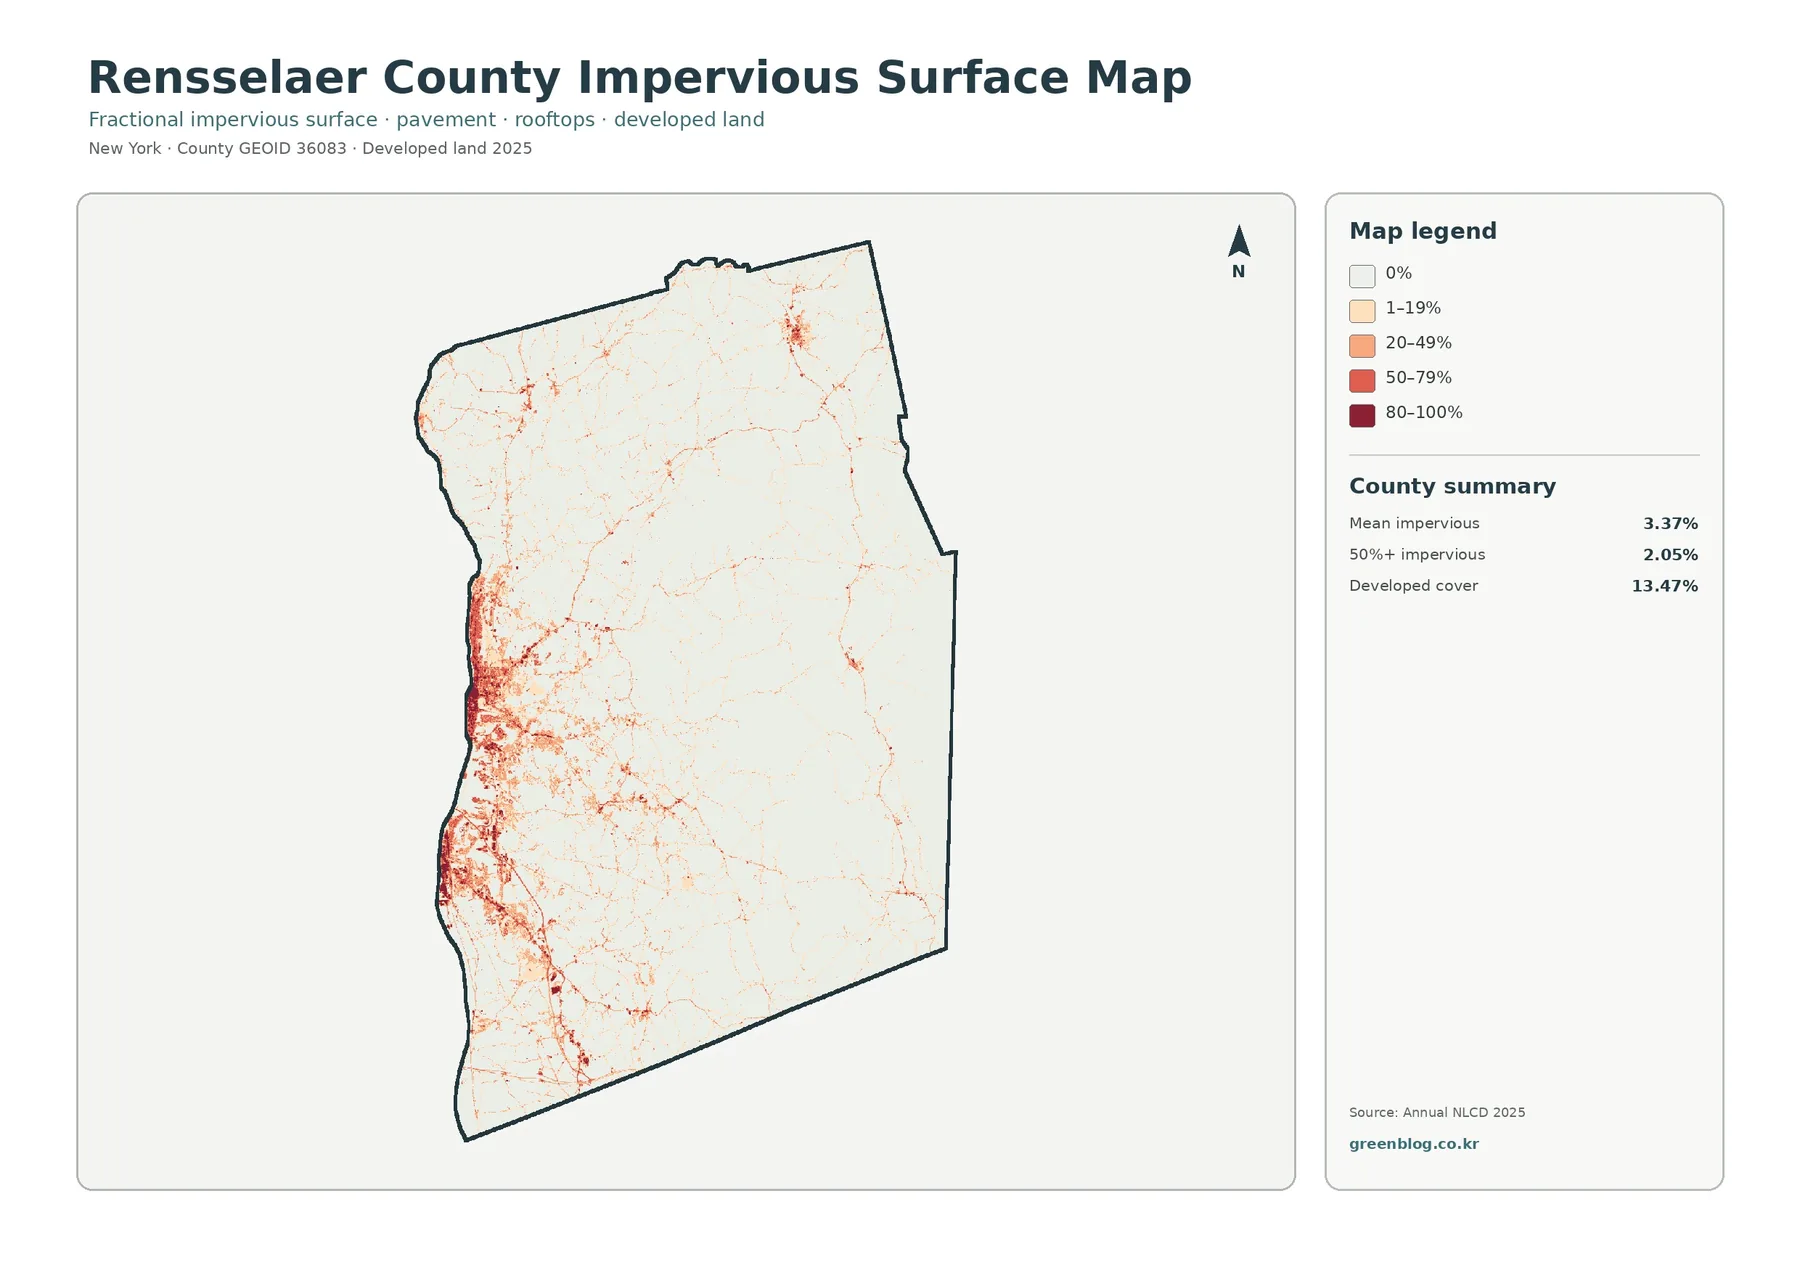
Impervious surface means pavement, rooftops, and other hard surfaces that rain cannot readily soak through. Rensselaer County’s mapped mean is 3.37 percent, while 2.05 percent of the county falls in cells that are at least 50 percent impervious. Those numbers are lower than the 13.47 percent developed-land share because a developed land-cover class can still contain lawns, trees, soil, and other permeable ground around buildings and roads.
The strongest impervious values form a clear western concentration. Dense red and orange areas appear along the Hudson-side settlement corridor, with especially noticeable clusters in the west-central and southwestern portions of the county. Smaller high-value patches appear elsewhere, but they become much more isolated toward the interior and east. This contrast is one of the clearest differences among the four maps because it separates compact paved surfaces from the much larger area classified as forest, farmland, or lightly developed land.
What changed between the 1985 and 2025 classifications
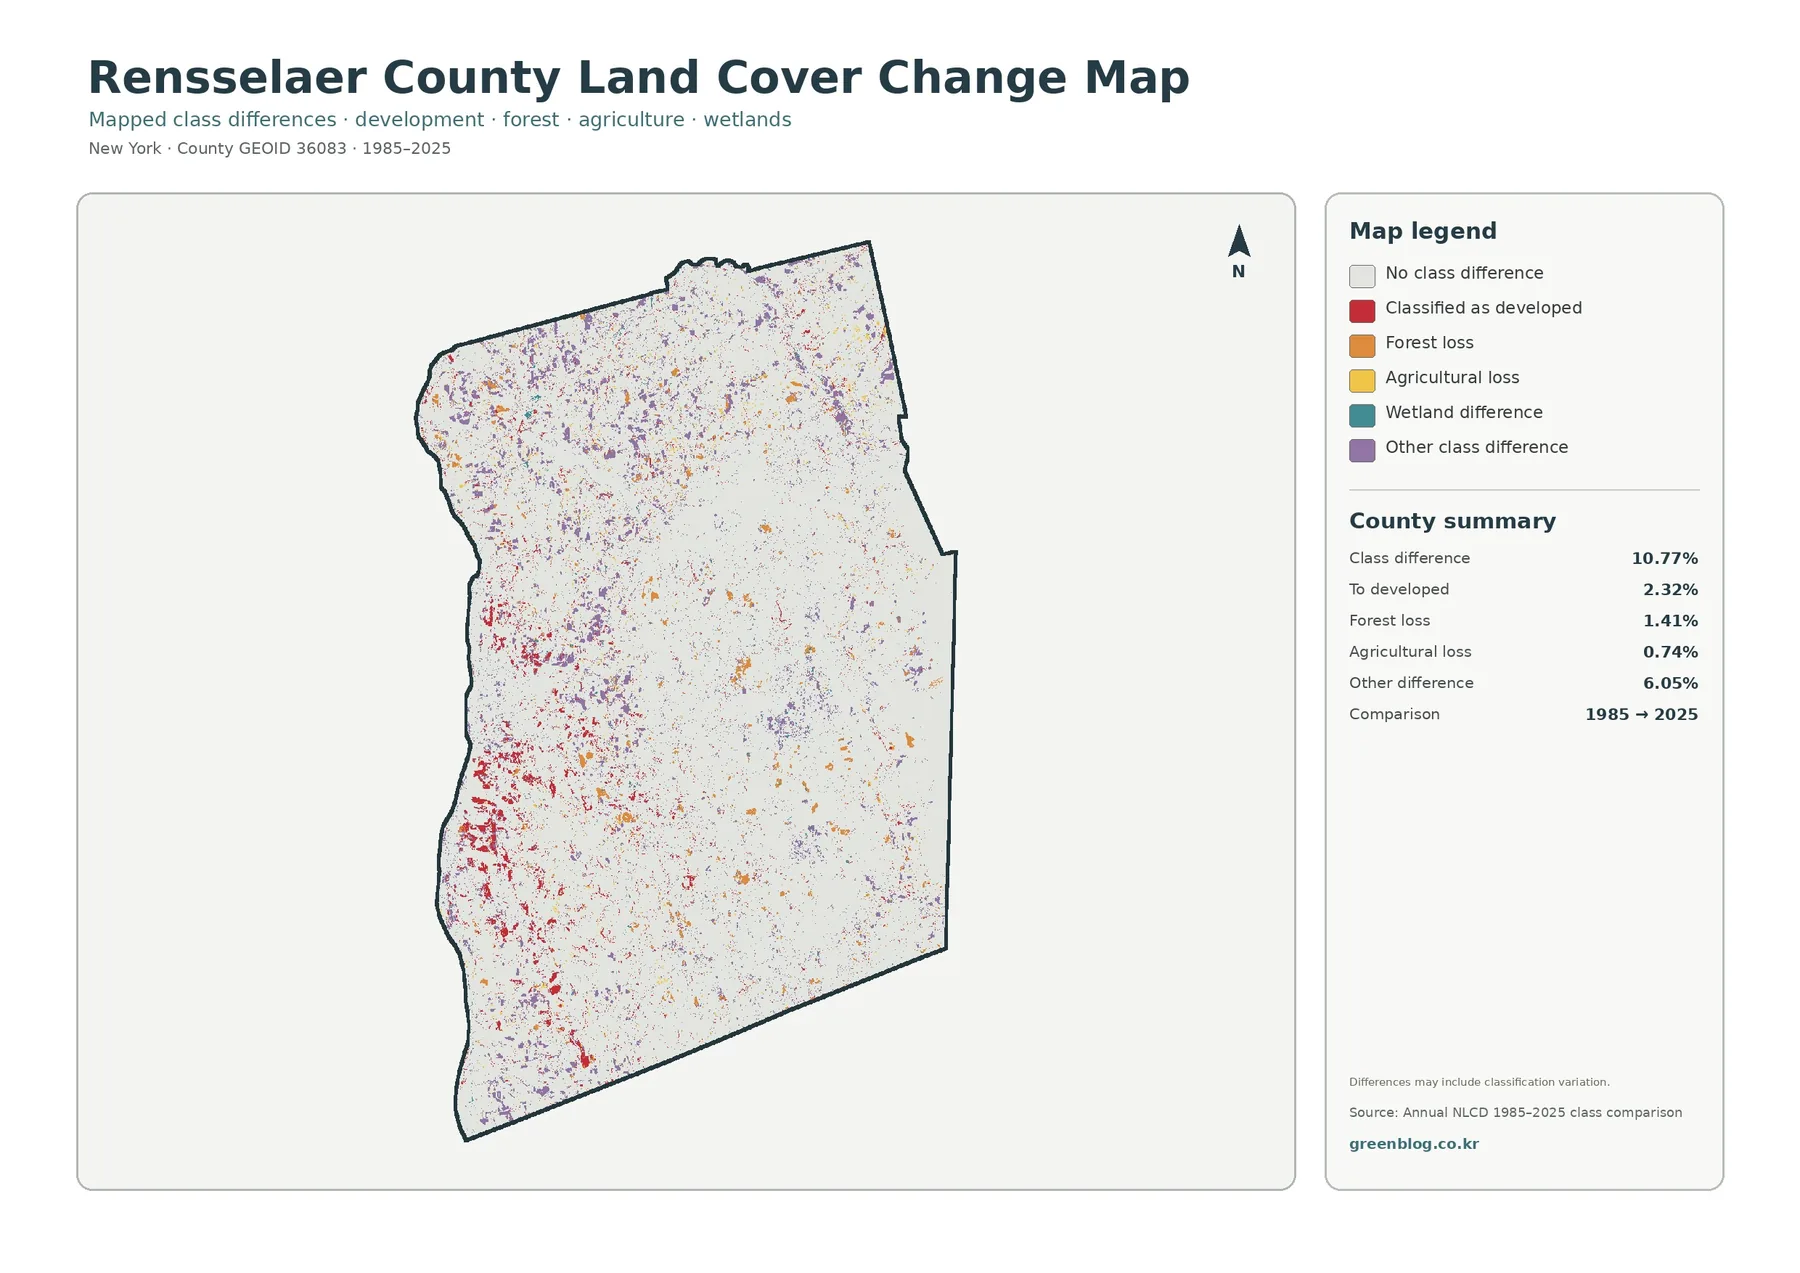
The change map compares classifications at two endpoints rather than showing every year in between. Across the county, 10.77 percent of the mapped area is marked as a class difference. The summary breaks that figure into 2.32 percent classified as developed, 1.41 percent forest loss, 0.74 percent agricultural loss, and 6.05 percent in other class differences. Most of the county therefore remains in the no-difference background, while the colored cells identify places that deserve a closer look.
Red developed-change cells are most noticeable on the western side, where the current impervious map also shows the strongest concentration of hard surfaces. That spatial overlap is useful, but the two products answer different questions. The impervious map describes the 2025 surface, while the change image marks where the endpoint classifications differ. A place can be heavily developed today and still appear unchanged if it was already classified similarly in 1985.
The 10.77 percent figure should not be described as a precise land-use conversion rate. The map itself warns that class differences may include classification variation. A 30-meter cell can contain several surface types, and the dominant class can shift when imagery, seasonal conditions, or classification methods differ. For a specific property or project site, historic aerial photographs, local records, field checks, and permit information are needed before assigning a cause or exact date to a change.
Choosing the right map for a project
Start with the general land-cover map when the goal is orientation. It provides the clearest single view of the county’s forest majority, western development, agricultural patches, wetlands, and water. Once a location of interest is identified, the forest-and-farmland map simplifies the rural classes, while the impervious map makes paved and built surfaces easier to compare. The change map is most useful after the current pattern is already understood.
Download the four original JPG maps
The ZIP file contains the original JPG versions of all four map views: 2025 land cover, forest and farmland, impervious surface and developed land, and the 1985–2025 class-difference map. Each image includes its title, legend, and county summary so it can stand on its own in a handout or presentation. The original JPGs are better suited to larger display and printing than the lighter WebP previews shown in the article.
Scale, raster cells, and other reading limits
Annual NLCD is raster data, meaning the landscape is divided into grid cells and each cell is assigned a representative class or value. At the county scale this works well for comparing broad distributions. It is less appropriate for tracing the exact edge of a small wetland, narrow road, backyard, building, or field corner. Where several surfaces fall inside the same cell, the mapped class is a simplification of a more complicated ground condition.
Land cover is also different from land use and legal status. A forest cell does not tell you whether the land is public, private, protected, or available for development. A developed cell does not identify residential, commercial, or industrial zoning. Rensselaer County’s own GIS pages caution that different layers can have different accuracy and update dates. Use these maps to understand the big picture, then move to the appropriate official parcel, zoning, environmental, or engineering source when precise decisions are required.
Frequently Asked Questions
What is the dominant land cover in Rensselaer County?
Forest is the dominant 2025 class at 59.47 percent. Agriculture is 17.84 percent and developed land is 13.47 percent, creating a visible contrast between the more settled Hudson-side west and the heavily wooded interior and eastern parts of the county.
Why is developed land 13.47% while mean impervious surface is only 3.37%?
They measure different things. Developed land is a land-cover category that can include buildings, roads, lawns, trees, and other surfaces. Impervious surface estimates the share covered by hard materials such as pavement and rooftops, so it is expected to be lower than the overall developed classification.
Does the 10.77% class difference mean that 10.77% of the county was physically transformed?
Not necessarily. It means the 1985 and 2025 classifications differ across 10.77 percent of the mapped area. Real land-cover change is part of that total, but classification variation and mixed 30-meter cells can also contribute. Site-specific conclusions require additional evidence.
Map File Information
Rensselaer County land cover maps Download the four original JPG maps for 2025 land cover, forest and farmland, impervious surface and developed land, and 1985–2025 mapped class differences in one ZIP file.
- Included Files: Use only the versions confirmed in the article and supplied images
- File Type: Use the confirmed download contents
- Intended Use: Printing, education, presentations, and map-based projects
Related Maps
- Albany County Land Cover Map
- Allegany County New York Land Cover Map
- Bronx County New York Land Cover Map
Sources and references
- MRLC Annual NLCD Data – official access to Annual NLCD land-cover and related products
- USGS Annual NLCD Land Cover Classification – class definitions and interpretation guidance
- Rensselaer County GIS – Mapping – county mapping and spatial-data resources
- Rensselaer County Hazard Mitigation Plan – county geography, topography, waterways, and environmental context
Green Map creates custom-edited map images using open geographic data sources such as geoBoundaries, Natural Earth, OpenStreetMap, and government open data.
These maps are edited visual materials, not raw data files, and are provided for education, documents, presentations, and graphic reference.