
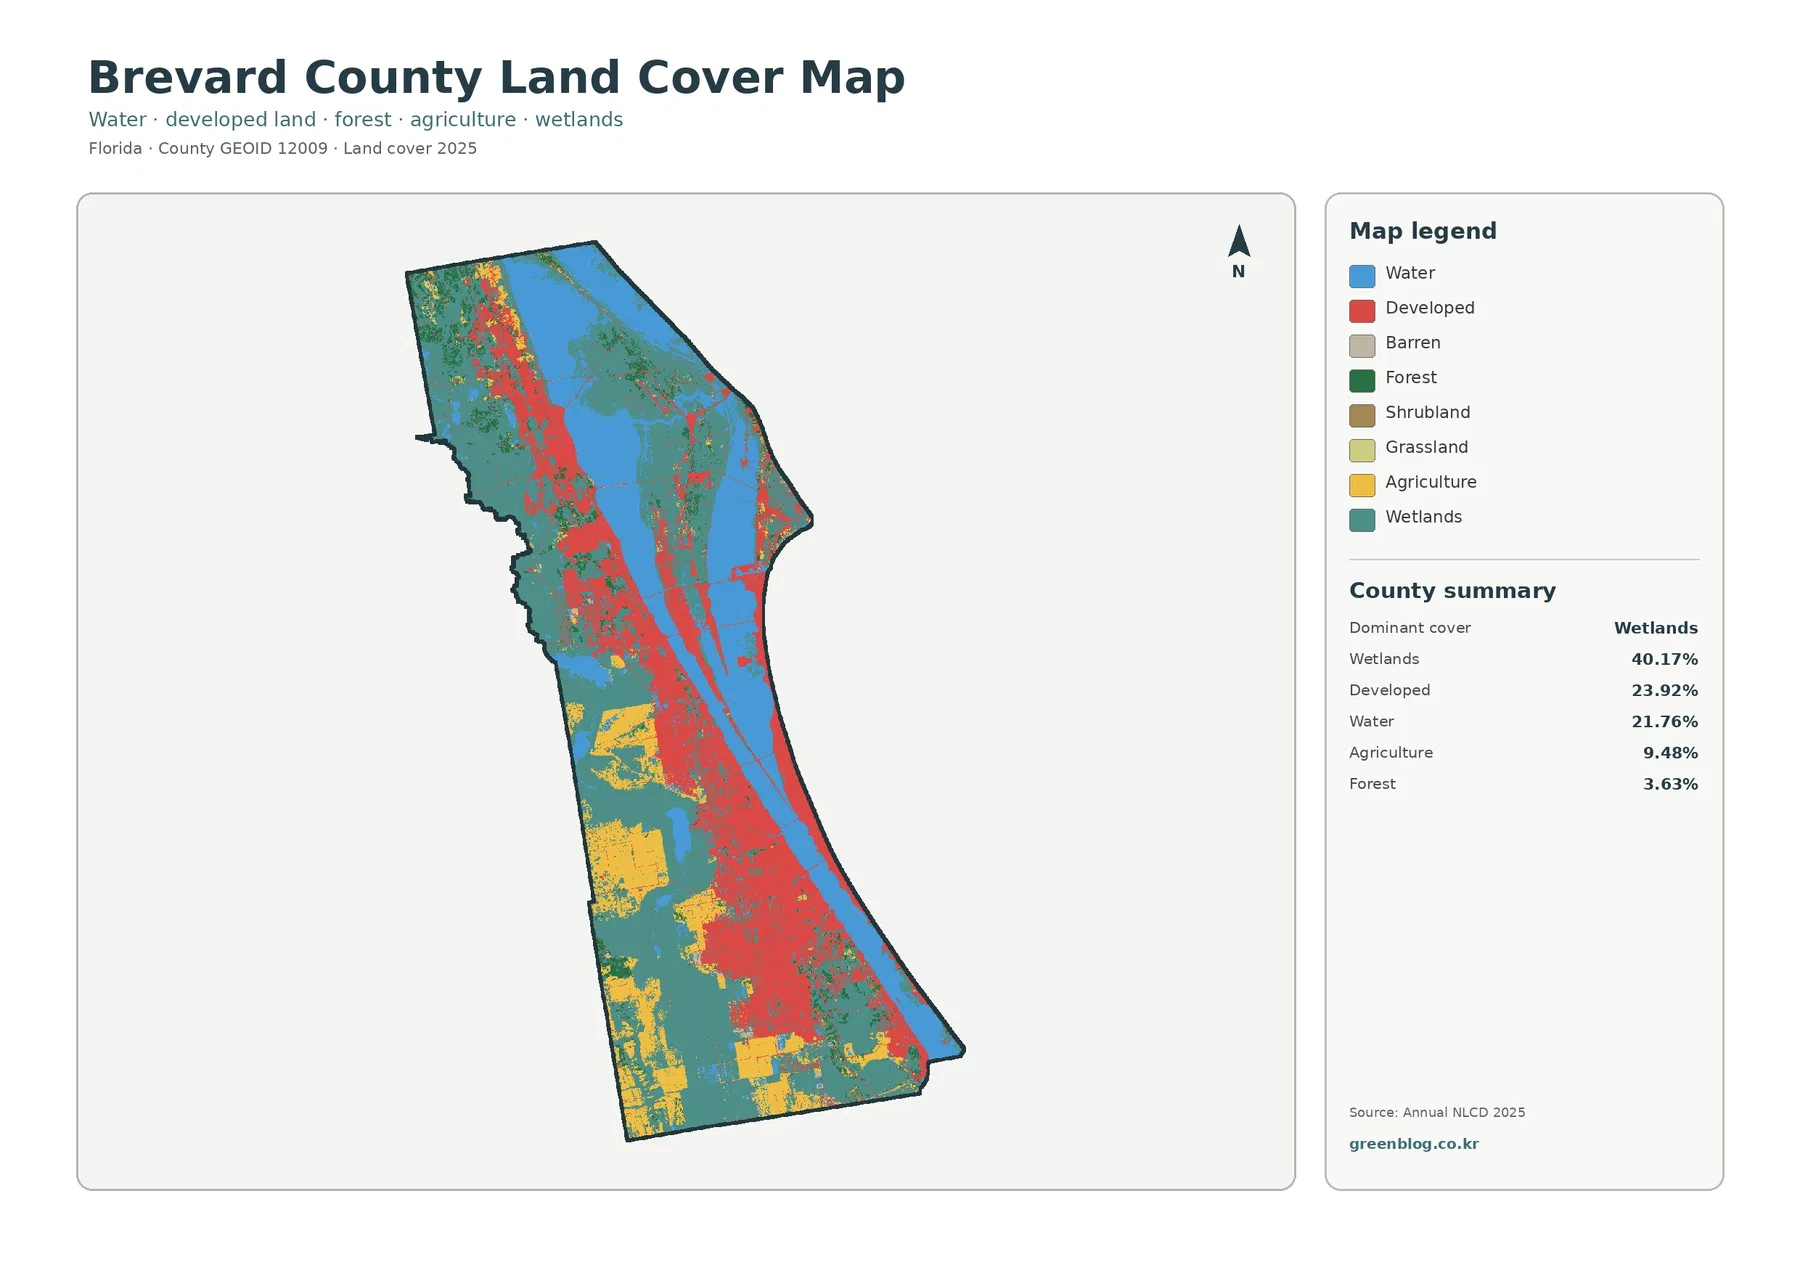
Brevard County Florida Land Cover Map — Lagoon Water, Coastal Development, and Extensive Wetlands
Brevard County’s maps are dominated by water and wetlands, but the county also contains one of Florida’s longest urbanized coastal
Brevard County’s maps are dominated by water and wetlands, but the county also contains one of Florida’s longest urbanized coastal
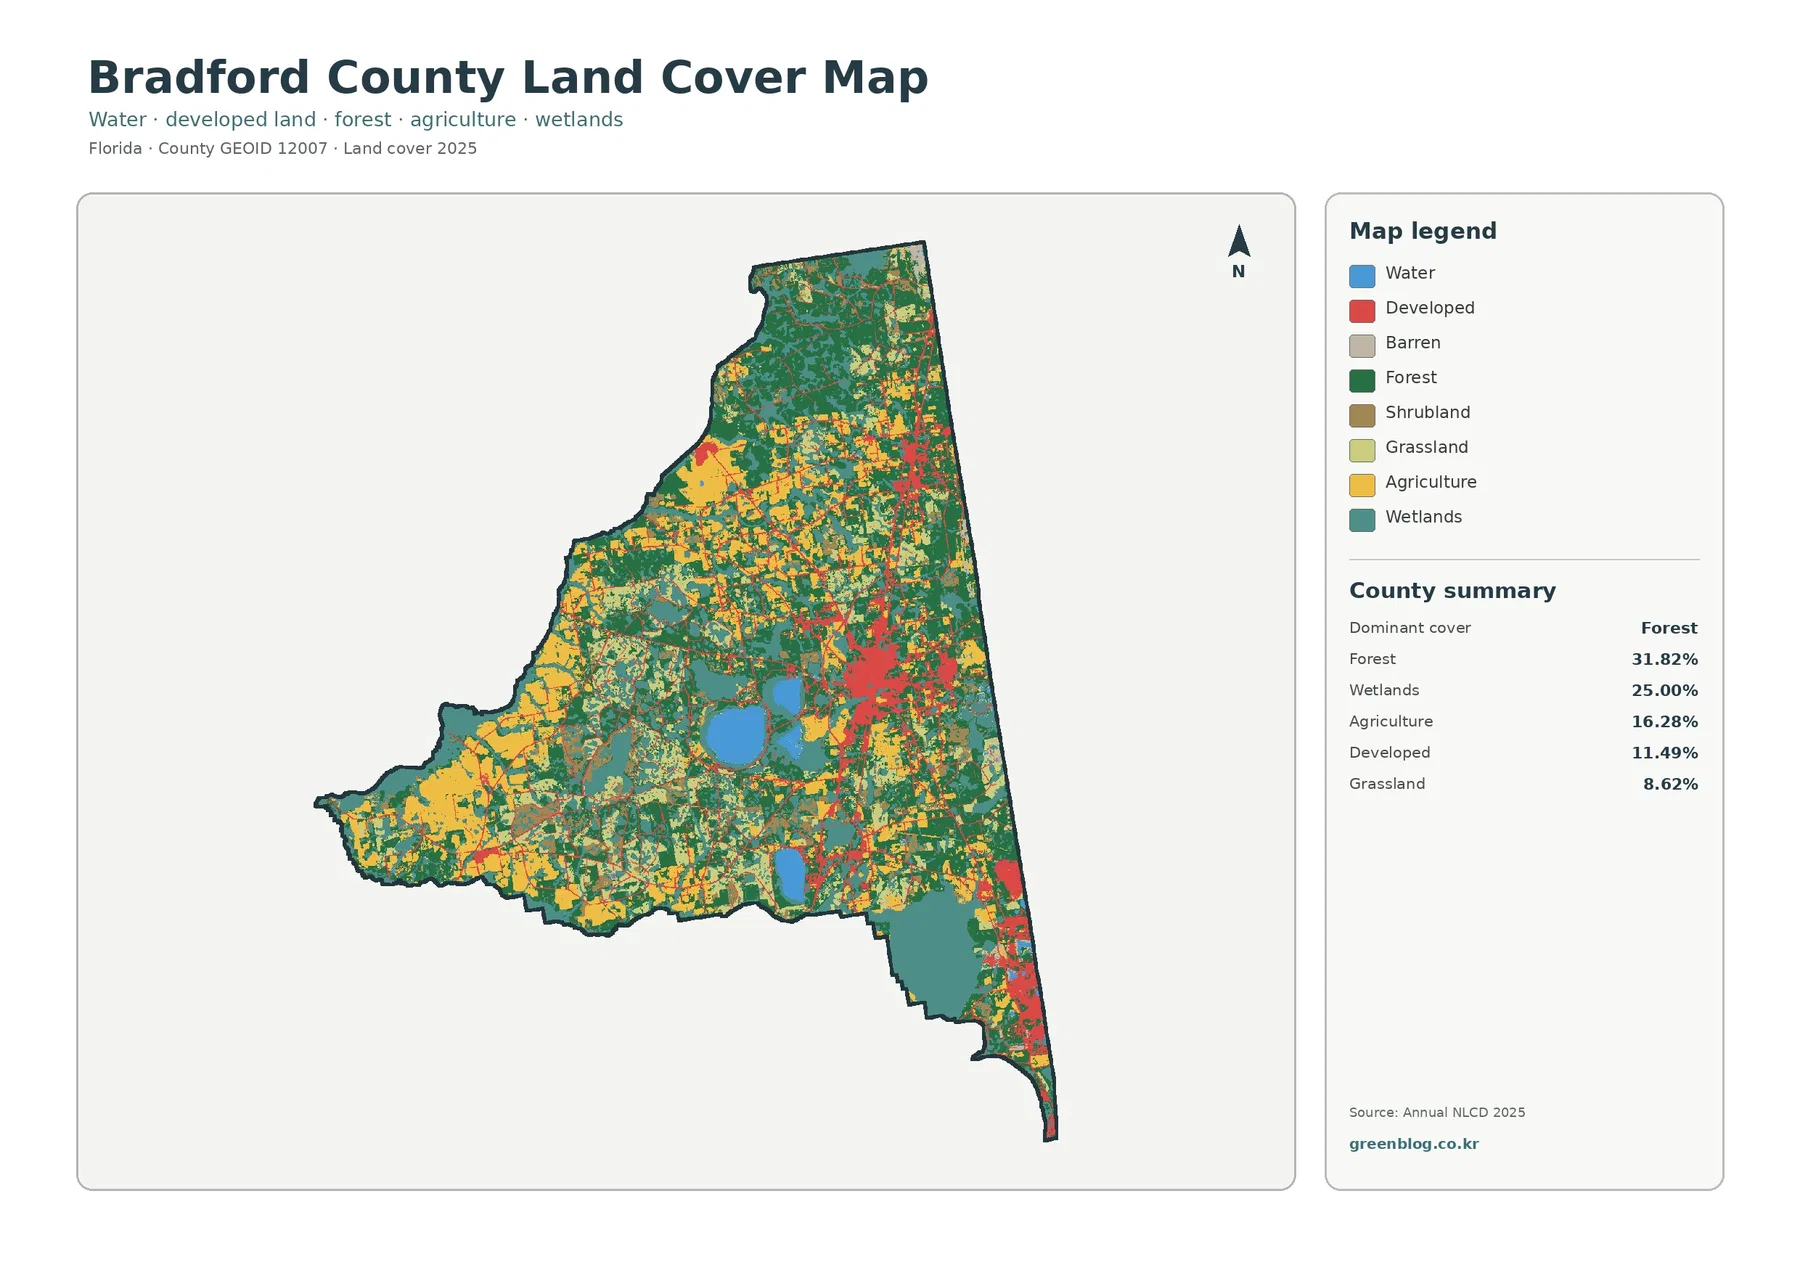
Bradford County’s 2025 land-cover pattern is a patchwork rather than a landscape dominated by one surface. Forest is the largest
Bradford County Florida Land Cover Map | Forest, Wetlands & Starke Read More »
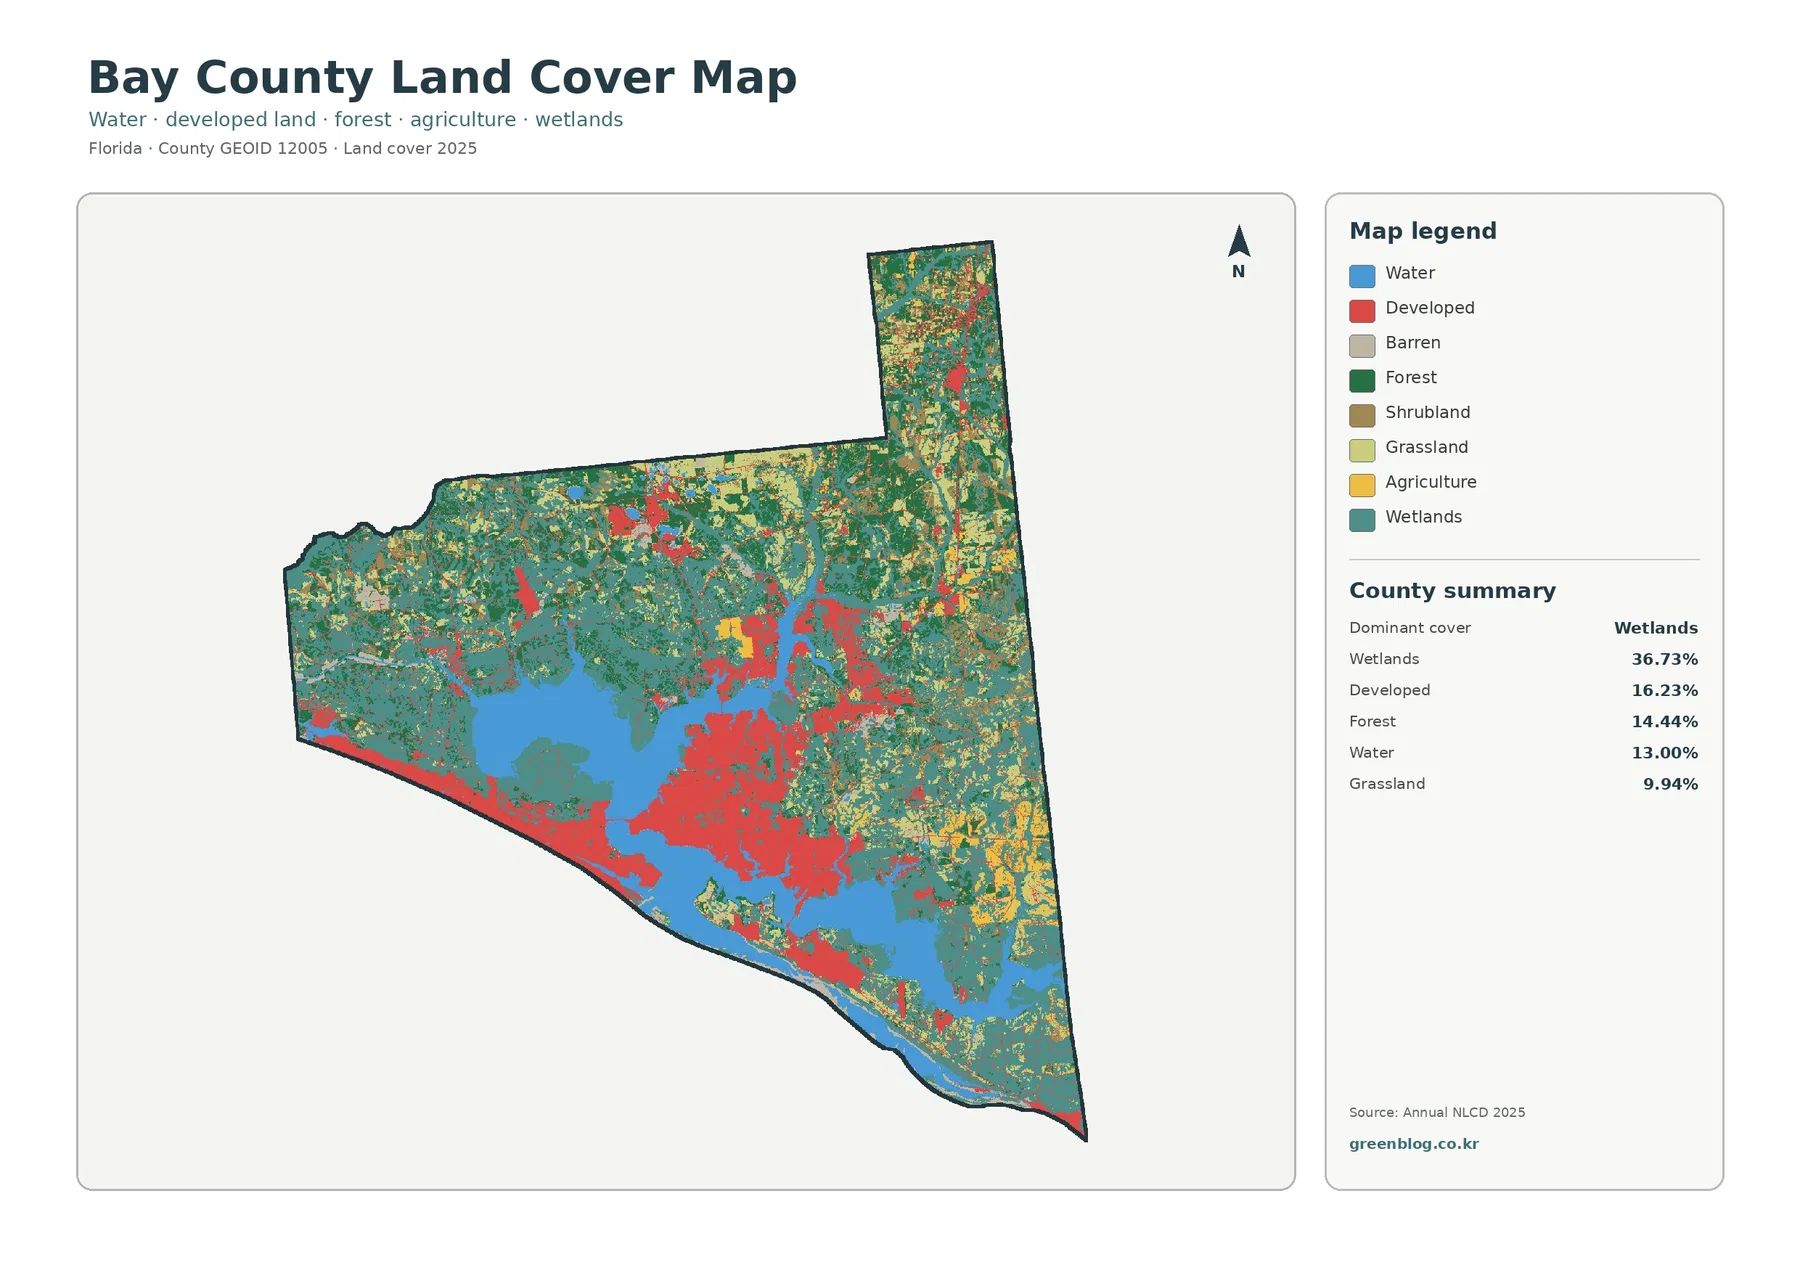
Water and wetlands shape Bay County’s 2025 land-cover pattern more strongly than any single urban feature. Wetlands are the largest
Bay County Florida Land Cover Map — St. Andrews Bay Wetlands and Coastal Growth Read More »
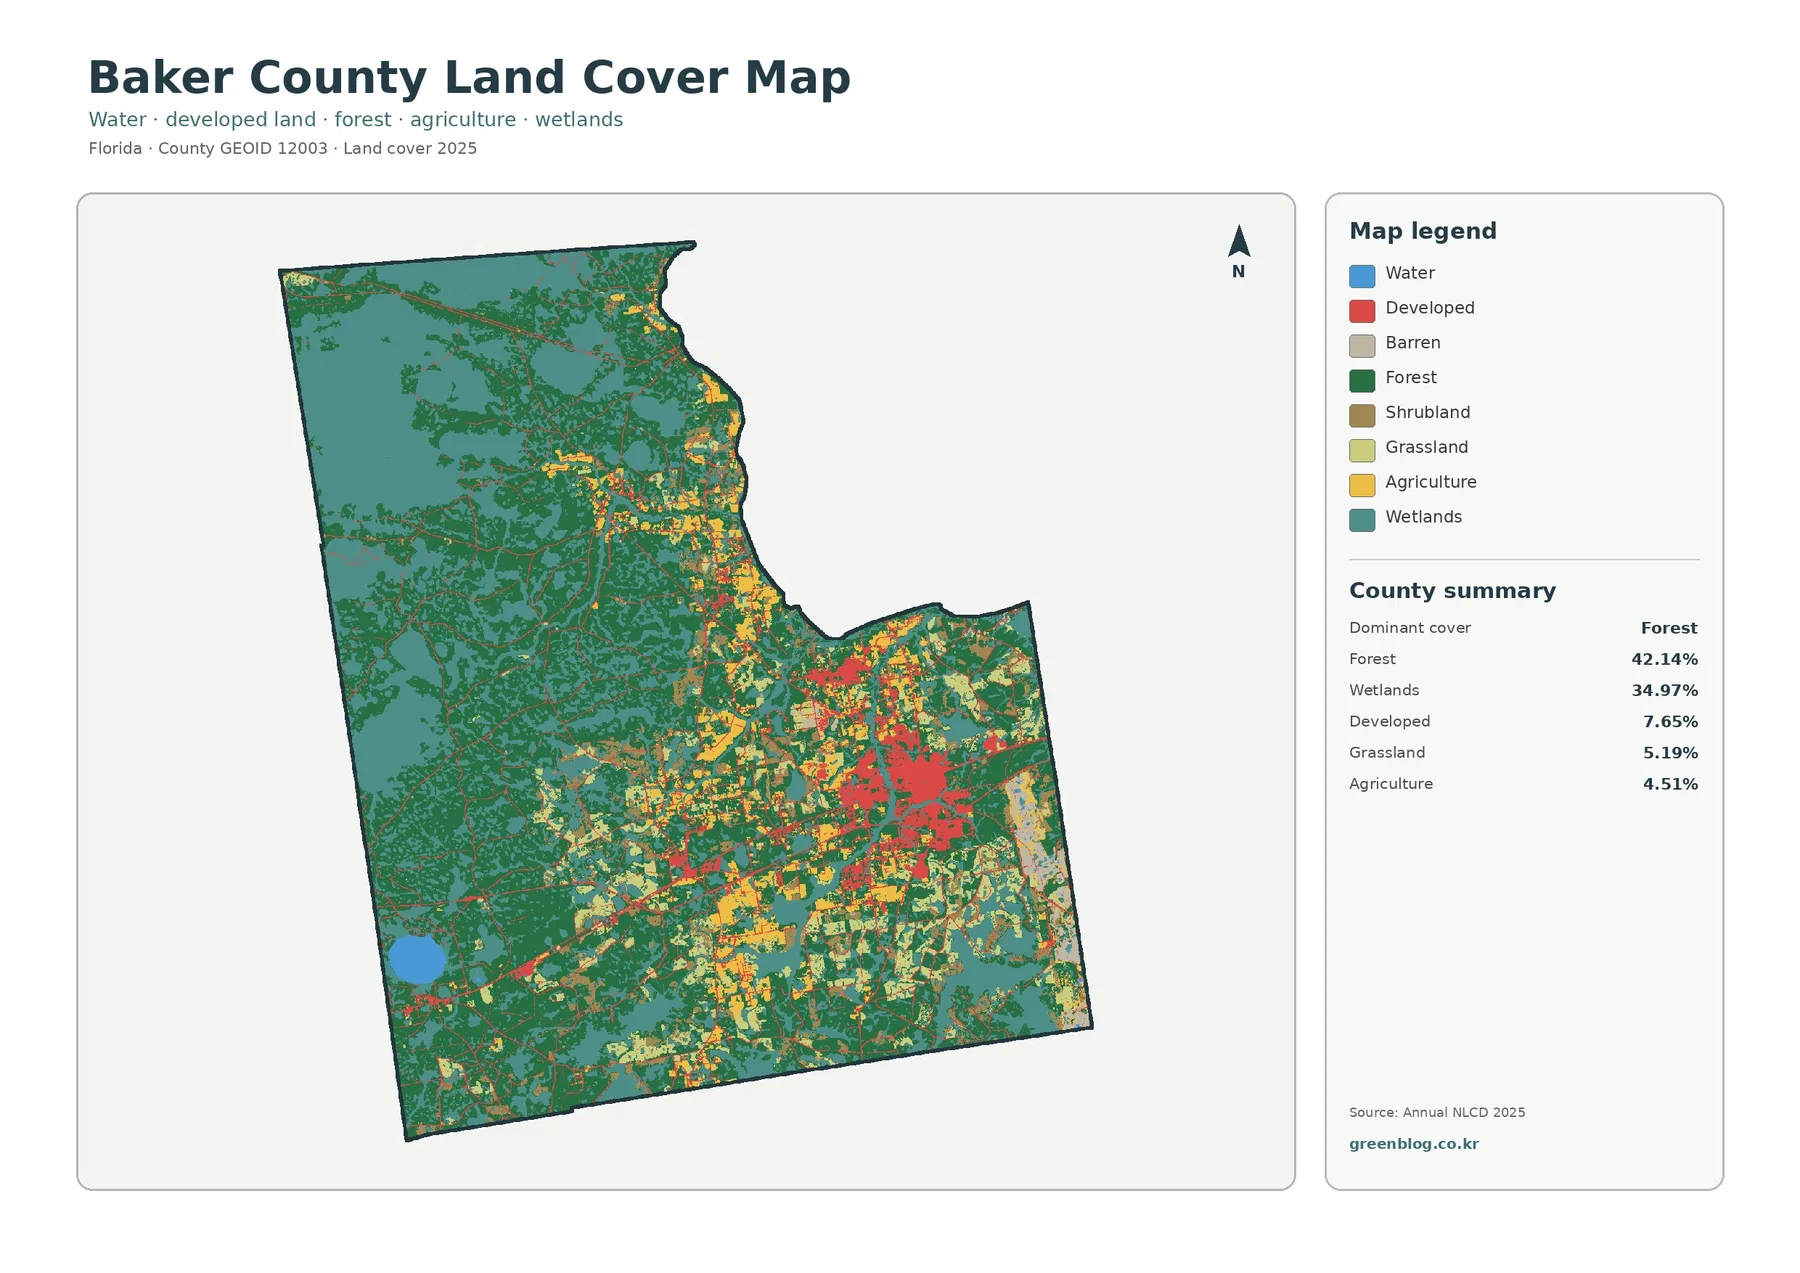
Baker County’s 2025 land-cover pattern is dominated by two classes: forest at 42.14% and wetlands at 34.97%. Together they account
Baker County Florida Land Cover Map | Forest, Wetlands & Macclenny Development Read More »
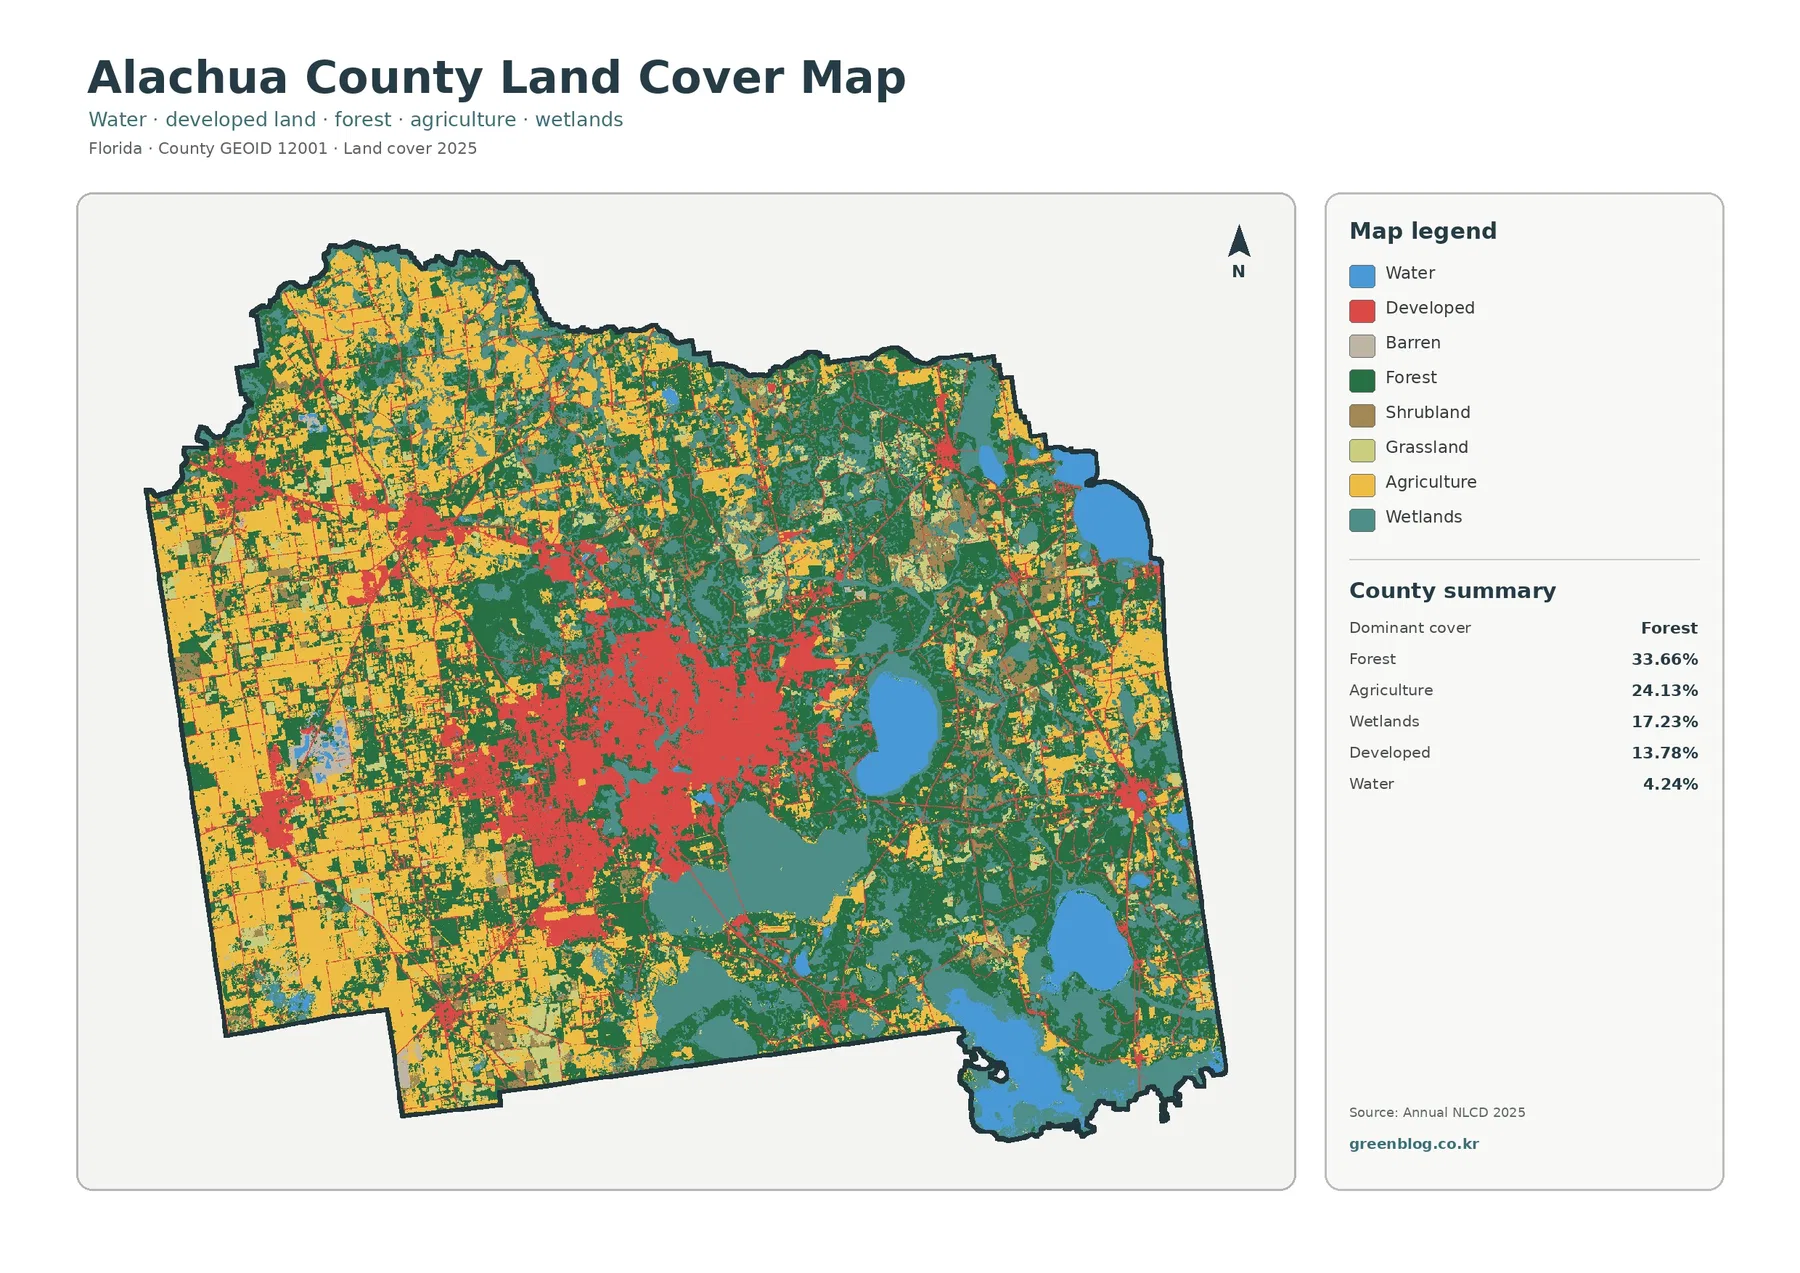
Alachua County’s 2025 land-cover pattern is unusually varied for a single county. Forest is the largest class at 33.66%, followed
Alachua County Florida Land Cover Map | Gainesville, Forest, Farms & Wetlands Read More »
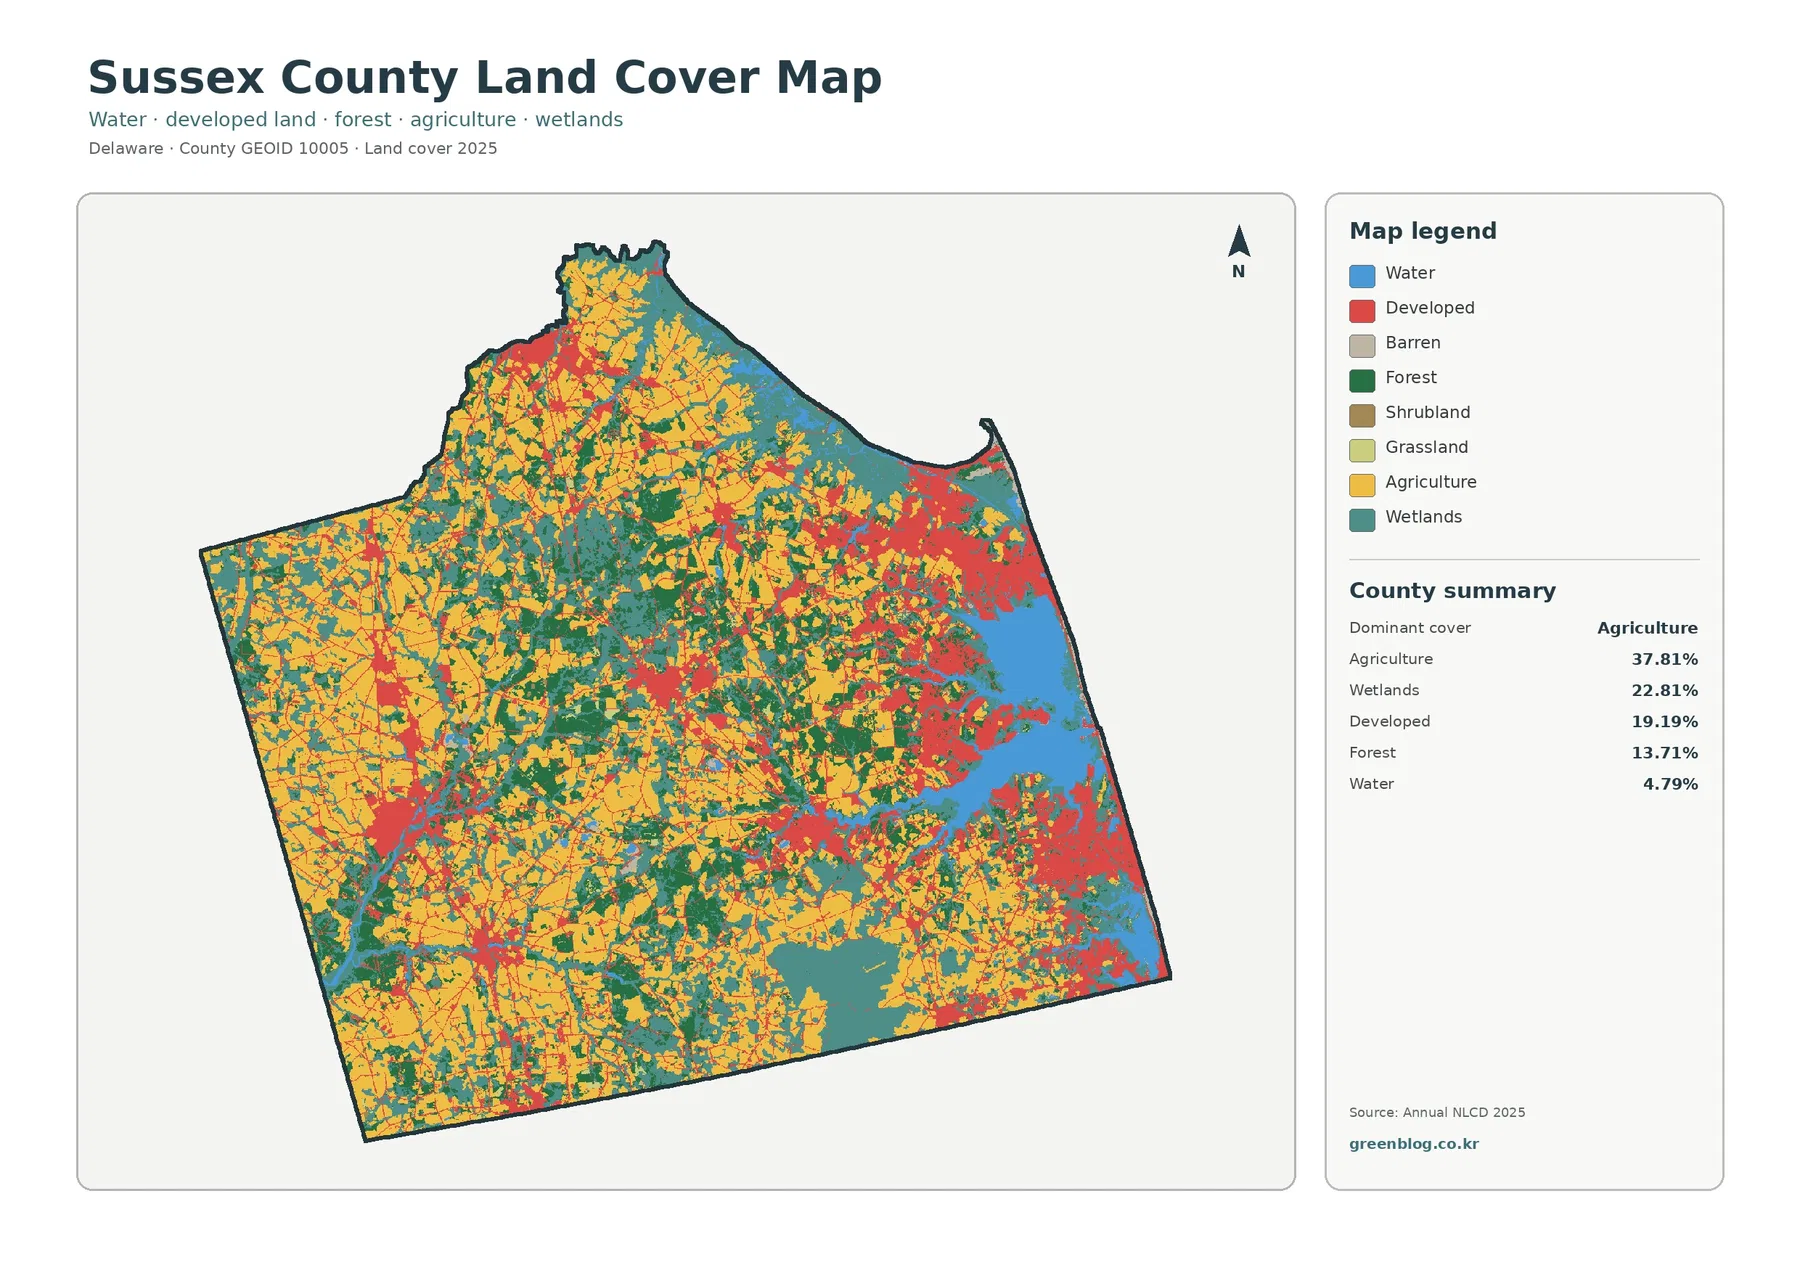
Sussex County has a strongly mixed 2025 land-cover pattern rather than a single dominant landscape. Agriculture is the largest class
Sussex County Delaware Land Cover Map: Farmland, Wetlands & Change Read More »
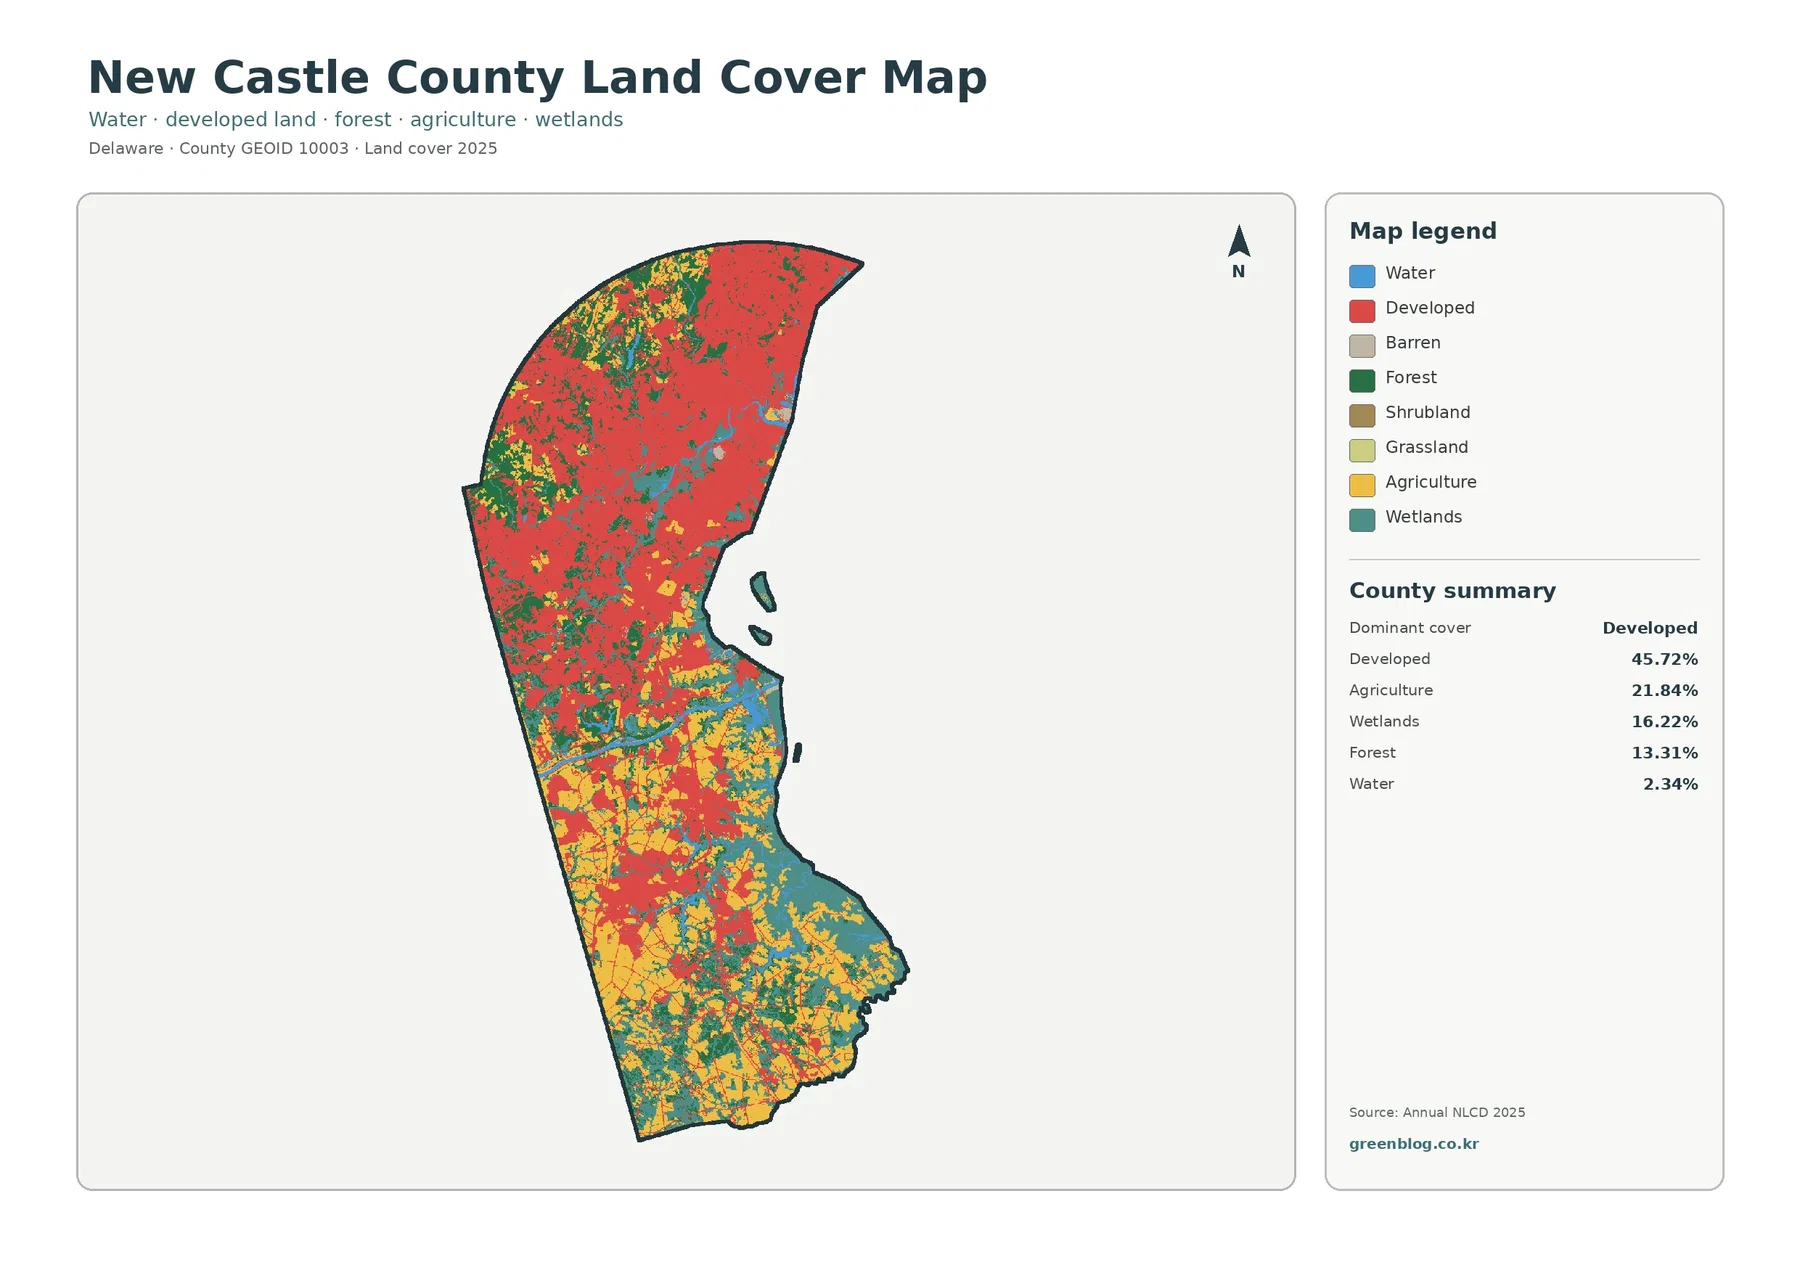
New Castle County has the strongest developed-land share of Delaware’s three counties in this map set. The 2025 summary lists
New Castle County Delaware Land Cover Map | Urban North, Farmland South & Change Read More »
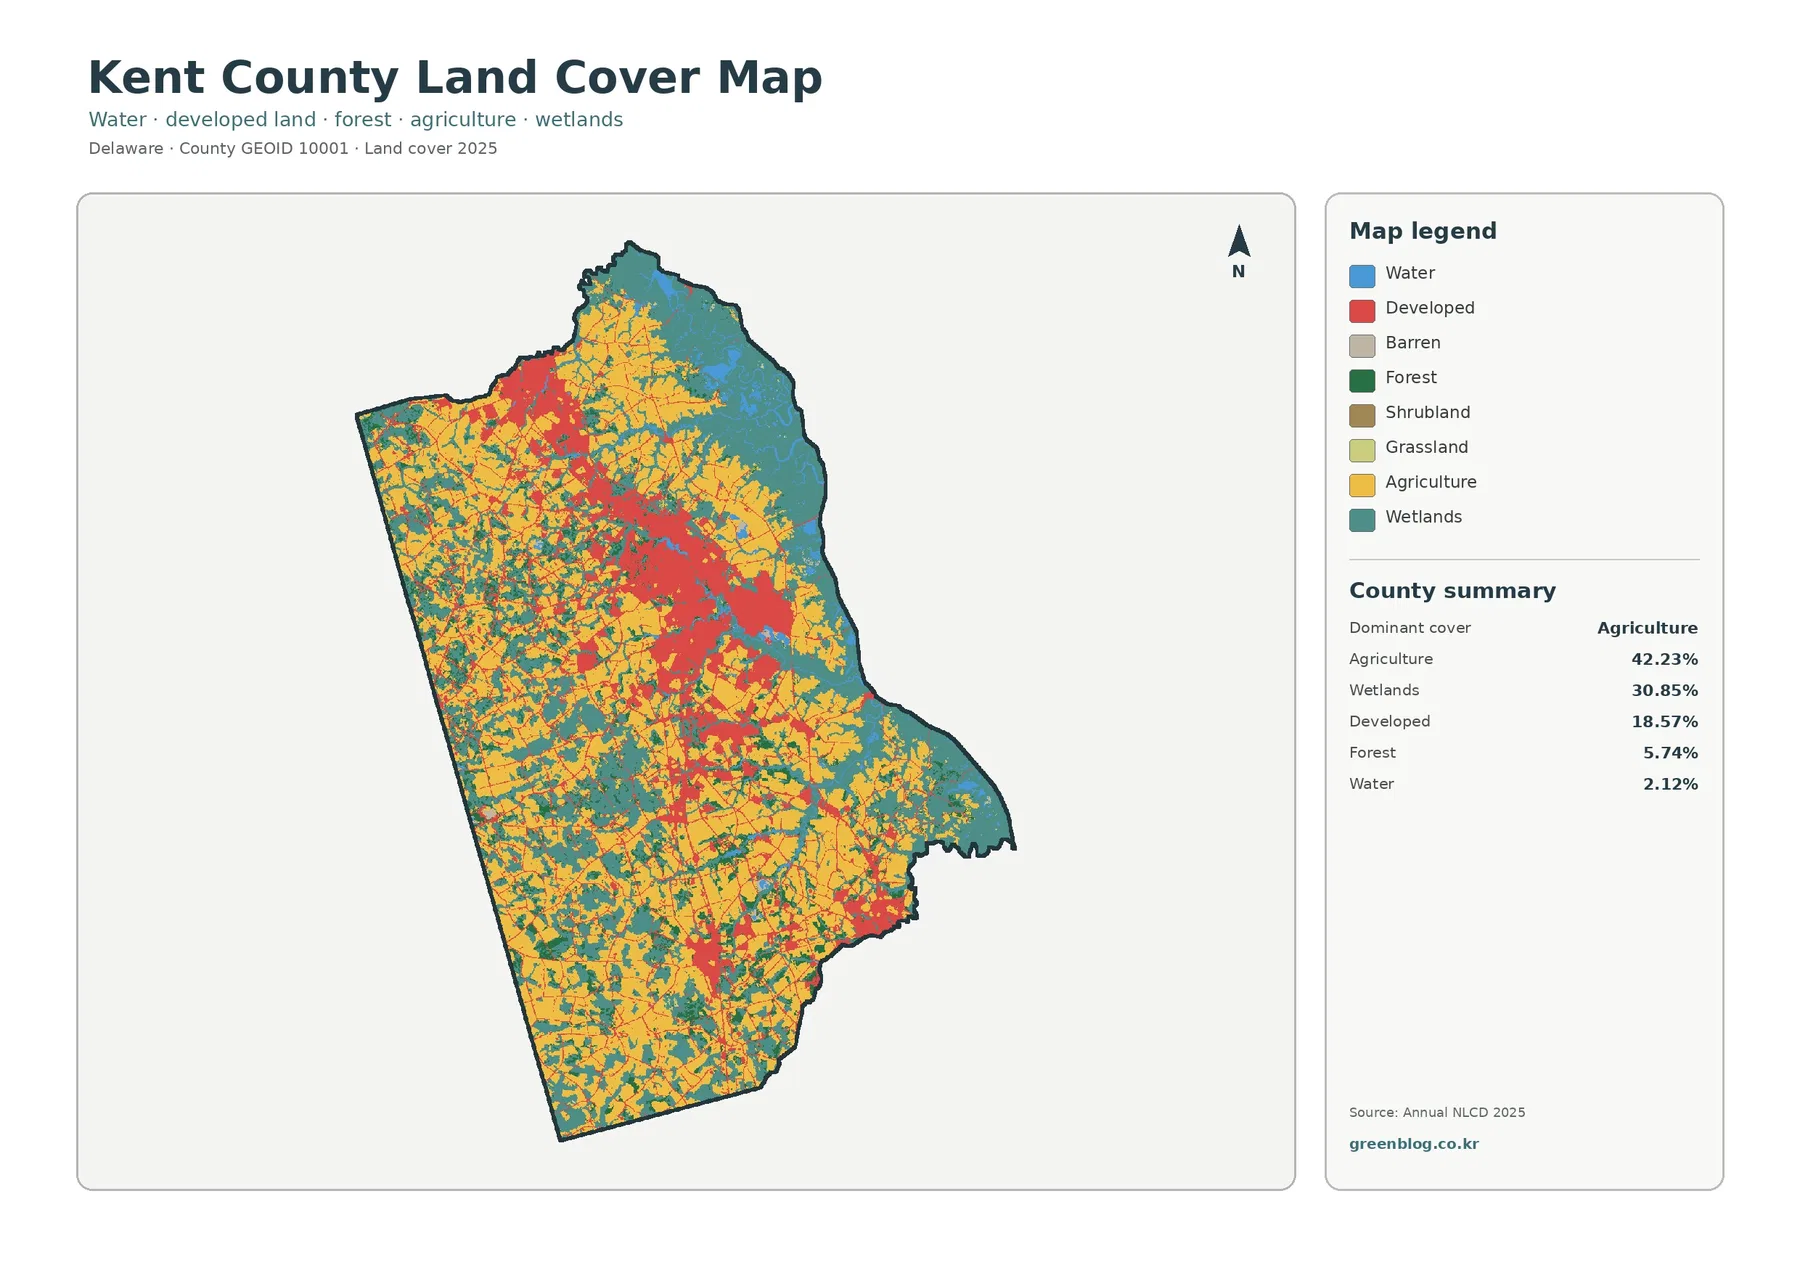
Kent County, Delaware is dominated by two land-cover settings that are easy to see in the 2025 maps: agriculture and
Kent County Delaware Land Cover Map: Farmland, Wetlands, and Development in 2025 Read More »
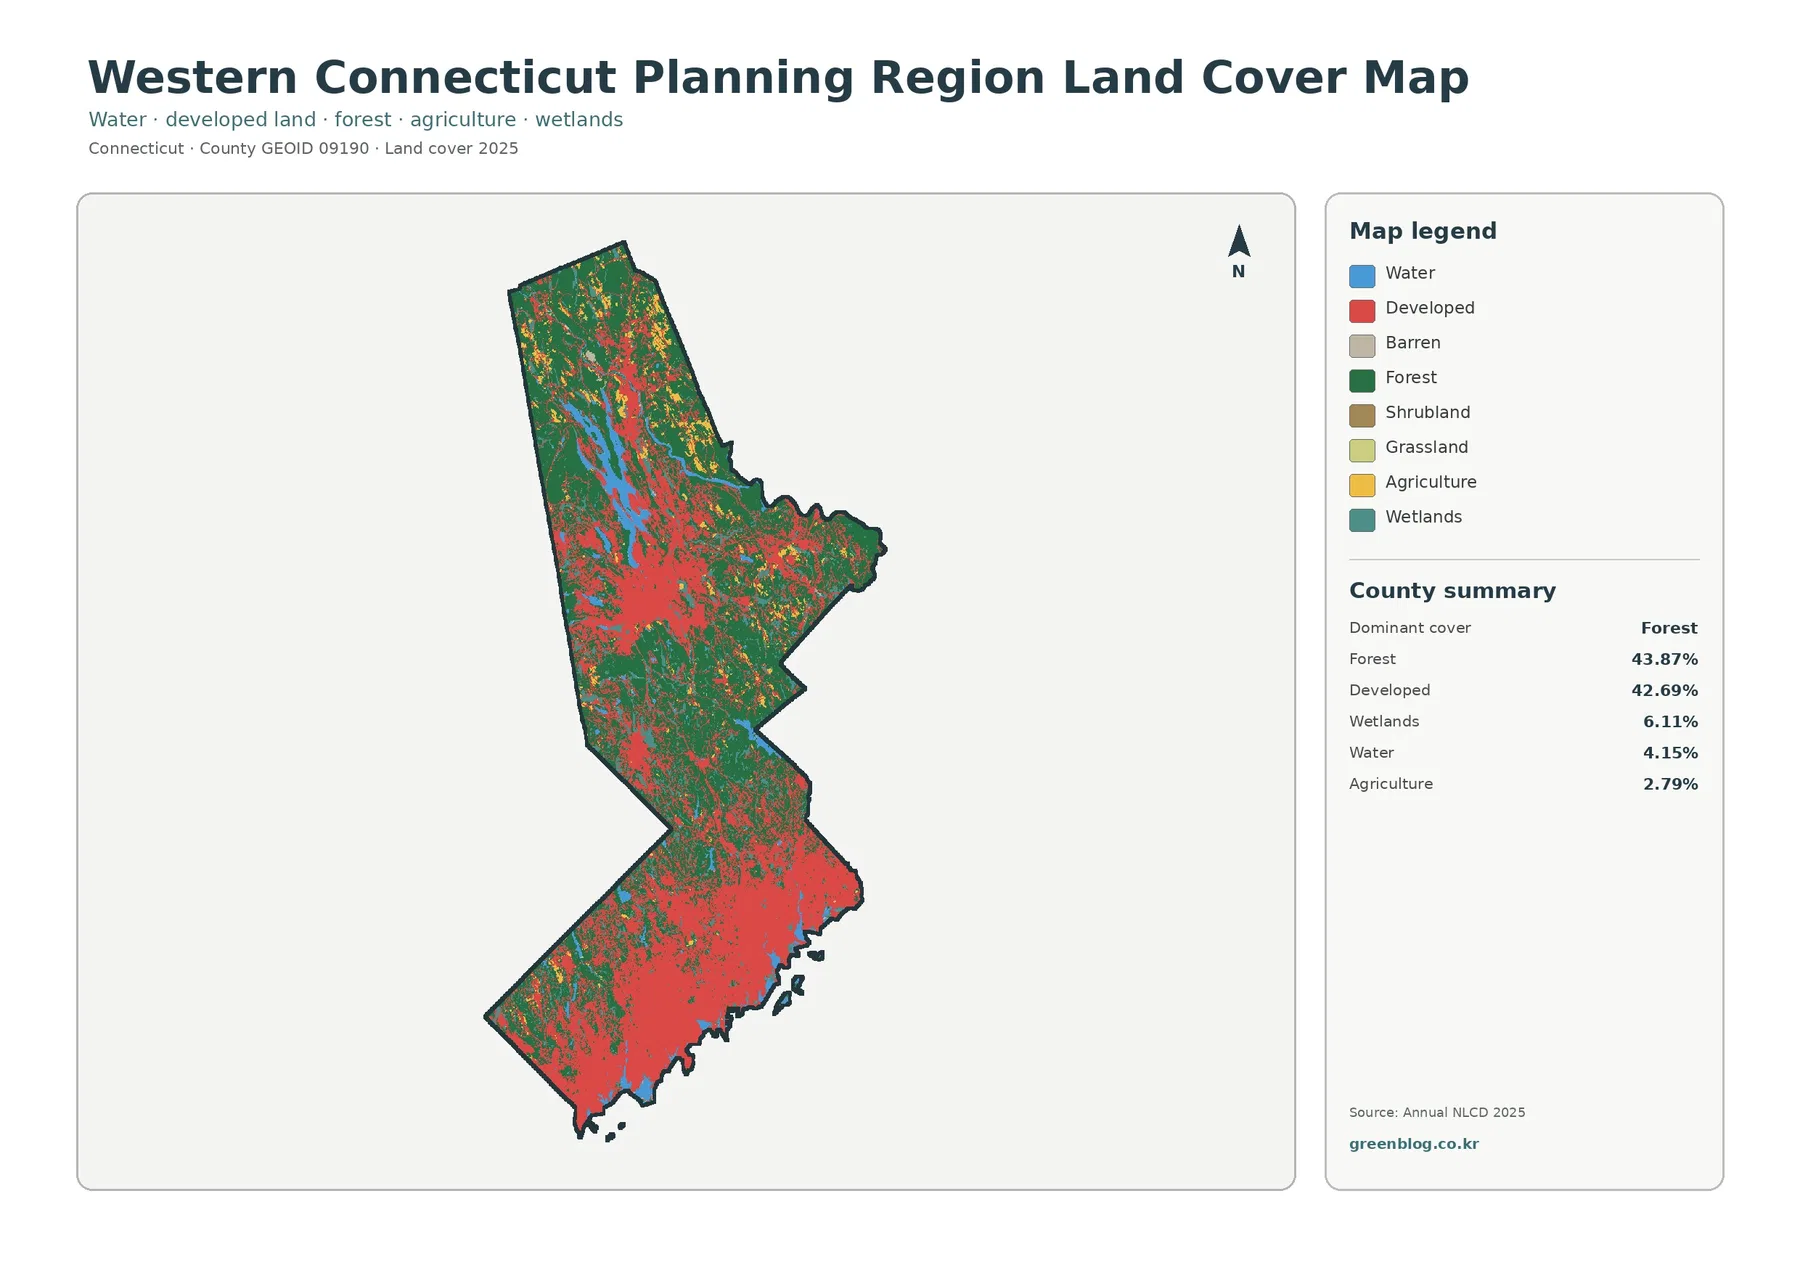
Western Connecticut has one of the clearest forest-versus-development contrasts in this set of Connecticut planning-region maps. In the 2025 summary,