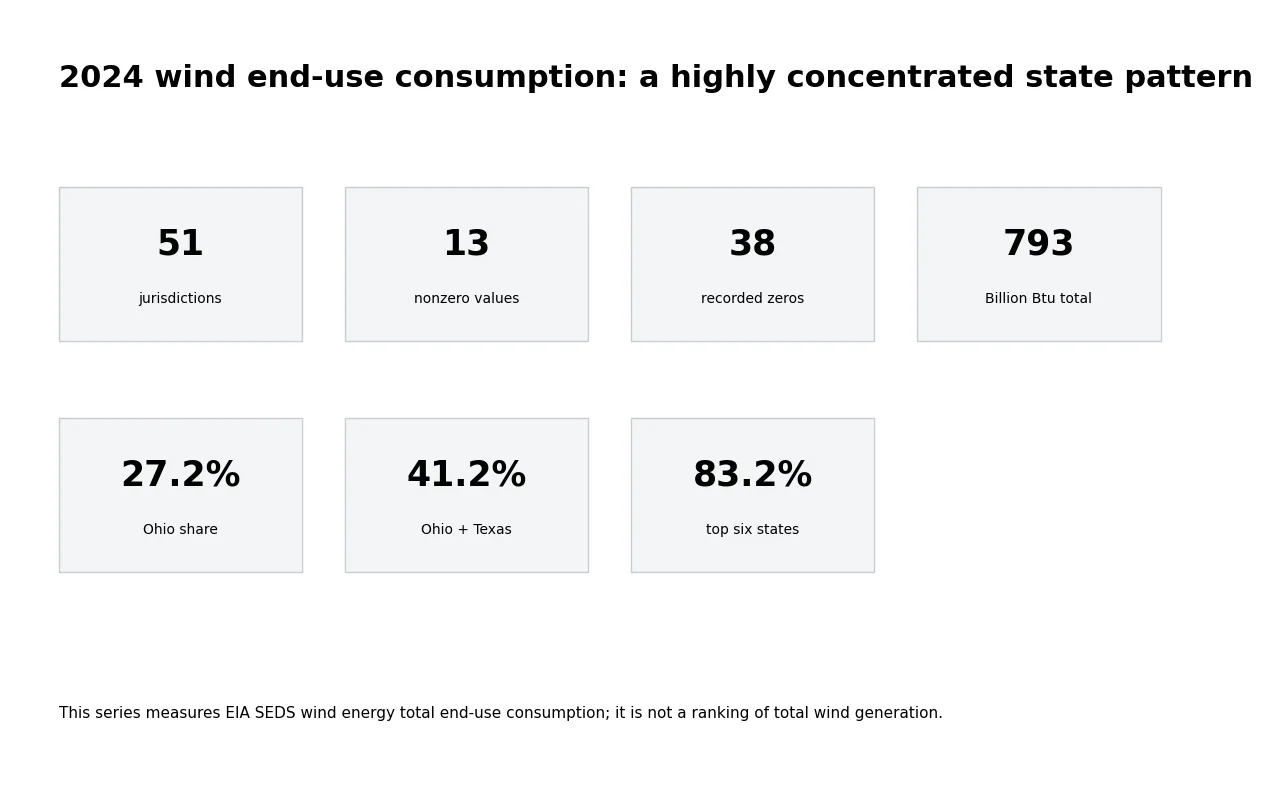
Wind energy total end-use consumption was concentrated in a small number of U.S. states in 2024. Across the 50 states and the District of Columbia, the EIA State Energy Data System records 13 jurisdictions with values above zero and 38 with a recorded value of zero. The 51-jurisdiction sum is 793 billion Btu. Ohio stands well above the rest at 216 billion Btu, followed by Texas at 111, Wisconsin at 92, Kansas at 85, Minnesota at 81, and California at 75 billion Btu.
Those numbers should not be read as a league table of wind generation. The EIA series used here is specifically “Wind energy total end-use consumption.” In the SEDS variable definitions, that series is calculated from commercial-sector and industrial-sector wind consumption. It is therefore a much narrower measure than total wind electricity generated in a state, installed wind capacity, or all electricity ultimately associated with wind power. Keeping that distinction clear is essential because the ranking can look very different from familiar wind-generation rankings.
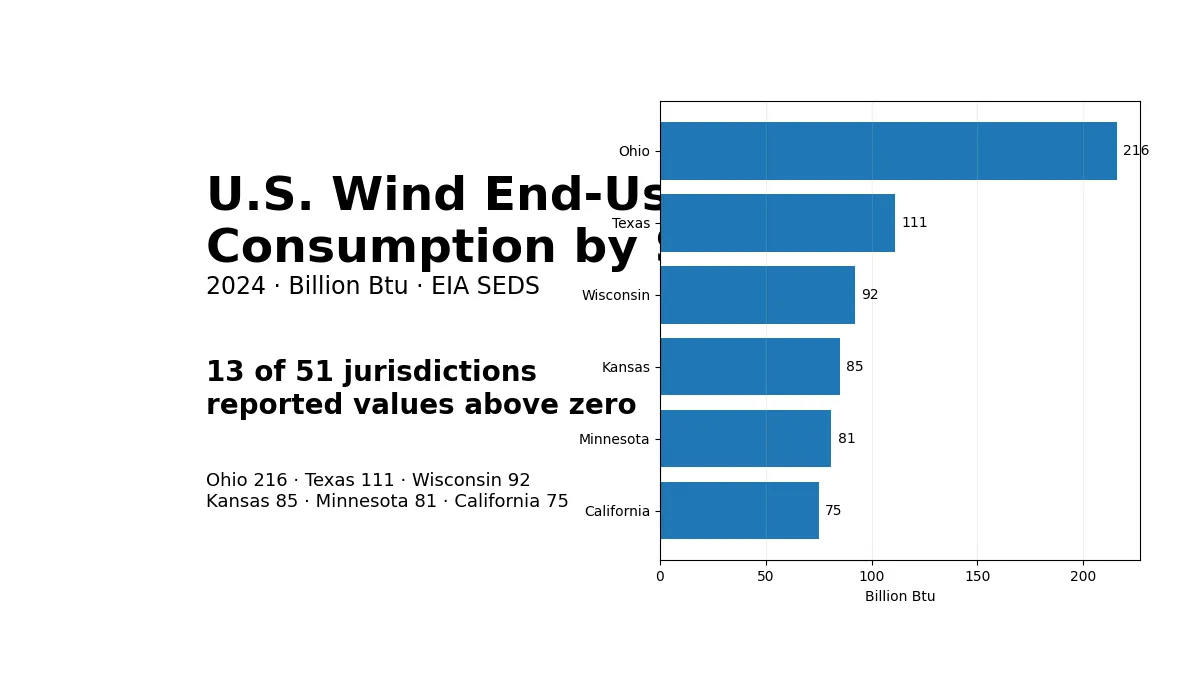
Table of Contents
What this EIA measure actually represents
SEDS expresses energy sources in common Btu units so that state energy accounts can be compared consistently. The metric in this dataset is measured in billion Btu and uses a common 2024 observation year. EIA identifies the series as wind energy total end-use consumption. Its formal SEDS formula adds the commercial-sector wind component to the industrial-sector wind component. That formula is the clearest way to understand what belongs in the number and what does not.
The word “end-use” matters. It separates the series from wind energy used in the electric-power sector and from a state’s overall wind generation. Electricity generated from wind can enter the grid and later be sold to residential, commercial, industrial, or other customers as electricity. That broader electricity flow is not what this particular wind end-use series is designed to rank. As a result, a state can be a major wind generator but still have a small value here.
A value of zero also needs careful treatment. Every jurisdiction is present in the state slice, and 38 observations are recorded as 0 billion Btu. They are not missing rows that have been filled with zero. At the same time, the value should not be stretched into the claim that a state had no wind generation or no electricity from wind. It only says that the value for this specific SEDS series is zero for 2024.
A sharply concentrated national pattern
Ohio alone accounts for 27.2% of the 51-jurisdiction total. Adding Texas brings the two-state share to 41.2%, while the top three states reach 52.8%. The top six—Ohio, Texas, Wisconsin, Kansas, Minnesota, and California—sum to 660 billion Btu, or 83.2% of the total. The top ten states account for 96.8%. Because all positive values are contained in only 13 states, the series has a distinctly concentrated rather than broadly distributed pattern.
The simple mean across all 51 jurisdictions is 15.5 billion Btu, but the median is 0. That difference is informative. A large majority of states are at zero in this series, while a few observations are much larger. For such a skewed distribution, the mean by itself is not a good description of a typical state. The number of positive observations, the median, and the ranked values provide a more useful picture.
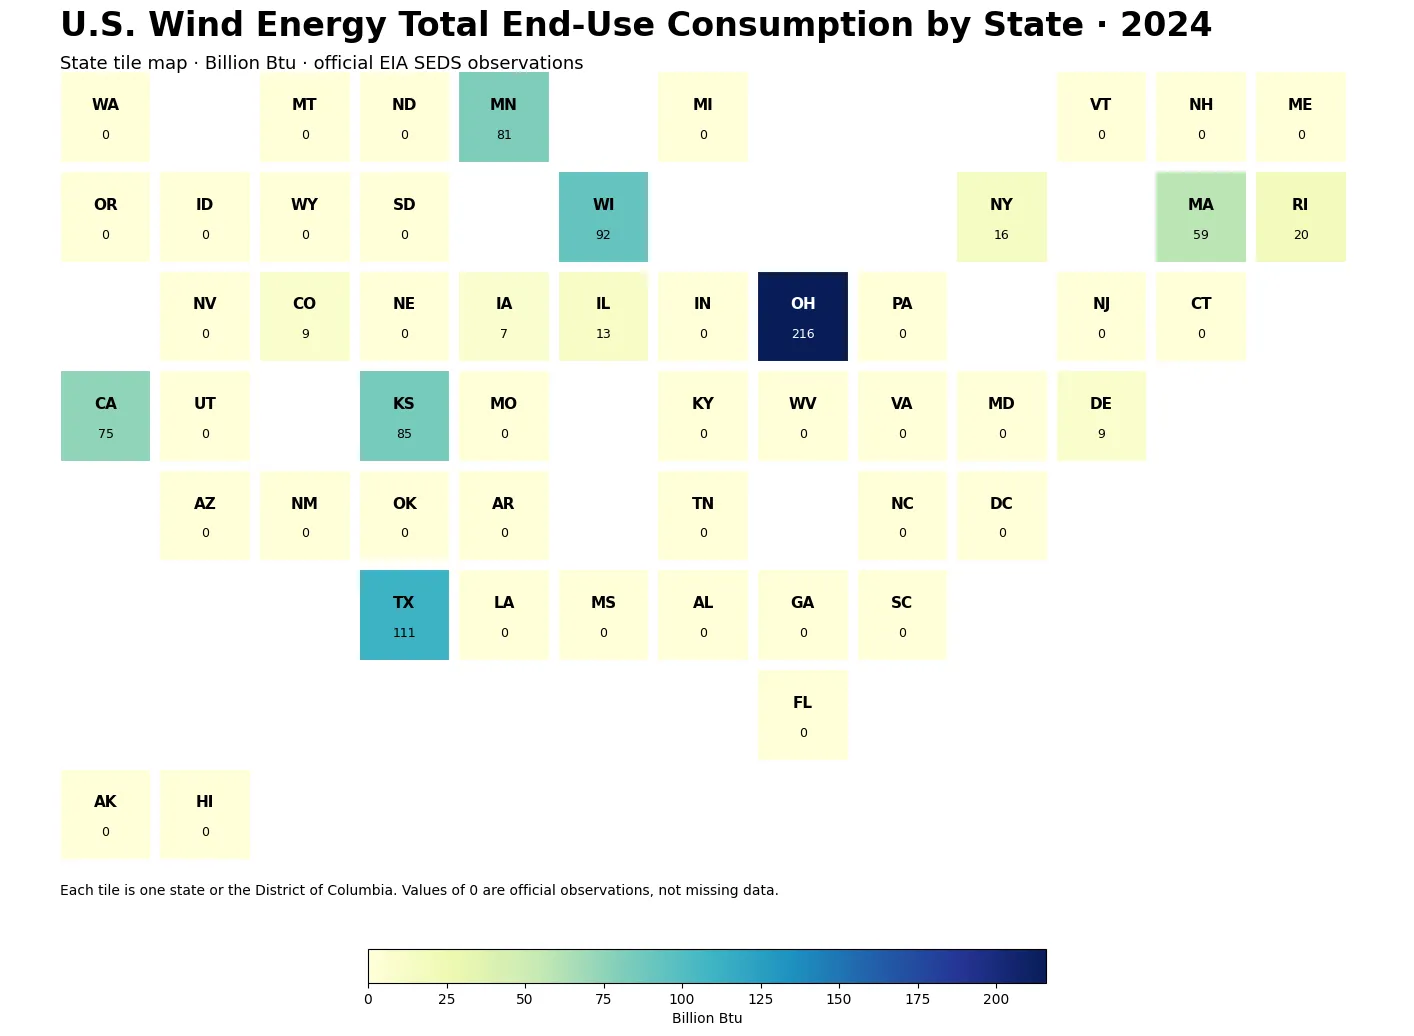
The tile map gives every jurisdiction equal visual area, avoiding the tendency of a conventional geographic map to make large western states dominate the page simply because of land size. Ohio is immediately visible as the strongest value. Texas, Wisconsin, Kansas, Minnesota, and California form the next high-value group. Massachusetts is also clearly above the lower positive-value states. In the Northeast, Rhode Island, New York, and Delaware have positive observations even though their values are far below the leaders.
How the leading states compare
Ohio’s 216 billion Btu is nearly twice the Texas value of 111. The next cluster is tighter: Wisconsin records 92, Kansas 85, Minnesota 81, and California 75 billion Btu. Massachusetts follows at 59. Below that point, the scale falls quickly to Rhode Island at 20, New York at 16, Illinois at 13, Delaware and Colorado at 9 each, and Iowa at 7 billion Btu.
The dataset supports those comparisons, but it does not by itself explain why the commercial and industrial wind end-use number is larger in one state than another. It would be tempting to attribute the pattern directly to wind resources, installed capacity, state policy, or industrial structure. Any of those factors might be relevant in a broader study, but they are not variables in this state slice. A causal explanation would require additional evidence rather than inference from the ranking alone.
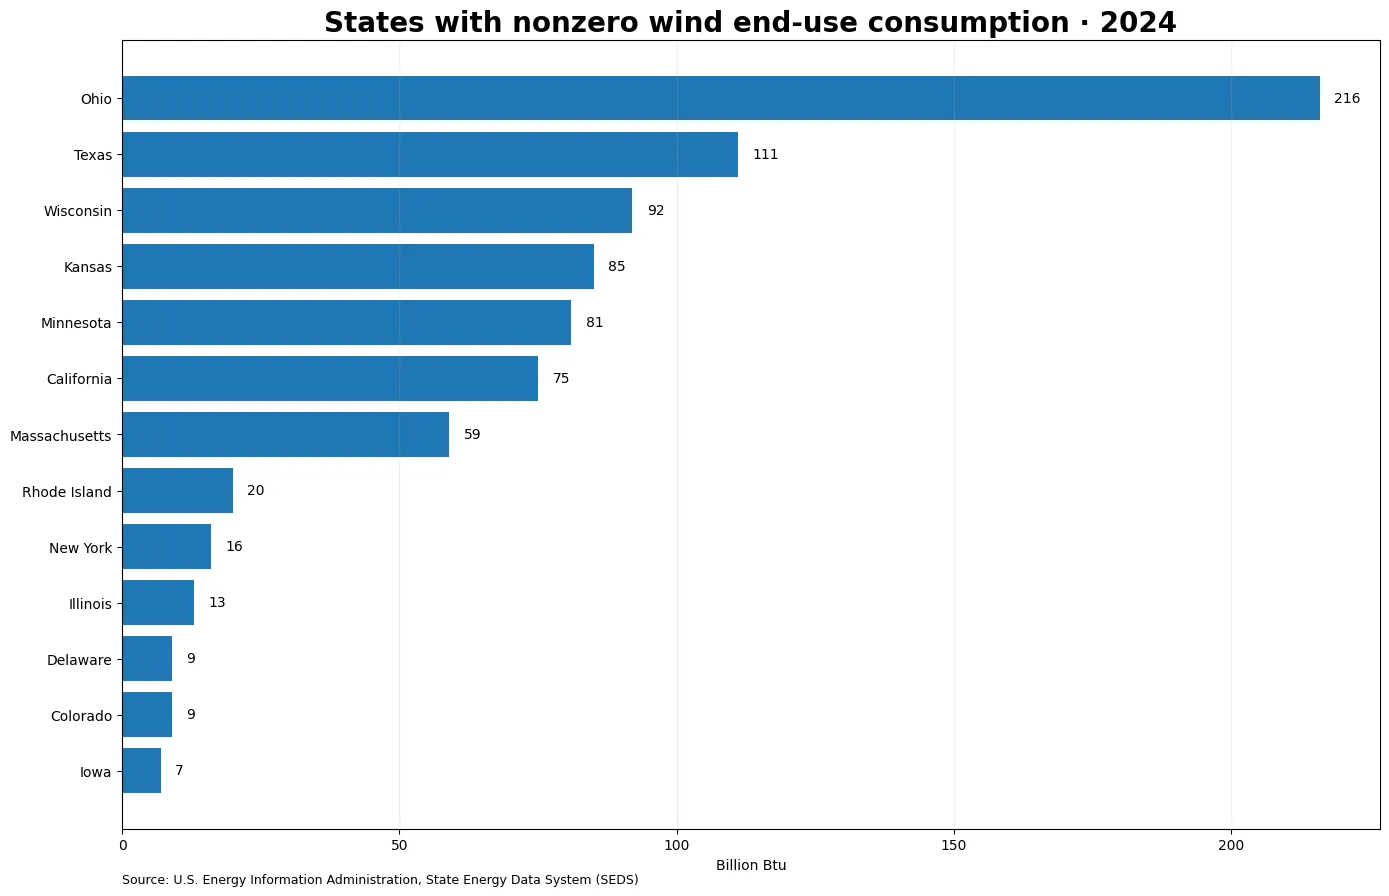
Restricting the chart to the 13 positive observations makes the internal spacing easier to see. Ohio is an outlier at the top, while Texas through California occupy a middle-high range between 75 and 111 billion Btu. Massachusetts is separated from that group, and the remaining six states are all at 20 billion Btu or less. These breaks are descriptive rather than categorical; the data do not assign the states to formal groups.
Why the many zeros are part of the story
38 of 51 jurisdictions, or about 74.5%, have a recorded zero in this series. That does not mean wind is unimportant in those states. The measure is too narrow for that conclusion. Anyone trying to compare wind generation should use an EIA net-generation series, while installed-capacity questions require capacity data. This article stays with the end-use consumption metric because mixing those concepts would produce misleading rankings.
The prevalence of zeros is still useful information. It shows that commercial and industrial wind end-use consumption, as captured by SEDS, is not a broadly positive state measure in 2024. Positive observations occur in only a quarter of the jurisdictions. That makes the metric useful for identifying where this specific kind of wind consumption appears in the state energy accounts and how unevenly it is distributed.
Complete 2024 state table
The table below lists all 51 jurisdictions in descending order. Every value is in billion Btu and refers to 2024. A zero is retained exactly as recorded in the source data; it is not a substitute for a missing observation. States with the same value are shown without suggesting that tiny differences exist where the dataset does not report them.
| Rank | State / jurisdiction | Code | Year | Billion Btu |
|---|---|---|---|---|
| 1 | Ohio | OH | 2024 | 216 |
| 2 | Texas | TX | 2024 | 111 |
| 3 | Wisconsin | WI | 2024 | 92 |
| 4 | Kansas | KS | 2024 | 85 |
| 5 | Minnesota | MN | 2024 | 81 |
| 6 | California | CA | 2024 | 75 |
| 7 | Massachusetts | MA | 2024 | 59 |
| 8 | Rhode Island | RI | 2024 | 20 |
| 9 | New York | NY | 2024 | 16 |
| 10 | Illinois | IL | 2024 | 13 |
| 11 | Colorado | CO | 2024 | 9 |
| 12 | Delaware | DE | 2024 | 9 |
| 13 | Iowa | IA | 2024 | 7 |
| 14 | Alabama | AL | 2024 | 0 |
| 15 | Alaska | AK | 2024 | 0 |
| 16 | Arizona | AZ | 2024 | 0 |
| 17 | Arkansas | AR | 2024 | 0 |
| 18 | Connecticut | CT | 2024 | 0 |
| 19 | District of Columbia | DC | 2024 | 0 |
| 20 | Florida | FL | 2024 | 0 |
| 21 | Georgia | GA | 2024 | 0 |
| 22 | Hawaii | HI | 2024 | 0 |
| 23 | Idaho | ID | 2024 | 0 |
| 24 | Indiana | IN | 2024 | 0 |
| 25 | Kentucky | KY | 2024 | 0 |
| 26 | Louisiana | LA | 2024 | 0 |
| 27 | Maine | ME | 2024 | 0 |
| 28 | Maryland | MD | 2024 | 0 |
| 29 | Michigan | MI | 2024 | 0 |
| 30 | Mississippi | MS | 2024 | 0 |
| 31 | Missouri | MO | 2024 | 0 |
| 32 | Montana | MT | 2024 | 0 |
| 33 | Nebraska | NE | 2024 | 0 |
| 34 | Nevada | NV | 2024 | 0 |
| 35 | New Hampshire | NH | 2024 | 0 |
| 36 | New Jersey | NJ | 2024 | 0 |
| 37 | New Mexico | NM | 2024 | 0 |
| 38 | North Carolina | NC | 2024 | 0 |
| 39 | North Dakota | ND | 2024 | 0 |
| 40 | Oklahoma | OK | 2024 | 0 |
| 41 | Oregon | OR | 2024 | 0 |
| 42 | Pennsylvania | PA | 2024 | 0 |
| 43 | South Carolina | SC | 2024 | 0 |
| 44 | South Dakota | SD | 2024 | 0 |
| 45 | Tennessee | TN | 2024 | 0 |
| 46 | Utah | UT | 2024 | 0 |
| 47 | Vermont | VT | 2024 | 0 |
| 48 | Virginia | VA | 2024 | 0 |
| 49 | Washington | WA | 2024 | 0 |
| 50 | West Virginia | WV | 2024 | 0 |
| 51 | Wyoming | WY | 2024 | 0 |
Do not substitute this ranking for wind generation data
Energy datasets often contain several wind series with very similar names. Wind total consumption, wind net generation, renewable energy consumption, electric-power-sector consumption, and end-use consumption answer different questions. The shared word “wind” does not make them interchangeable. For this reason, the title and tables here consistently retain the end-use concept instead of shortening the metric to “wind consumption” in places where that could create ambiguity.
Iowa is a useful example of why definitions matter. The state is widely associated with wind electricity, yet its value in this end-use series is only 7 billion Btu. That apparent contrast is not evidence of an error. It reflects the fact that electricity generation and direct end-use accounting are different SEDS series. To study generation, use the wind net-generation variables; to study the metric shown here, keep the commercial-plus-industrial end-use definition.
The observation year also needs to stay fixed. These are 2024 values. Combining them with another year could change the rank order and the number of positive observations. SEDS can revise historical estimates when its source data or methods are updated, so future comparisons should verify the same series name, unit, and year before treating a later extract as identical to this one.
Source and calculation notes
The source is the U.S. Energy Information Administration State Energy Data System (SEDS). The comparison uses one 2024 observation for each of the 50 states and the District of Columbia. Totals, shares, the mean, the median, and the counts of positive and zero observations are calculated directly from those 51 reported values. No missing-value imputation or unit conversion is used.
EIA’s SEDS variable appendix defines wind energy total end-use consumption as the sum of the commercial and industrial wind-consumption components, expressed in billion Btu. EIA also defines end-use energy consumption as energy consumed in end-use sectors, excluding electrical-system energy losses. Those definitions are why the analysis distinguishes the present series from wind generation and from broader electricity consumption.
The official references are the EIA State Energy Data System (SEDS) and the SEDS consumption-variable appendix. The figures here are absolute state totals, not per-capita or economy-adjusted measures. A per-person or intensity analysis would require a separate denominator and would answer a different question.
What the 2024 data say most clearly
The strongest finding is concentration. Only 13 of 51 jurisdictions have values above zero, Ohio leads at 216 billion Btu, and the top six states account for 83.2% of the 793-billion-Btu sum. The distribution is therefore dominated by a small set of states rather than a gradual national spread.
The second finding is interpretive: the series is specialized. It should be used to compare wind energy end-use consumption within the SEDS framework, not to rank the overall importance of wind power in each state. When the metric is kept in its proper scope, the table and maps provide a clear view of where positive values are recorded and how large the differences are.
Frequently Asked Questions
Which state had the highest wind energy total end-use consumption in 2024?
Ohio ranked first at 216 billion Btu in the 2024 EIA SEDS state data, followed by Texas at 111 billion Btu.
Is this the same as state wind generation?
No. The EIA SEDS series is wind energy total end-use consumption and is defined from commercial- and industrial-sector wind consumption. Wind net generation is a separate measure.
Does a zero mean a state had no wind power?
No. It means the 2024 value for this specific SEDS end-use series is recorded as zero. It does not describe all wind generation or all electricity associated with wind.
How concentrated was the 2024 distribution?
The 51-jurisdiction sum was 793 billion Btu, and the top six states accounted for 83.2% of it. Only 13 jurisdictions had values above zero.
Related Articles
Green Map creates custom-edited map images using open geographic data sources such as geoBoundaries, Natural Earth, OpenStreetMap, and government open data. These maps are edited visual materials, not raw data files, and are provided for education, documents, presentations, and graphic reference.