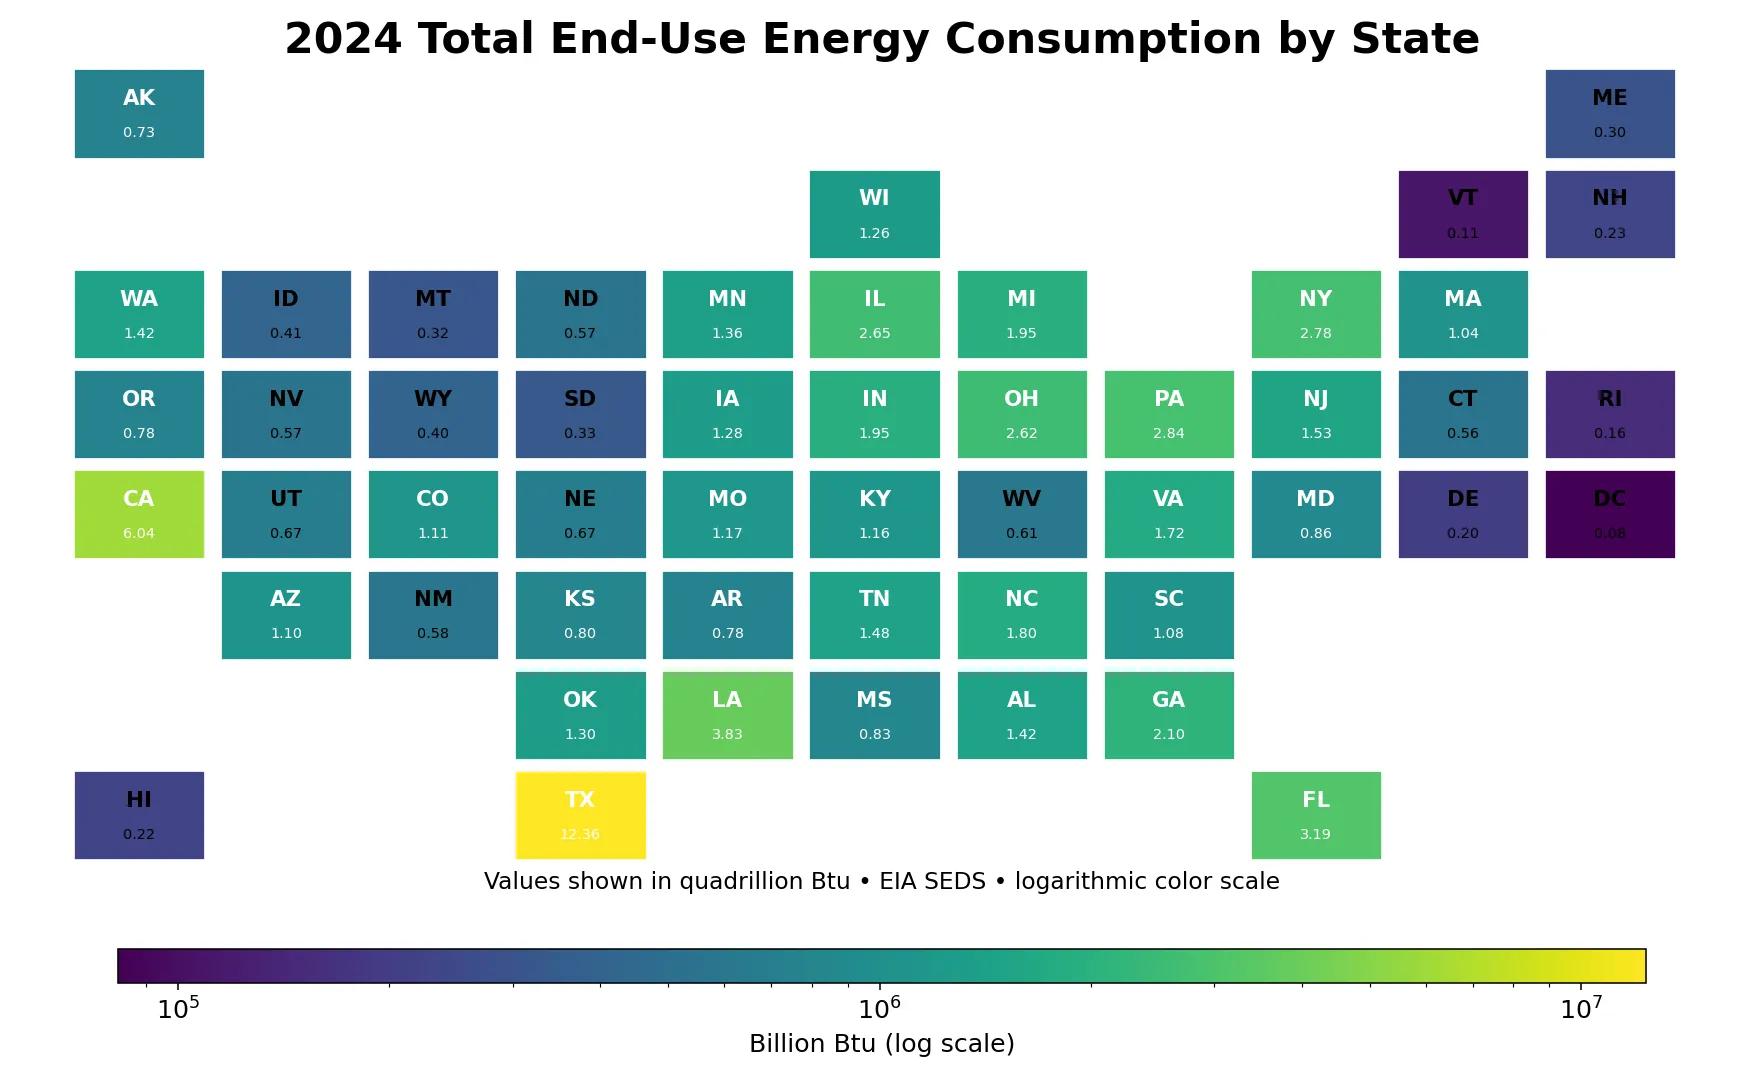
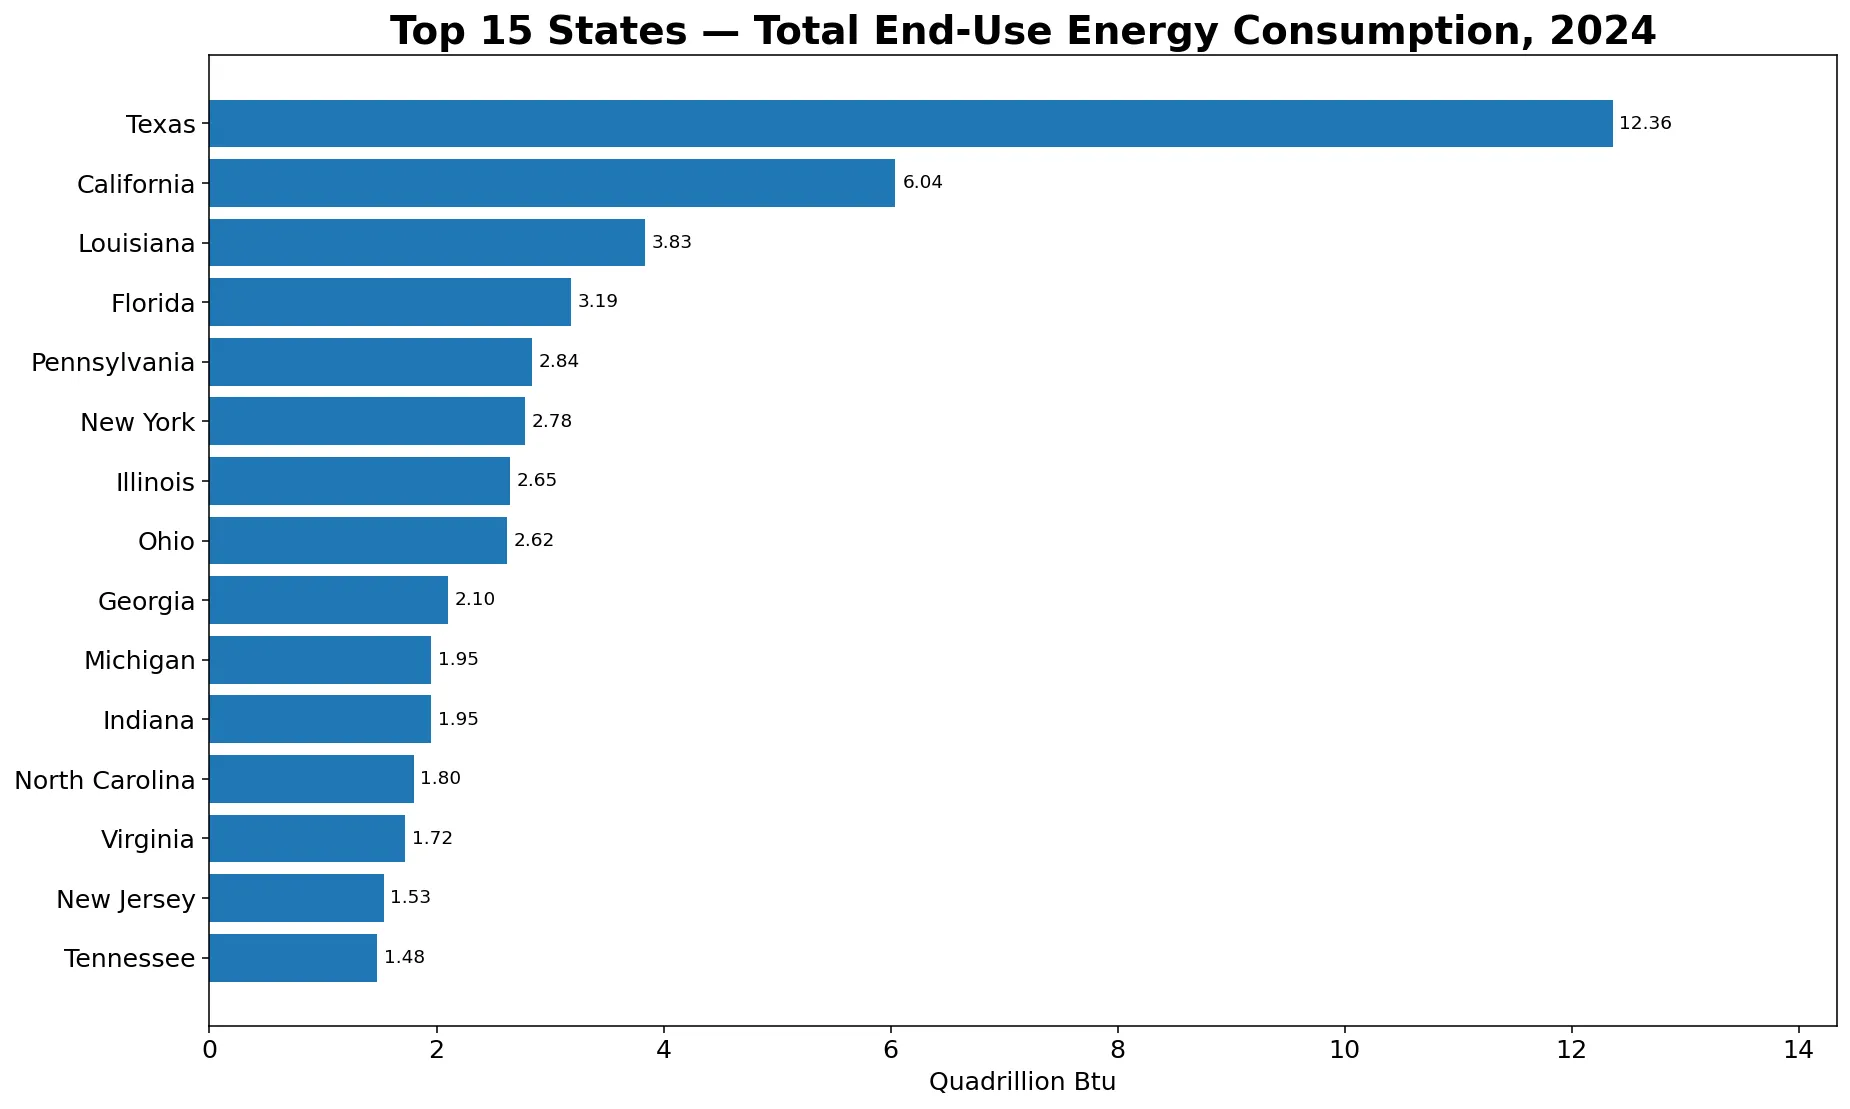
End-use energy consumption across the 50 states and District of Columbia was highly uneven in 2024. Texas recorded 12,359,092 billion Btu, or about 12.36 quadrillion Btu, and accounted for 16.4% of the 51-jurisdiction total. California ranked second at 6.04 quadrillion Btu. Texas used about 2.05 times as much end-use energy as California. The measure is designed to describe energy reaching the four end-use sectors rather than the broader total that also reflects electrical system losses.
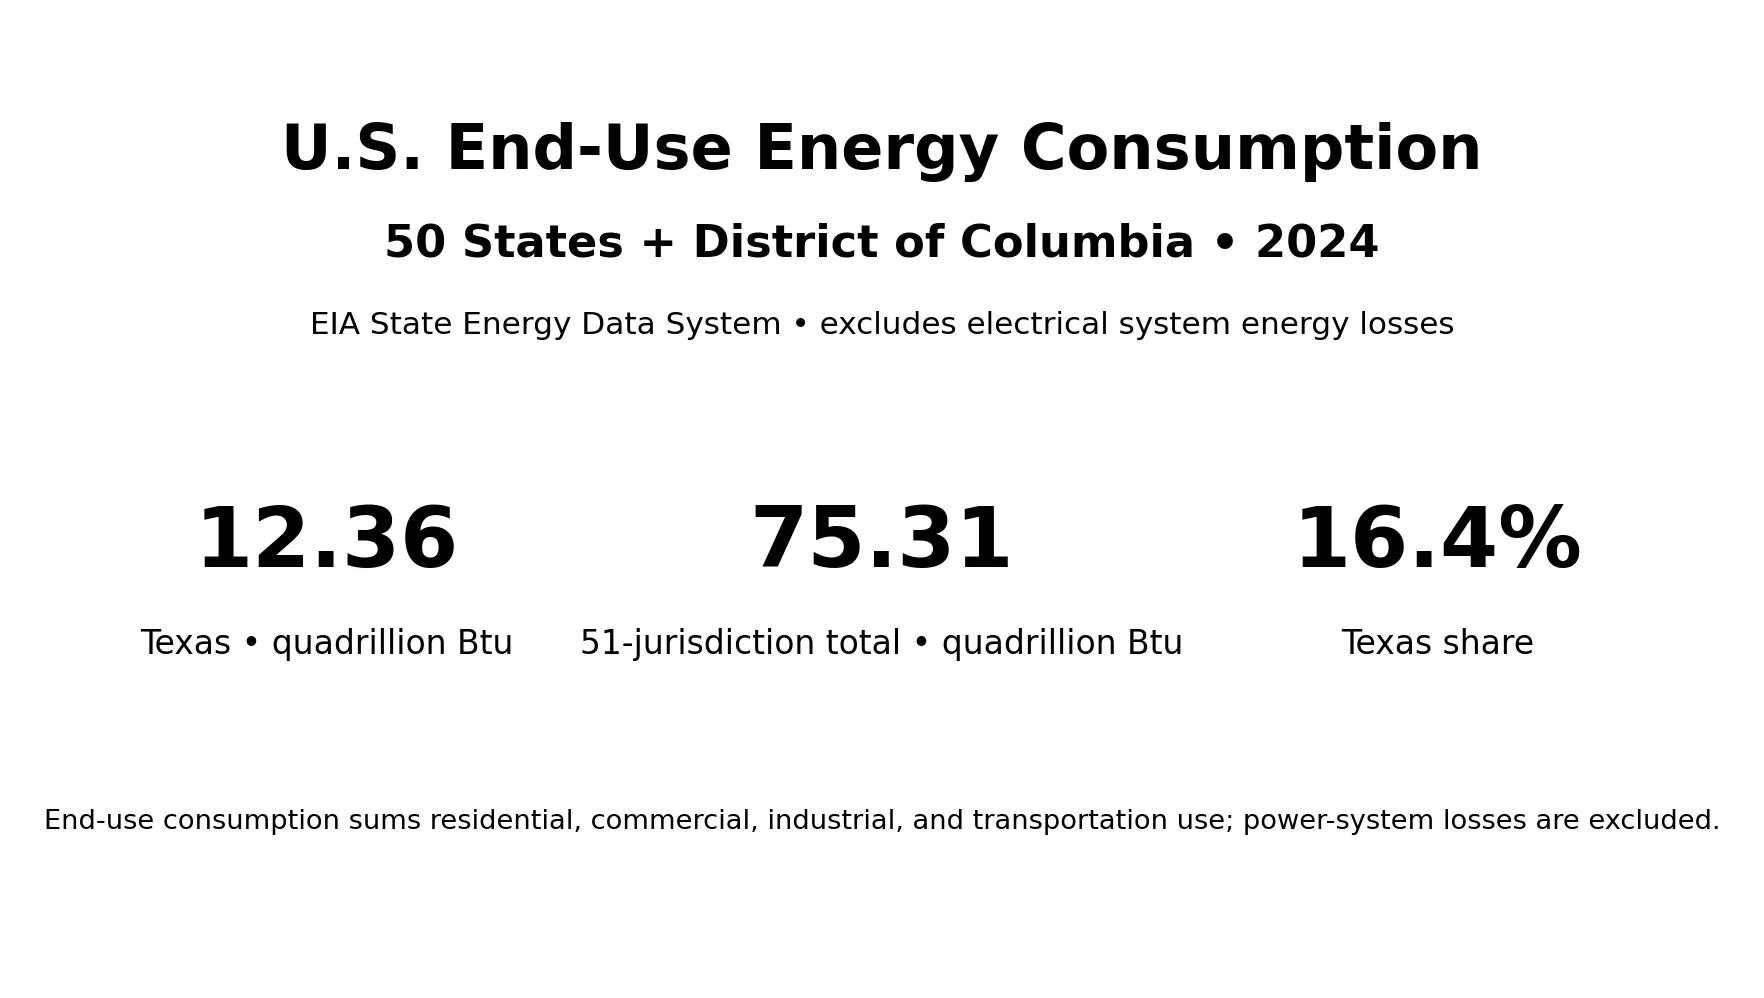
Table of Contents
The first pattern to notice in the 2024 distribution
The 51-jurisdiction total was 75,313,508 billion Btu, equal to about 75.31 quadrillion Btu. The arithmetic mean was 1.48 quadrillion Btu per jurisdiction, while the median was only 1.08. That gap is a useful warning: a small group of very large states pulls the average upward, so the mean alone is not a good description of a typical state.
9 states consumed at least 2 quadrillion Btu, while 11 jurisdictions were below 0.5 quadrillion Btu. District of Columbia was the smallest at 0.082 quadrillion Btu, followed by Vermont, Rhode Island, and Delaware. The spread cannot be explained by population alone. Industrial structure, freight and passenger transportation, building energy needs, climate, and the scale of commercial activity can all influence absolute consumption.
Why Texas is so far above the rest
Texas reached 12.36 quadrillion Btu, roughly 6.32 quadrillion Btu more than California. Its 16.4% share is large for a single state, but it should not be read as an efficiency score. An absolute total combines the effects of population, economic scale, energy-intensive industries, transportation activity, and weather-sensitive demand.
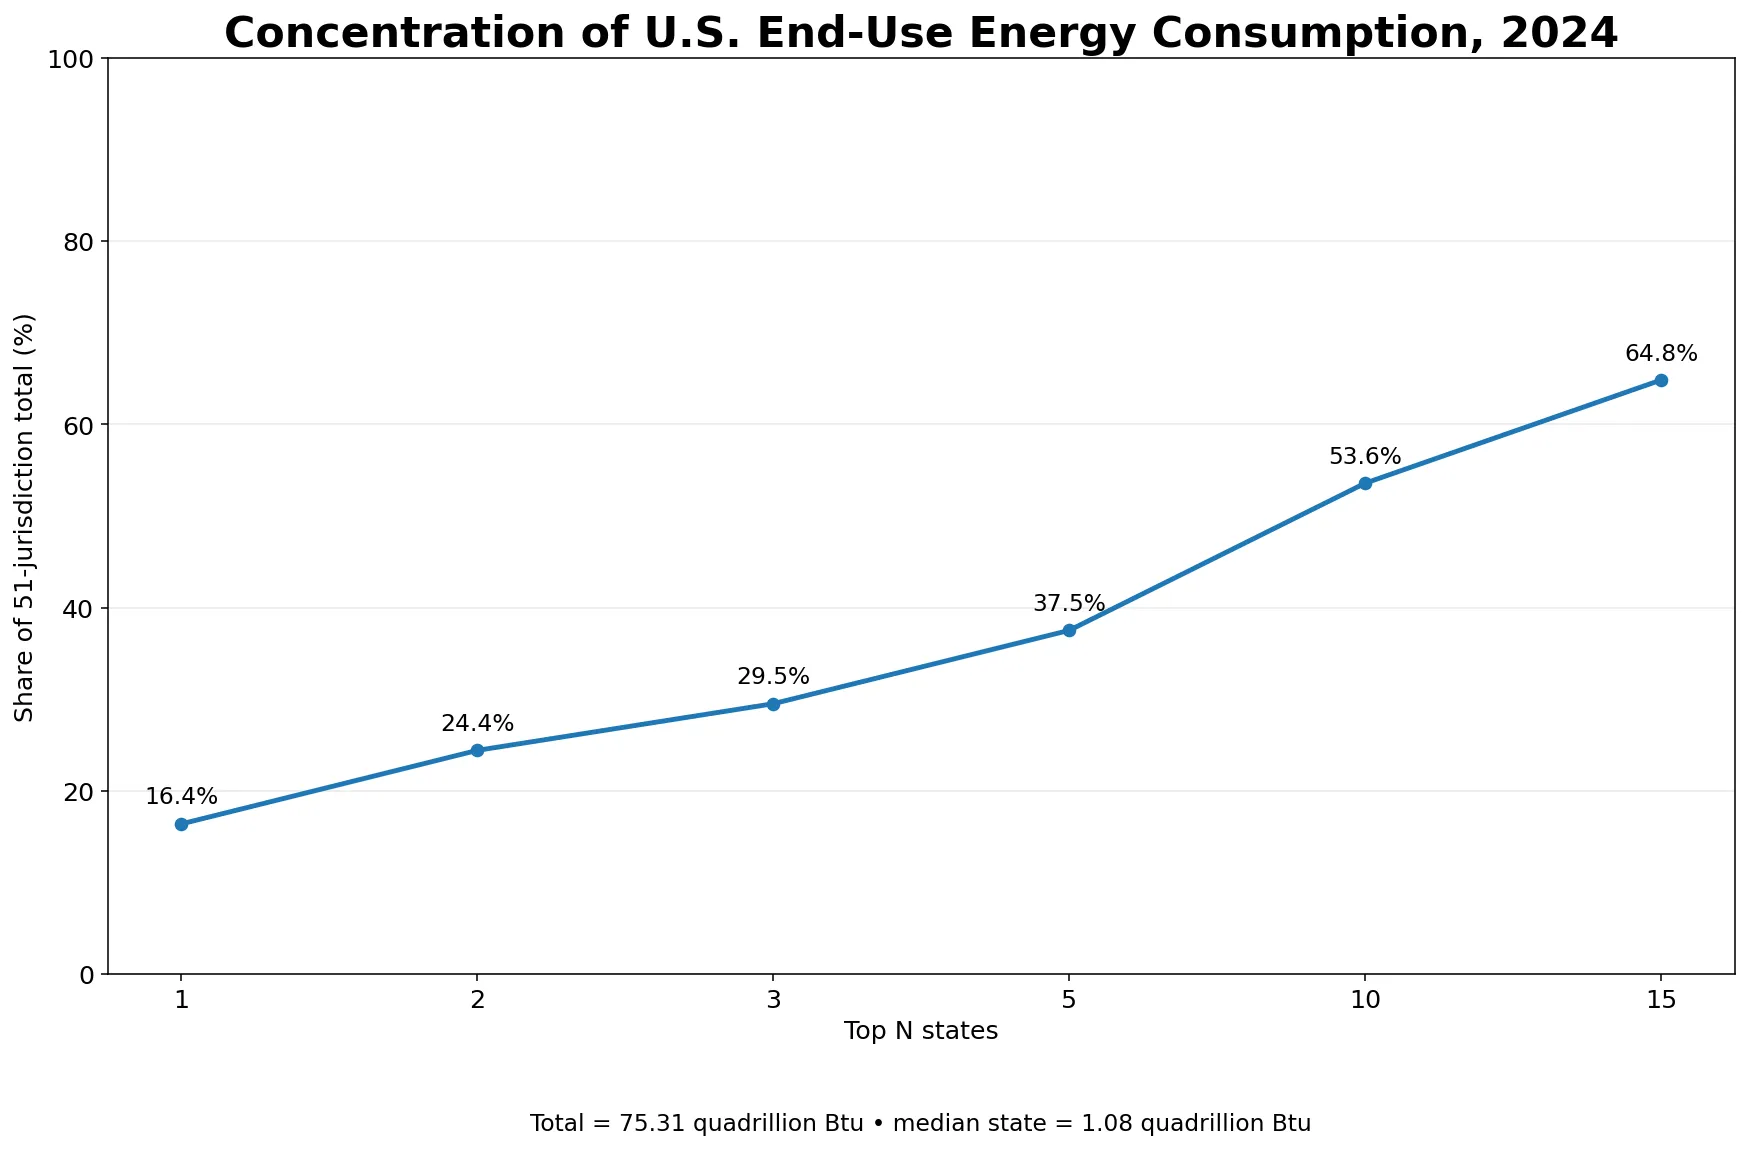
The next states in the ranking are California, Louisiana, Florida, and Pennsylvania. Together, the top five account for 37.5% of the 51-jurisdiction total, and the top ten account for 53.6%. That means just over half of U.S. end-use energy consumption in this state comparison is concentrated in ten states. The pattern is concentrated, but it is not a one-state system; several large centers contribute meaningfully.
Louisiana is a good example of why population is not the only driver. Its place near the top reflects the fact that industrial energy use is part of the end-use total. States with large refining, petrochemical, manufacturing, or other energy-intensive activity can rank higher than population alone would suggest. By the same logic, a populous state can rank lower if its industrial mix and transportation profile are less energy intensive.
End use is not the same as broader total energy consumption
This distinction is central to the article. End-use energy consumption sums energy used by residential, commercial, industrial, and transportation customers. It includes electricity sold to ultimate customers, but it excludes electrical system energy losses associated with producing and delivering that electricity. A broader total-energy measure can therefore be higher for the same state.
Separating losses makes the end-use series useful for studying demand at the point where households, businesses, factories, and transportation systems consume energy. It is not a measure of the entire energy conversion chain. If the research question is about power-plant efficiency, transmission losses, or the full primary-energy requirement needed to serve customers, the broader total-energy series is more appropriate.
How concentrated is state-level end-use demand?
The concentration curve rises from 16.4% for the largest state to 24.4% for the top two, 29.5% for the top three, and 37.5% for the top five. The top fifteen reach 64.8% of the 51-jurisdiction total. These shares show that a substantial portion of national end-use demand sits in a relatively small group of states, even though the remainder is still widely distributed.
Concentration is descriptive, not evaluative. A large total may reflect a large economy, a large population, extensive freight movement, heavy industry, climate-related heating or cooling demand, or a combination of these factors. A small total may simply reflect a small population or limited industrial scale. To compare efficiency, a denominator such as population, real GDP, floor area, vehicle miles, or industrial output is needed.
What an absolute ranking can and cannot tell you
First, the ranking compares totals rather than rates. It does not adjust for population or economic size. Second, it is a single-year snapshot, so it cannot by itself show whether a state is becoming more or less energy intensive over time. Third, states can arrive at similar totals through very different sector mixes: one may be industry-heavy, another transportation-heavy, and another dominated by buildings.
Fourth, electricity appears as energy sold to final customers, while the upstream energy losses associated with producing and delivering electricity are intentionally excluded. That makes the measure internally useful for end-use comparisons but unsuitable for adding directly to separate generation-input totals without careful attention to definitions. Sector and fuel tables from SEDS are the next step when a more detailed explanation is needed.
Complete 2024 ranking for all 51 jurisdictions
The table below orders all 50 states and District of Columbia from highest to lowest. The official unit is billion Btu. A quadrillion-Btu conversion is added only to make the largest values easier to read. Because this is an absolute total, the order will differ from rankings based on energy use per person, energy intensity, or sector-specific demand.
| Rank | State or jurisdiction | Code | Year | Billion Btu | Quadrillion Btu |
|---|---|---|---|---|---|
| 1 | Texas | TX | 2024 | 12,359,092 | 12.359 |
| 2 | California | CA | 2024 | 6,042,646 | 6.043 |
| 3 | Louisiana | LA | 2024 | 3,832,999 | 3.833 |
| 4 | Florida | FL | 2024 | 3,186,936 | 3.187 |
| 5 | Pennsylvania | PA | 2024 | 2,841,049 | 2.841 |
| 6 | New York | NY | 2024 | 2,775,404 | 2.775 |
| 7 | Illinois | IL | 2024 | 2,646,323 | 2.646 |
| 8 | Ohio | OH | 2024 | 2,620,035 | 2.620 |
| 9 | Georgia | GA | 2024 | 2,101,143 | 2.101 |
| 10 | Michigan | MI | 2024 | 1,953,322 | 1.953 |
| 11 | Indiana | IN | 2024 | 1,950,097 | 1.950 |
| 12 | North Carolina | NC | 2024 | 1,798,748 | 1.799 |
| 13 | Virginia | VA | 2024 | 1,721,822 | 1.722 |
| 14 | New Jersey | NJ | 2024 | 1,533,821 | 1.534 |
| 15 | Tennessee | TN | 2024 | 1,475,851 | 1.476 |
| 16 | Alabama | AL | 2024 | 1,423,882 | 1.424 |
| 17 | Washington | WA | 2024 | 1,418,662 | 1.419 |
| 18 | Minnesota | MN | 2024 | 1,358,191 | 1.358 |
| 19 | Oklahoma | OK | 2024 | 1,296,189 | 1.296 |
| 20 | Iowa | IA | 2024 | 1,279,289 | 1.279 |
| 21 | Wisconsin | WI | 2024 | 1,257,415 | 1.257 |
| 22 | Missouri | MO | 2024 | 1,170,283 | 1.170 |
| 23 | Kentucky | KY | 2024 | 1,155,228 | 1.155 |
| 24 | Colorado | CO | 2024 | 1,114,914 | 1.115 |
| 25 | Arizona | AZ | 2024 | 1,102,708 | 1.103 |
| 26 | South Carolina | SC | 2024 | 1,084,751 | 1.085 |
| 27 | Massachusetts | MA | 2024 | 1,042,687 | 1.043 |
| 28 | Maryland | MD | 2024 | 859,543 | 0.860 |
| 29 | Mississippi | MS | 2024 | 833,611 | 0.834 |
| 30 | Kansas | KS | 2024 | 799,829 | 0.800 |
| 31 | Oregon | OR | 2024 | 778,449 | 0.778 |
| 32 | Arkansas | AR | 2024 | 775,610 | 0.776 |
| 33 | Alaska | AK | 2024 | 731,851 | 0.732 |
| 34 | Nebraska | NE | 2024 | 670,068 | 0.670 |
| 35 | Utah | UT | 2024 | 669,163 | 0.669 |
| 36 | West Virginia | WV | 2024 | 610,241 | 0.610 |
| 37 | New Mexico | NM | 2024 | 583,925 | 0.584 |
| 38 | Nevada | NV | 2024 | 567,005 | 0.567 |
| 39 | North Dakota | ND | 2024 | 565,552 | 0.566 |
| 40 | Connecticut | CT | 2024 | 564,309 | 0.564 |
| 41 | Idaho | ID | 2024 | 411,652 | 0.412 |
| 42 | Wyoming | WY | 2024 | 402,930 | 0.403 |
| 43 | South Dakota | SD | 2024 | 327,736 | 0.328 |
| 44 | Montana | MT | 2024 | 315,342 | 0.315 |
| 45 | Maine | ME | 2024 | 297,504 | 0.298 |
| 46 | New Hampshire | NH | 2024 | 232,558 | 0.233 |
| 47 | Hawaii | HI | 2024 | 223,877 | 0.224 |
| 48 | Delaware | DE | 2024 | 201,273 | 0.201 |
| 49 | Rhode Island | RI | 2024 | 155,392 | 0.155 |
| 50 | Vermont | VT | 2024 | 110,424 | 0.110 |
| 51 | District of Columbia | DC | 2024 | 82,177 | 0.082 |
The most useful way to extend this comparison
A productive analysis starts with the absolute total to identify where energy demand is largest. It can then add per-capita consumption to control for population, energy use per unit of real GDP to examine energy intensity, and sector-specific data to determine whether residential, commercial, industrial, or transportation activity is driving the total. Those follow-up measures answer different questions and should not be substituted for one another.
Fuel-specific data provide another layer. Coal, natural gas, petroleum products, renewable energy, and electricity sales each have different geographic patterns. The end-use total is therefore best treated as a high-level summary of demand, not a statement about fuel mix, prices, emissions, or efficiency. Combining it with the relevant denominator and sector breakdown produces a much more informative state comparison.
What EIA means by end-use energy consumption
The U.S. Energy Information Administration State Energy Data System defines end-use energy consumption as the sum of energy consumed in the residential, commercial, industrial, and transportation sectors. The measure includes primary energy used directly within those sectors and electricity sold to ultimate customers. It excludes each sector’s allocated share of electrical system energy losses from generation, transmission, and distribution. That distinction matters because a broader total-energy figure for the same state can be higher.
EIA’s 2024 Table C4 presents end use and electrical system energy losses separately, while Table C11 ranks states by energy consumption across the four end-use sectors. Official references: SEDS 2024 Total Energy Technical Notes, Table C4, and Table C11.
Frequently Asked Questions
Which state had the highest end-use energy consumption in 2024?
Texas ranked first at 12,359,092 billion Btu, about 16.4% of the 51-jurisdiction total.
Does end-use energy consumption include electrical system losses?
No. EIA SEDS sums residential, commercial, industrial, and transportation end-use consumption but excludes electrical system energy losses from generation, transmission, and distribution.
Does a high state total mean low energy efficiency?
Not necessarily. Absolute consumption is influenced by population, economic scale, industrial structure, transportation, and climate. Efficiency comparisons require a denominator such as population or real GDP.
What was the combined 2024 total for the 50 states and D.C.?
The combined total was 75,313,508 billion Btu, or about 75.31 quadrillion Btu.
Related Articles
Green Map creates custom-edited map images using open geographic data sources such as geoBoundaries, Natural Earth, OpenStreetMap, and government open data. These maps are edited visual materials, not raw data files, and are provided for education, documents, presentations, and graphic reference.