The real interest rate adjusts lending rates for inflation and provides a view of borrowing costs after changes in the price level. The World Bank series contains 148 latest non-empty observations, of which 67 are dated 2025 and 20 are from 2024. Because many other observations are older, the same-year 2025 comparison is separated from the full latest-observation list.
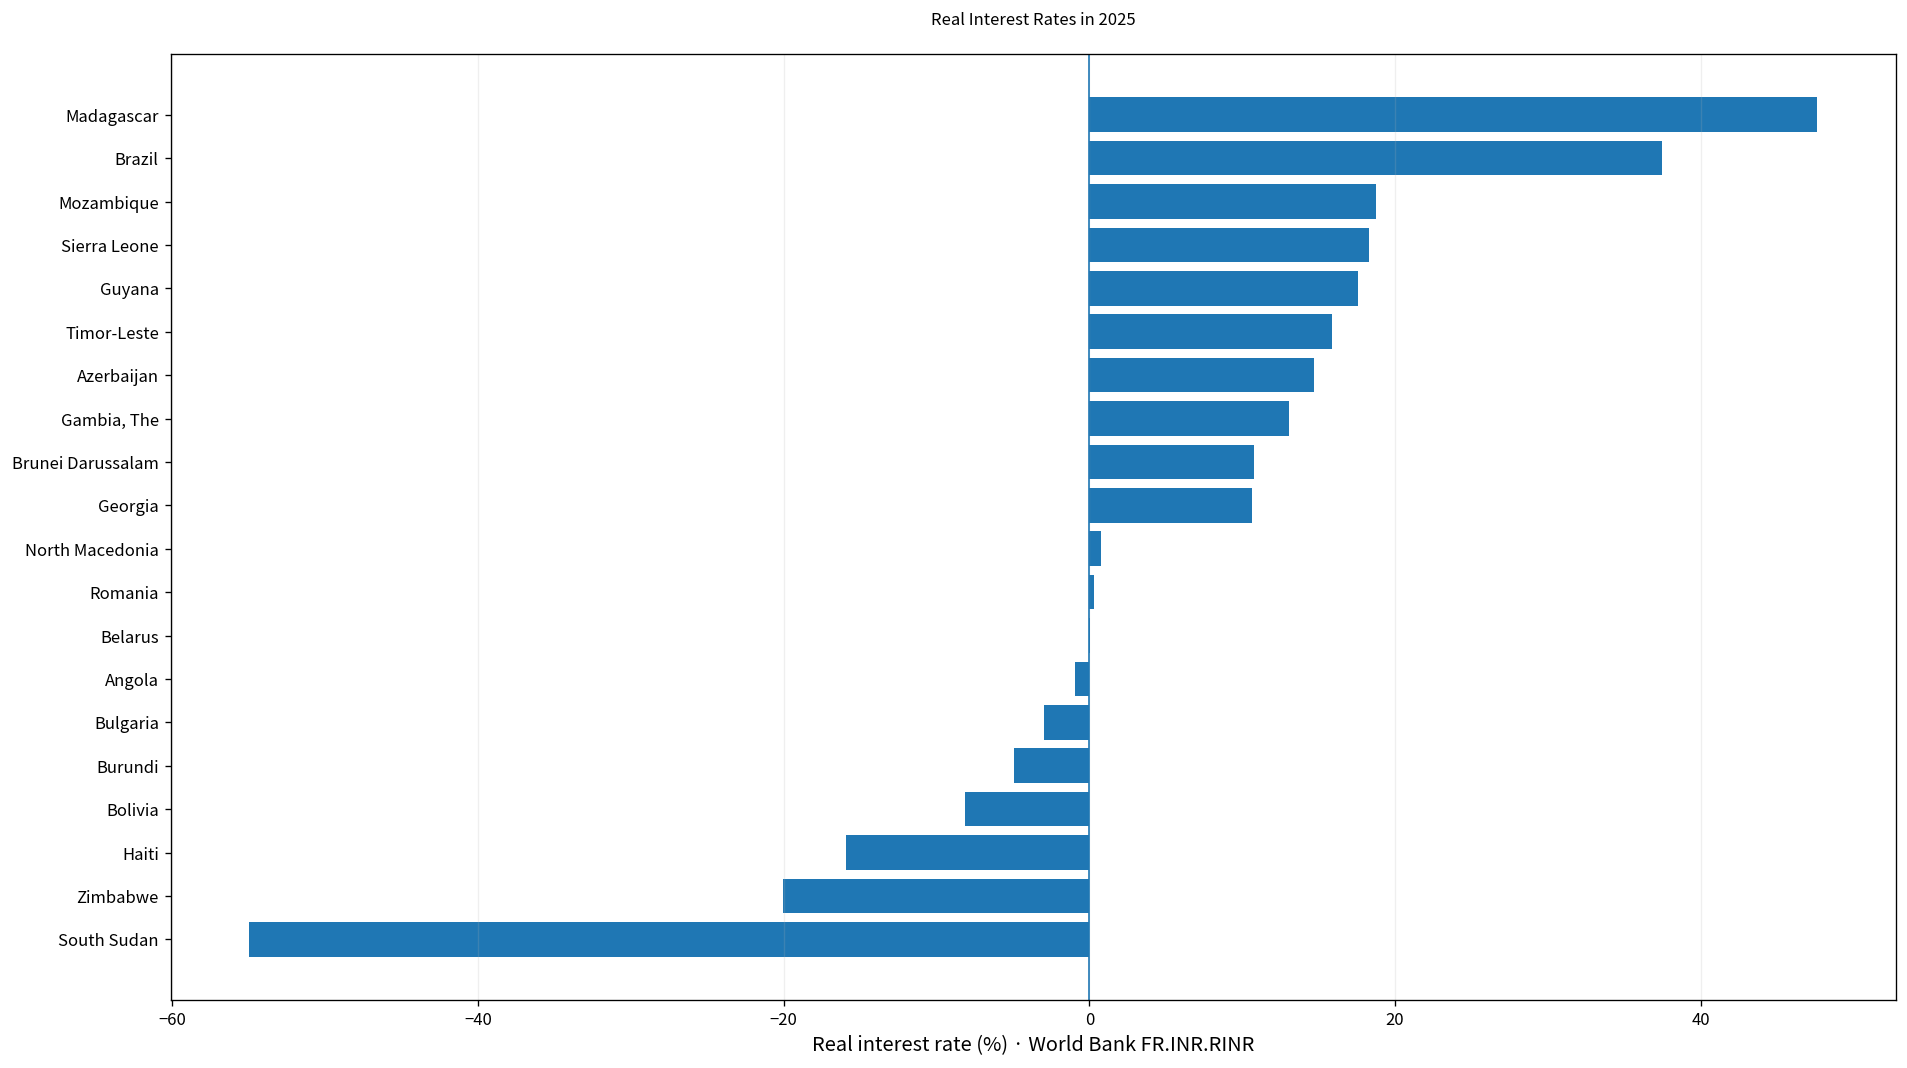
Table of Contents
What the real interest rate means
World Bank documentation defines the real interest rate as the lending interest rate adjusted for inflation as measured by the GDP deflator. A nominal lending rate can therefore translate into a very different real rate depending on inflation. The measure is expressed as a percentage.
A real rate of 5% does not mean the nominal lending rate is 5%. It means the lending rate remains about five percentage points positive after the inflation adjustment embedded in this indicator. Cross-country comparability is limited because lending terms and conditions differ by country, including maturity, borrower risk, collateral, and market structure.
The 148 latest observations span 1988 to 2025
Among the 148 latest observations, 67 are from 2025 and 20 from 2024. There are 4 observations from 2023, 6 from 2022, and many others from earlier years. The oldest latest observation is from 1988.
| Observation year | Economies/territories | Share of 148 |
|---|---|---|
| 2025 | 67 | 45.3% |
| 2024 | 20 | 13.5% |
| 2023 | 4 | 2.7% |
| 2022 | 6 | 4.1% |
| 2021 | 12 | 8.1% |
| 2020 | 3 | 2.0% |
| 2019 | 5 | 3.4% |
| 2018 | 3 | 2.0% |
| 2017 | 7 | 4.7% |
| 2016 | 7 | 4.7% |
| 2015 | 2 | 1.4% |
| 2014 | 3 | 2.0% |
| 2013 | 3 | 2.0% |
| 2010 | 2 | 1.4% |
| 2008 | 1 | 0.7% |
| 2006 | 1 | 0.7% |
| 2001 | 1 | 0.7% |
| 1988 | 1 | 0.7% |
The mixed-year set has a mean of 4.36% and a median of 4.73%, with a range from -89.47% to 57.63%. Because very old and recent observations appear together, these figures should not be interpreted as a current global real-interest-rate average.
The 2025 mean is 4.99% and the median is 4.89%
The 2025 subset contains 67 economies. The mean is 4.99% and the median 4.89%. The first quartile is 2.00% and the third quartile 8.12%, so the middle half of the observations lies roughly between 2% and 8%.
60 observations are positive and 7 are negative, with no exact zeros. 11 economies are at or above 10%, 2 are at or above 20%, and 3 are at or below -10%. The center is moderate, but the tails are wide.
Madagascar is highest in 2025 at 47.63%
Madagascar records 47.63%, followed by Brazil at 37.46%, Mozambique at 18.75%, Sierra Leone at 18.27%, Guyana at 17.56%, Timor-Leste at 15.85%, Azerbaijan at 14.68%, and Gambia, The at 13.08%. Brunei Darussalam, Georgia, and Kuwait also exceed 10%.
| 2025 rank | Economy/territory | Real interest rate |
|---|---|---|
| 1 | Madagascar | 47.63% |
| 2 | Brazil | 37.46% |
| 3 | Mozambique | 18.75% |
| 4 | Sierra Leone | 18.27% |
| 5 | Guyana | 17.56% |
| 6 | Timor-Leste | 15.85% |
| 7 | Azerbaijan | 14.68% |
| 8 | Gambia, The | 13.08% |
| 9 | Brunei Darussalam | 10.75% |
| 10 | Georgia | 10.66% |
| 11 | Kuwait | 10.52% |
| 12 | Armenia | 9.86% |
| 13 | Honduras | 9.78% |
| 14 | Guatemala | 9.16% |
| 15 | Colombia | 8.43% |
A high real rate means the lending rate remains high after the inflation adjustment used by the indicator. It does not automatically mean that monetary policy is highly restrictive. This measure is based on lending rates rather than a central-bank policy rate, so bank pricing, credit risk, and inflation all matter.
South Sudan is lowest in 2025 at -55.00%
South Sudan records -55.00%, followed by Zimbabwe at -20.07%, Haiti at -15.91%, Bolivia at -8.11%, Burundi at -4.95%, Bulgaria at -2.96%, and Angola at -0.93%. These are the seven negative observations in the 2025 subset.
| Low-order position in 2025 | Economy/territory | Real interest rate |
|---|---|---|
| 1 | South Sudan | -55.00% |
| 2 | Zimbabwe | -20.07% |
| 3 | Haiti | -15.91% |
| 4 | Bolivia | -8.11% |
| 5 | Burundi | -4.95% |
| 6 | Bulgaria | -2.96% |
| 7 | Angola | -0.93% |
| 8 | Belarus | 0.03% |
| 9 | Romania | 0.29% |
| 10 | North Macedonia | 0.75% |
| 11 | Korea, Rep. | 1.03% |
| 12 | Czechia | 1.12% |
| 13 | Bosnia and Herzegovina | 1.17% |
| 14 | Suriname | 1.33% |
| 15 | Nicaragua | 1.44% |
A negative real rate means the inflation adjustment is large enough to push the lending rate below zero in real terms. It does not mean borrowing is costless or easy. Fees, borrower risk, credit access, exchange-rate conditions, and market instability can still make financing expensive.
The 2025 center and the extremes tell different stories
The median of 4.89% and the interquartile range from 2.00% to 8.12% show that most observations are relatively moderate. By contrast, the maximum of 47.63% and minimum of -55.00% sit far from the center.
Very high or very negative real rates can result from unusual combinations of lending rates and inflation. One-year values should therefore be interpreted alongside nominal lending rates and the GDP deflator rather than treated as stable structural borrowing costs.
Why 2024 and 2025 should not be merged into one ranking
The 2024 subset contains 20 observations, with a mean of 5.57% and a median of 5.49%. Its range runs from -7.03% to 13.02%. Egypt, Arab Rep. records -7.03% in 2024, but it belongs to a different inflation and lending-rate environment and is not included in the 2025 ranking.
Real interest rates are especially sensitive to timing because both lending rates and inflation can change quickly. A one-year difference can materially alter the real-rate calculation.
Real interest rates are not central-bank policy rates
A policy rate is set or guided by the central bank as part of monetary-policy operations. The World Bank real-interest-rate indicator instead starts from lending rates in the financial system and adjusts them for inflation. Policy rates influence lending conditions, but the two measures are not interchangeable.
A fuller financial-conditions assessment should consider policy rates, government yields, deposit and lending rates, inflation, credit growth, and bank risk premiums. Real lending rates add useful information but do not summarize the entire monetary environment.
Complete list of the 148 latest observations
The table below lists the latest non-empty observation for every economy and territory in alphabetical order. Rows not dated 2025 retain their original year. For a strict same-year comparison, use only the 2025 observations.
| Economy/territory | Observation year | Real interest rate |
|---|---|---|
| Afghanistan | 2017 | 12.14% |
| Albania | 2024 | 4.00% |
| Algeria | 2025 | 7.16% |
| Angola | 2025 | -0.93% |
| Antigua and Barbuda | 2025 | 3.31% |
| Argentina | 2025 | 4.98% |
| Armenia | 2025 | 9.86% |
| Aruba | 2023 | 2.88% |
| Australia | 2019 | 1.57% |
| Azerbaijan | 2025 | 14.68% |
| Bahamas, The | 2024 | 3.95% |
| Bahrain | 2015 | 15.25% |
| Bangladesh | 2025 | 1.97% |
| Barbados | 2022 | 8.22% |
| Belarus | 2025 | 0.03% |
| Belize | 2025 | 7.34% |
| Benin | 2021 | 4.56% |
| Bhutan | 2025 | 8.34% |
| Bolivia | 2025 | -8.11% |
| Bosnia and Herzegovina | 2025 | 1.17% |
| Botswana | 2024 | 4.24% |
| Brazil | 2025 | 37.46% |
| Brunei Darussalam | 2025 | 10.75% |
| Bulgaria | 2025 | -2.96% |
| Burkina Faso | 2021 | 6.13% |
| Burundi | 2025 | -4.95% |
| Cabo Verde | 2025 | 5.90% |
| Canada | 2017 | 0.13% |
| Chile | 2018 | 2.55% |
| China | 2024 | 5.15% |
| Colombia | 2025 | 8.43% |
| Comoros | 2022 | 0.05% |
| Congo, Dem. Rep. | 2021 | -3.53% |
| Costa Rica | 2025 | 7.45% |
| Cote d’Ivoire | 2016 | 6.55% |
| Croatia | 2014 | 8.44% |
| Czechia | 2025 | 1.12% |
| Dominica | 2025 | 3.73% |
| Dominican Republic | 2024 | 10.53% |
| Egypt, Arab Rep. | 2024 | -7.03% |
| Eswatini | 2024 | 9.45% |
| Ethiopia | 2008 | -17.12% |
| Fiji | 2024 | -1.45% |
| Gambia, The | 2025 | 13.08% |
| Georgia | 2025 | 10.66% |
| Grenada | 2025 | 6.16% |
| Guatemala | 2025 | 9.16% |
| Guinea | 2001 | 10.93% |
| Guinea-Bissau | 2016 | 2.51% |
| Guyana | 2025 | 17.56% |
| Haiti | 2025 | -15.91% |
| Honduras | 2025 | 9.78% |
| Hong Kong SAR, China | 2025 | 4.11% |
| Hungary | 2025 | 1.64% |
| Iceland | 2025 | 3.87% |
| India | 2022 | 5.56% |
| Indonesia | 2025 | 5.99% |
| Iran, Islamic Rep. | 2016 | 3.45% |
| Iraq | 2015 | 57.63% |
| Israel | 2022 | -1.81% |
| Italy | 2025 | 2.04% |
| Jamaica | 2025 | 7.00% |
| Japan | 2017 | 0.97% |
| Jordan | 2025 | 5.75% |
| Kenya | 2024 | 13.02% |
| Korea, Rep. | 2025 | 1.03% |
| Kosovo | 2018 | 5.08% |
| Kuwait | 2025 | 10.52% |
| Kyrgyz Republic | 2024 | 12.58% |
| Lao PDR | 2010 | 12.29% |
| Lebanon | 2019 | 6.17% |
| Lesotho | 2024 | 4.92% |
| Liberia | 2017 | 16.29% |
| Libya | 2014 | 7.08% |
| Macao SAR, China | 2025 | 4.97% |
| Madagascar | 2025 | 47.63% |
| Malawi | 2024 | 9.96% |
| Malaysia | 2025 | 5.30% |
| Maldives | 2025 | 8.07% |
| Mali | 2016 | 3.64% |
| Malta | 2013 | 2.40% |
| Mauritania | 2017 | 15.18% |
| Mauritius | 2025 | 4.89% |
| Mexico | 2025 | 3.97% |
| Micronesia, Fed. Sts. | 2021 | 10.57% |
| Moldova | 2025 | 2.28% |
| Mongolia | 2021 | 1.39% |
| Montenegro | 2025 | 2.20% |
| Mozambique | 2025 | 18.75% |
| Myanmar | 2020 | 9.01% |
| Namibia | 2024 | 6.38% |
| Netherlands | 2013 | 0.35% |
| New Zealand | 2017 | 1.07% |
| Nicaragua | 2025 | 1.44% |
| Niger | 2016 | 2.58% |
| Nigeria | 2023 | 2.87% |
| North Macedonia | 2025 | 0.75% |
| Norway | 2025 | 4.40% |
| Oman | 2021 | -5.92% |
| Pakistan | 2021 | -1.45% |
| Panama | 2022 | 4.61% |
| Papua New Guinea | 2024 | 4.86% |
| Paraguay | 2021 | 3.76% |
| Peru | 2022 | 7.74% |
| Philippines | 2019 | 6.35% |
| Qatar | 2025 | 8.16% |
| Romania | 2025 | 0.29% |
| Russian Federation | 2024 | 5.82% |
| Rwanda | 2024 | 7.28% |
| Samoa | 2025 | 2.09% |
| San Marino | 2023 | -1.60% |
| Sao Tome and Principe | 2024 | 0.15% |
| Senegal | 2016 | 4.30% |
| Serbia | 2010 | -0.18% |
| Seychelles | 2025 | 7.07% |
| Sierra Leone | 2025 | 18.27% |
| Singapore | 2021 | -5.21% |
| Solomon Islands | 2021 | 5.80% |
| Somalia, Fed. Rep. | 1988 | -18.46% |
| South Africa | 2025 | 7.68% |
| South Sudan | 2025 | -55.00% |
| Sri Lanka | 2019 | 7.10% |
| St. Kitts and Nevis | 2025 | 3.74% |
| St. Lucia | 2025 | 3.60% |
| St. Vincent and the Grenadines | 2025 | 2.05% |
| Suriname | 2025 | 1.33% |
| Sweden | 2006 | 1.90% |
| Switzerland | 2024 | 1.99% |
| Tajikistan | 2019 | 19.19% |
| Tanzania | 2020 | 9.64% |
| Thailand | 2025 | 4.85% |
| Timor-Leste | 2025 | 15.85% |
| Togo | 2016 | 3.78% |
| Tonga | 2025 | 4.47% |
| Trinidad and Tobago | 2024 | 7.64% |
| Uganda | 2018 | 14.75% |
| Ukraine | 2025 | 4.57% |
| United Kingdom | 2014 | -1.08% |
| United States | 2021 | -1.26% |
| Uruguay | 2025 | 5.49% |
| Uzbekistan | 2024 | 7.95% |
| Vanuatu | 2025 | 6.13% |
| Venezuela, RB | 2017 | -89.47% |
| Viet Nam | 2023 | 7.01% |
| West Bank and Gaza | 2021 | -3.12% |
| Yemen, Rep. | 2013 | 11.79% |
| Zambia | 2020 | -3.89% |
| Zimbabwe | 2025 | -20.07% |
How to interpret the comparison
First, the 148 latest observations do not share one reference year. Second, the measure is a lending rate adjusted by the GDP deflator, not a policy rate. Third, lending terms differ across countries, limiting direct comparability. Fourth, extreme one-year values can reflect rapid movements in either nominal lending rates or inflation.
Country-specific analysis should therefore combine this indicator with nominal lending rates, policy rates, inflation, deposit rates, and credit-market conditions. The most recent World Bank time series should also be checked because financial and macroeconomic data can be revised.
Source and calculation
The source is World Bank World Development Indicators FR.INR.RINR, Real interest rate (%). The World Bank describes it as the lending interest rate adjusted for inflation as measured by the GDP deflator. The 2025 mean, median, quartiles, sign counts, and rankings are calculated from the 67 observations dated 2025.
Frequently Asked Questions
Is the real interest rate the same as the central-bank policy rate?
No. The World Bank real interest rate is based on lending rates adjusted for inflation using the GDP deflator, not the policy rate.
What is the 2025 median real interest rate?
The median across the 67 observations dated 2025 is 4.89%, while the mean is 4.99%.
Does a negative real interest rate mean borrowing is free?
No. It means the lending rate is negative after the inflation adjustment; fees, risk premiums, and credit access still affect actual borrowing costs.
Related Articles
Green Map creates custom-edited map images using open geographic data sources such as geoBoundaries, Natural Earth, OpenStreetMap, and government open data. These maps are edited visual materials, not raw data files, and are provided for education, documents, presentations, and graphic reference.