The Logistics Performance Index component “Ease of arranging competitively priced shipments” is a survey-based score from 1 to 5, where 1 means very difficult and 5 means very easy. The World Bank LP.LPI.ITRN.XQ series contains 169 latest non-empty observations, of which 138 are dated 2022. Because the remaining observations are from 2018 or earlier, the same-year 2022 group is the main basis for country comparison.
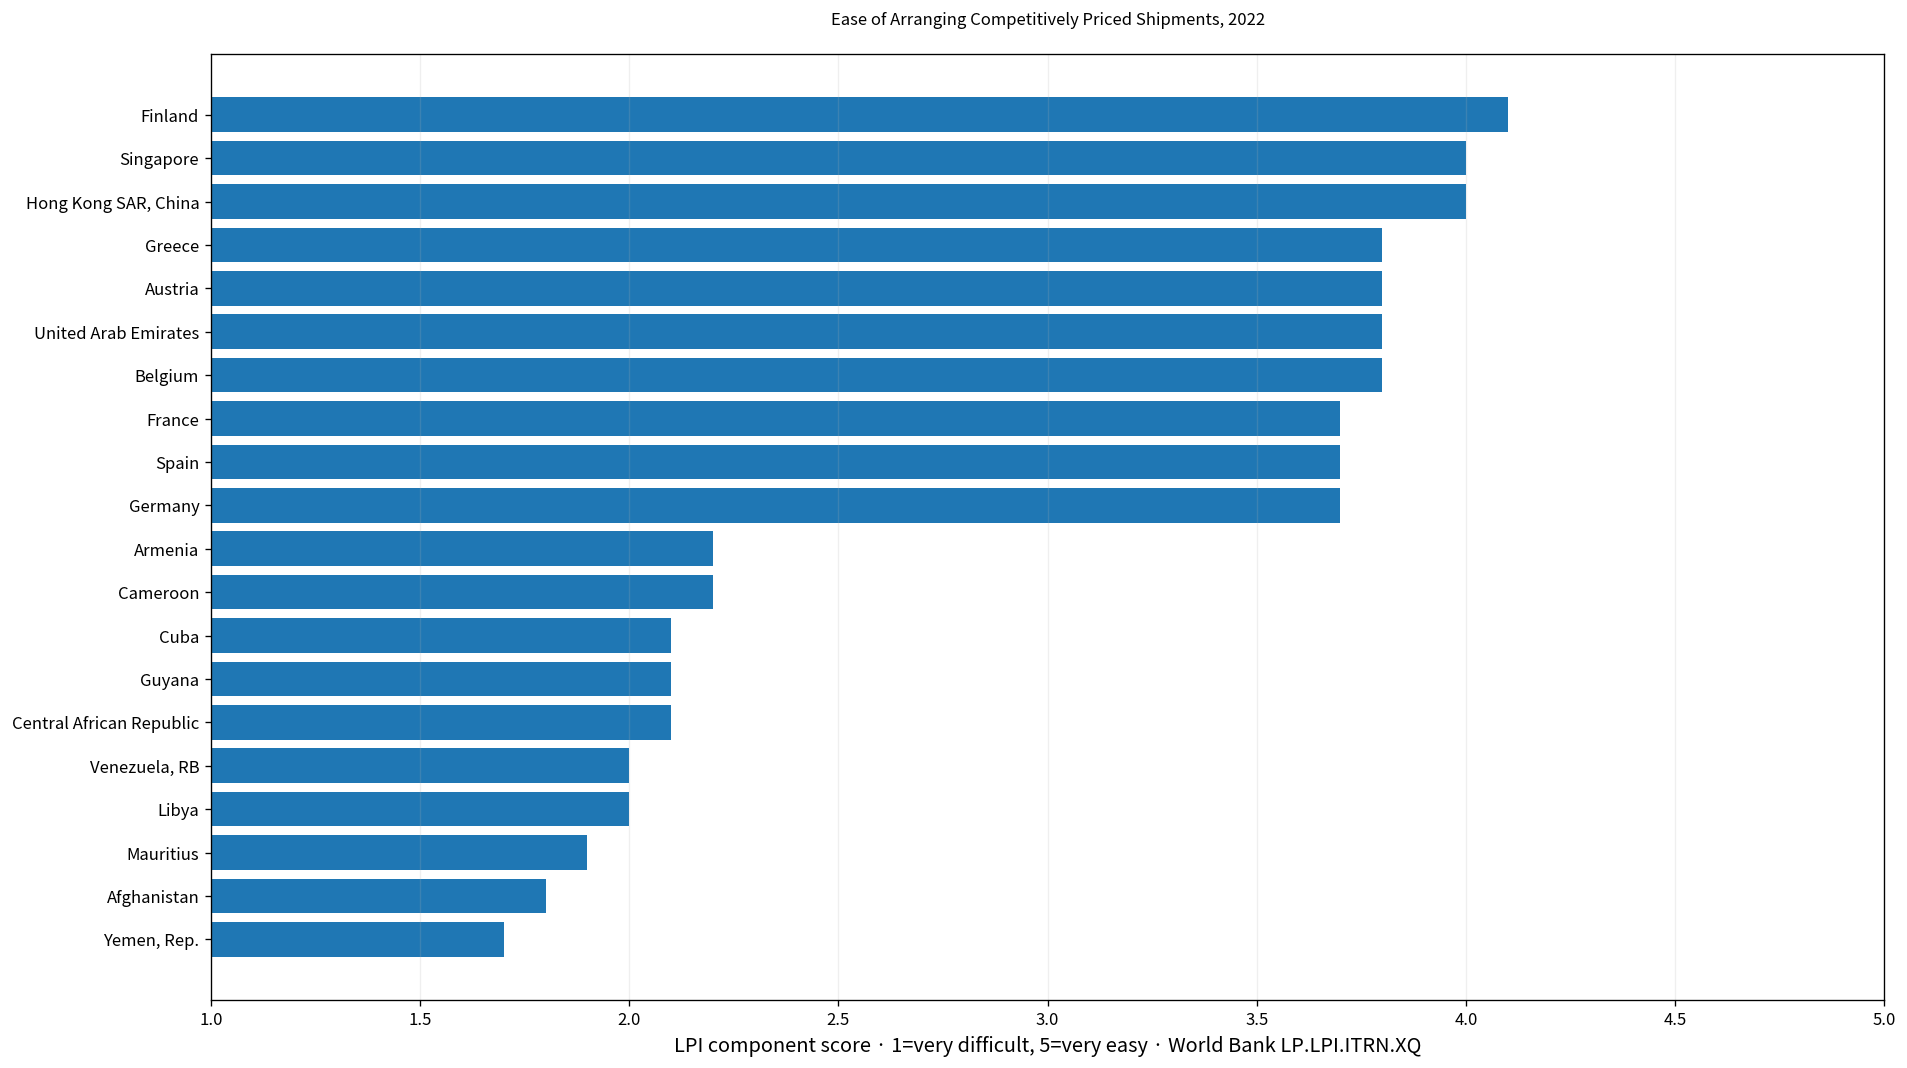
Table of Contents
This indicator is not a direct measure of freight prices
The phrase “competitively priced shipments” can sound like a freight-rate dataset, but the indicator does not record container rates, air-freight charges, or average shipping prices. Logistics professionals rate how easy it is to arrange competitively priced shipments to markets.
A high score therefore does not prove that every route is cheap, and a low score does not prove that every shipment is expensive. Carrier choice, market competition, connectivity, route availability, contracting conditions, and professional experience can all influence how respondents perceive the ease of arranging a competitively priced shipment.
It is one LPI dimension, not the overall Logistics Performance Index
The Logistics Performance Index evaluates several core dimensions, including customs, infrastructure, international shipments, logistics service quality, tracking and tracing, and timeliness. LP.LPI.ITRN.XQ represents the international-shipment dimension focused on arranging competitively priced shipments.
An economy can score well on this component while performing differently on customs or infrastructure. The component should therefore not be substituted for the overall LPI score or used as a complete ranking of logistics performance.
There are 138 observations from 2022 and 31 older latest values
Among the 169 latest observations, 138 are from 2022. Another 26 are from 2018, 3 from 2016, 1 from 2014, and 1 from 2007. The full latest-value set therefore spans fifteen years.
| Observation year | Economies/territories | Share of 169 |
|---|---|---|
| 2022 | 138 | 81.7% |
| 2018 | 26 | 15.4% |
| 2016 | 3 | 1.8% |
| 2014 | 1 | 0.6% |
| 2007 | 1 | 0.6% |
The mixed-year set has a mean of 2.84 and a median of 2.80, with a range from 1.50 to 4.10. These should not be presented as a current global average because older scores reflect different survey periods and logistics conditions.
The 2022 mean is 2.92 and the median is 2.90
The same-year 2022 subset contains 138 economies. Its mean is 2.92 and its median 2.90. The first quartile is 2.50 and the third quartile 3.40, so the middle half lies between 2.5 and 3.4.
66 observations are at least 3.0, 24 are at least 3.5, and 3 are at least 4.0. At the lower end, 29 are below 2.5 and 3 are below 2.0. Most observations are clustered in the upper twos and low-to-mid threes rather than at the extremes of the scale.
Finland is highest in 2022 at 4.1
Finland records 4.1, followed by Hong Kong SAR, China and Singapore at 4.0. The United Arab Emirates, Austria, Belgium, and Greece each record 3.8. Germany, Spain, France, Malaysia, and the Netherlands are at 3.7.
| 2022 rank | Economy/territory | Ease of arranging competitively priced shipments |
|---|---|---|
| 1 | Finland | 4.1 |
| 2 | Hong Kong SAR, China | 4 |
| 3 | Singapore | 4 |
| 4 | United Arab Emirates | 3.8 |
| 5 | Austria | 3.8 |
| 6 | Belgium | 3.8 |
| 7 | Greece | 3.8 |
| 8 | Germany | 3.7 |
| 9 | Spain | 3.7 |
| 10 | France | 3.7 |
| 11 | Malaysia | 3.7 |
| 12 | Netherlands | 3.7 |
| 13 | Canada | 3.6 |
| 14 | Switzerland | 3.6 |
| 15 | China | 3.6 |
A high score means respondents found it relatively easy to arrange competitively priced shipments. It should not be rewritten as a ranking of the world’s cheapest freight markets or as a direct measure of logistics expenditure.
Yemen, Rep. is lowest in 2022 at 1.7
Yemen, Rep. records 1.7, Afghanistan 1.8, and Mauritius 1.9. Libya and Venezuela, RB are at 2.0. Central African Republic, Cuba, and Guyana are at 2.1, while Armenia, Cameroon, Guinea, and Mauritania are at 2.2.
| Low-order position in 2022 | Economy/territory | Ease of arranging competitively priced shipments |
|---|---|---|
| 1 | Yemen, Rep. | 1.7 |
| 2 | Afghanistan | 1.8 |
| 3 | Mauritius | 1.9 |
| 4 | Libya | 2 |
| 5 | Venezuela, RB | 2 |
| 6 | Central African Republic | 2.1 |
| 7 | Cuba | 2.1 |
| 8 | Guyana | 2.1 |
| 9 | Armenia | 2.2 |
| 10 | Cameroon | 2.2 |
| 11 | Guinea | 2.2 |
| 12 | Mauritania | 2.2 |
| 13 | Bhutan | 2.3 |
| 14 | Fiji | 2.3 |
| 15 | Haiti | 2.3 |
A low score means respondents considered the task more difficult. The indicator does not establish a single cause. Market size, carrier availability, ports and airports, land connections, route density, conflict, sanctions, or landlocked geography may all matter, but the score alone cannot isolate their effects.
Why a 2023 LPI report can appear with 2022 indicator observations
The World Bank description notes that the 2023 LPI survey was conducted from September 6 to November 5, 2022. It generated 4,090 country assessments from 652 logistics professionals in 115 countries across World Bank regions. The indicator observations in this dataset are labeled 2022.
That means the report year and the survey or observation year should be distinguished. Seeing “2023 LPI” in the report title and “2022” in the World Bank indicator is not necessarily a contradiction; they refer to different parts of the publication and data cycle.
Respondents do not rate a random set of all countries
According to the source description, respondents evaluate eight countries on six core dimensions. The countries are selected using important export and import markets of the respondent’s home country, random selection, and, for landlocked economies, neighboring countries that connect them to international markets.
This design brings professional experience into the index, but it also means scores are survey-based assessments rather than mechanical observations from identical transactions. Small decimal differences should not be interpreted as perfectly precise cost gaps.
Older 2018 observations should be separated from the 2022 group
There are 26 latest observations dated 2018. Their mean is 2.50, median 2.50, and range 2.00 to 3.21. The average is lower than the 2022 mean of 2.92, but the groups contain different economies and reflect different survey periods.
Timor-Leste’s latest value is from 2007 at 1.5. Azerbaijan is from 2014, while several economies have 2016 observations. Those values can be included in a latest-available inventory but should not be described as current 2022 conditions.
A score of 3 is not a universal policy threshold
The scale runs from 1, very difficult, to 5, very easy. That does not automatically make 3 an official pass/fail line or a universal definition of adequate logistics. The most reliable use is relative comparison within the same survey framework.
The 2022 median of 2.9 simply means half of the 2022 observations are at or below 2.9 and half are at or above it. It should not be turned into a policy benchmark unless a separate source defines one.
A high score does not mean total logistics costs are low
Actual logistics expenditure can include international freight, inland transport, warehousing, customs brokerage, insurance, inventory carrying costs, delays, port charges, and contract terms. This LPI component does not add those costs into a single monetary measure.
A cost-focused analysis should use freight-rate data, trade-cost indicators, customs clearance time, port dwell time, distance, fuel prices, and other quantitative measures. The LPI component is best used as a professional perception measure that complements such data.
Complete list of the 169 latest observations
The table below lists the latest non-empty observation for each economy and territory in alphabetical order. Rows not dated 2022 retain their original observation year. For a strict same-year comparison, use only the 138 observations from 2022.
| Economy/territory | Observation year | Ease of arranging competitively priced shipments |
|---|---|---|
| Afghanistan | 2022 | 1.8 |
| Albania | 2022 | 2.8 |
| Algeria | 2022 | 3 |
| Angola | 2022 | 2.4 |
| Antigua and Barbuda | 2022 | 2.9 |
| Argentina | 2022 | 2.7 |
| Armenia | 2022 | 2.2 |
| Australia | 2022 | 3.1 |
| Austria | 2022 | 3.8 |
| Azerbaijan | 2014 | 2.57 |
| Bahamas, The | 2022 | 3.1 |
| Bahrain | 2022 | 3.1 |
| Bangladesh | 2022 | 2.6 |
| Belarus | 2022 | 2.6 |
| Belgium | 2022 | 3.8 |
| Benin | 2022 | 2.9 |
| Bhutan | 2022 | 2.3 |
| Bolivia | 2022 | 2.5 |
| Bosnia and Herzegovina | 2022 | 3.1 |
| Botswana | 2022 | 3 |
| Brazil | 2022 | 2.9 |
| Brunei Darussalam | 2018 | 2.51 |
| Bulgaria | 2022 | 3 |
| Burkina Faso | 2022 | 2.4 |
| Burundi | 2018 | 2.21 |
| Cambodia | 2022 | 2.3 |
| Cameroon | 2022 | 2.2 |
| Canada | 2022 | 3.6 |
| Central African Republic | 2022 | 2.1 |
| Chad | 2018 | 2.37 |
| Chile | 2022 | 2.7 |
| China | 2022 | 3.6 |
| Colombia | 2022 | 3 |
| Comoros | 2018 | 2.49 |
| Congo, Dem. Rep. | 2022 | 2.5 |
| Congo, Rep. | 2022 | 2.6 |
| Costa Rica | 2022 | 2.8 |
| Cote d’Ivoire | 2018 | 3.21 |
| Croatia | 2022 | 3.6 |
| Cuba | 2022 | 2.1 |
| Cyprus | 2022 | 3.1 |
| Czechia | 2022 | 3.4 |
| Denmark | 2022 | 3.6 |
| Djibouti | 2022 | 2.5 |
| Dominican Republic | 2022 | 2.4 |
| Ecuador | 2018 | 2.75 |
| Egypt, Arab Rep. | 2022 | 3.2 |
| El Salvador | 2022 | 2.6 |
| Equatorial Guinea | 2018 | 2.88 |
| Eritrea | 2018 | 2.09 |
| Estonia | 2022 | 3.4 |
| Ethiopia | 2016 | 2.56 |
| Fiji | 2022 | 2.3 |
| Finland | 2022 | 4.1 |
| France | 2022 | 3.7 |
| Gabon | 2022 | 2.6 |
| Gambia, The | 2022 | 2.6 |
| Georgia | 2022 | 2.7 |
| Germany | 2022 | 3.7 |
| Ghana | 2022 | 2.4 |
| Greece | 2022 | 3.8 |
| Grenada | 2022 | 2.6 |
| Guatemala | 2022 | 2.8 |
| Guinea | 2022 | 2.2 |
| Guinea-Bissau | 2022 | 2.9 |
| Guyana | 2022 | 2.1 |
| Haiti | 2022 | 2.3 |
| Honduras | 2022 | 3 |
| Hong Kong SAR, China | 2022 | 4 |
| Hungary | 2022 | 3.4 |
| Iceland | 2022 | 3.3 |
| India | 2022 | 3.5 |
| Indonesia | 2022 | 3 |
| Iran, Islamic Rep. | 2022 | 2.4 |
| Iraq | 2022 | 2.5 |
| Ireland | 2022 | 3.6 |
| Israel | 2022 | 3.5 |
| Italy | 2022 | 3.4 |
| Jamaica | 2022 | 2.4 |
| Japan | 2022 | 3.3 |
| Jordan | 2018 | 2.44 |
| Kazakhstan | 2022 | 2.6 |
| Kenya | 2018 | 2.62 |
| Korea, Rep. | 2022 | 3.4 |
| Kuwait | 2022 | 3.2 |
| Kyrgyz Republic | 2022 | 2.4 |
| Lao PDR | 2022 | 2.3 |
| Latvia | 2022 | 3.2 |
| Lebanon | 2018 | 2.8 |
| Lesotho | 2018 | 2.21 |
| Liberia | 2022 | 2.8 |
| Libya | 2022 | 2 |
| Lithuania | 2022 | 3.4 |
| Luxembourg | 2022 | 3.6 |
| Madagascar | 2022 | 2.9 |
| Malawi | 2018 | 2.55 |
| Malaysia | 2022 | 3.7 |
| Maldives | 2018 | 2.66 |
| Mali | 2022 | 2.6 |
| Malta | 2022 | 3 |
| Mauritania | 2022 | 2.2 |
| Mauritius | 2022 | 1.9 |
| Mexico | 2022 | 2.8 |
| Moldova | 2022 | 2.7 |
| Mongolia | 2022 | 2.5 |
| Montenegro | 2022 | 2.8 |
| Morocco | 2018 | 2.58 |
| Mozambique | 2016 | 3.06 |
| Myanmar | 2018 | 2.2 |
| Namibia | 2022 | 3 |
| Nepal | 2018 | 2.36 |
| Netherlands | 2022 | 3.7 |
| New Zealand | 2022 | 3.2 |
| Nicaragua | 2022 | 2.8 |
| Niger | 2018 | 2 |
| Nigeria | 2022 | 2.5 |
| North Macedonia | 2022 | 2.8 |
| Norway | 2022 | 3 |
| Oman | 2022 | 3.4 |
| Pakistan | 2018 | 2.63 |
| Panama | 2022 | 3.1 |
| Papua New Guinea | 2022 | 2.6 |
| Paraguay | 2022 | 2.7 |
| Peru | 2022 | 3.1 |
| Philippines | 2022 | 3.1 |
| Poland | 2022 | 3.3 |
| Portugal | 2022 | 3.1 |
| Qatar | 2022 | 3.1 |
| Romania | 2022 | 3.4 |
| Russian Federation | 2022 | 2.3 |
| Rwanda | 2022 | 2.4 |
| Sao Tome and Principe | 2018 | 2.42 |
| Saudi Arabia | 2022 | 3.3 |
| Senegal | 2018 | 2.36 |
| Serbia | 2022 | 2.9 |
| Sierra Leone | 2018 | 2.18 |
| Singapore | 2022 | 4 |
| Slovak Republic | 2022 | 3 |
| Slovenia | 2022 | 3.4 |
| Solomon Islands | 2022 | 2.9 |
| Somalia, Fed. Rep. | 2022 | 2.4 |
| South Africa | 2022 | 3.6 |
| Spain | 2022 | 3.7 |
| Sri Lanka | 2022 | 2.8 |
| Sudan | 2022 | 2.4 |
| Sweden | 2022 | 3.4 |
| Switzerland | 2022 | 3.6 |
| Syrian Arab Republic | 2022 | 2.3 |
| Tajikistan | 2022 | 2.5 |
| Tanzania | 2016 | 2.98 |
| Thailand | 2022 | 3.5 |
| Timor-Leste | 2007 | 1.5 |
| Togo | 2022 | 3 |
| Trinidad and Tobago | 2022 | 2.5 |
| Tunisia | 2018 | 2.5 |
| Turkiye | 2022 | 3.4 |
| Turkmenistan | 2018 | 2.29 |
| Uganda | 2018 | 2.76 |
| Ukraine | 2022 | 2.8 |
| United Arab Emirates | 2022 | 3.8 |
| United Kingdom | 2022 | 3.5 |
| United States | 2022 | 3.4 |
| Uruguay | 2022 | 2.7 |
| Uzbekistan | 2022 | 2.6 |
| Venezuela, RB | 2022 | 2 |
| Viet Nam | 2022 | 3.3 |
| Yemen, Rep. | 2022 | 1.7 |
| Zambia | 2018 | 3.05 |
| Zimbabwe | 2022 | 2.5 |
How to interpret the comparison
First, this is a survey score about ease of arranging competitively priced shipments, not a freight-price dataset. Second, it is one LPI component rather than the overall index. Third, the 169 latest observations do not share one year. Fourth, a small score difference should not be translated directly into a percentage difference in freight cost.
A broader logistics assessment should combine this component with customs, infrastructure, logistics competence, tracking, timeliness, and quantitative measures of time and cost. For a particular country, the most recent LPI report and current market freight data provide important additional context.
Source and calculation
The source is World Bank World Development Indicators LP.LPI.ITRN.XQ, Logistics performance index: Ease of arranging competitively priced shipments (1=low to 5=high). The 2022 mean, median, quartiles, threshold counts, and rankings are calculated from the 138 observations dated 2022.
Frequently Asked Questions
Does this indicator directly measure international freight prices?
No. It is a survey-based LPI component in which logistics professionals rate how easy it is to arrange competitively priced shipments on a 1-to-5 scale.
What is the 2022 median?
The median across the 138 observations dated 2022 is 2.90, while the mean is 2.92.
Why are the observations dated 2022 when the report is called LPI 2023?
The World Bank notes that the 2023 LPI survey was conducted in September–November 2022, and these indicator observations are labeled 2022.
Related Articles
Green Map creates custom-edited map images using open geographic data sources such as geoBoundaries, Natural Earth, OpenStreetMap, and government open data. These maps are edited visual materials, not raw data files, and are provided for education, documents, presentations, and graphic reference.